Indicator & technique library · Indicator library
Williams %R Explained: Formula, Settings and Signals
At a glance
- Williams %R measures where the current close sits inside the highest high and lowest low of the last n periods, on a scale from 0 to -100.
- It was developed by American trader Larry Williams and is mathematically the fast stochastic %K shifted down by 100.
- Default 14 periods, with -20 and -80 as the conventional overbought and oversold thresholds.
- It reads ranges well and pins at extremes during strong trends, so a trend filter matters more than the threshold itself.
Williams %R (pronounced "percent R", sometimes written Williams Percent Range) is a bounded momentum oscillator that answers one narrow question: where did price close relative to the highest high and lowest low of the last n bars? The answer is expressed on an inverted scale from 0 (close at the top of the range) to -100 (close at the very bottom).
Traders care about it because it is fast, simple and hard to misread mechanically. It reacts to the current bar immediately, it has no smoothing to hide behind, and its scale is comparable across any asset or timeframe. That speed is also its weakness: in a trending crypto market %R can sit in "overbought" territory for days while price keeps rising.
What is Williams %R?
Williams %R is a range-location oscillator. For a chosen lookback (14 bars by default) it finds the highest high and the lowest low in that window, then measures how far below the highest high the current close sits, as a percentage of the full range.
If the close is exactly at the top of the 14-bar range, %R is 0. If it closes at the very bottom, %R is -100. A close in the middle gives -50. Nothing else enters the calculation: no averages, no volume, no volatility normalization.
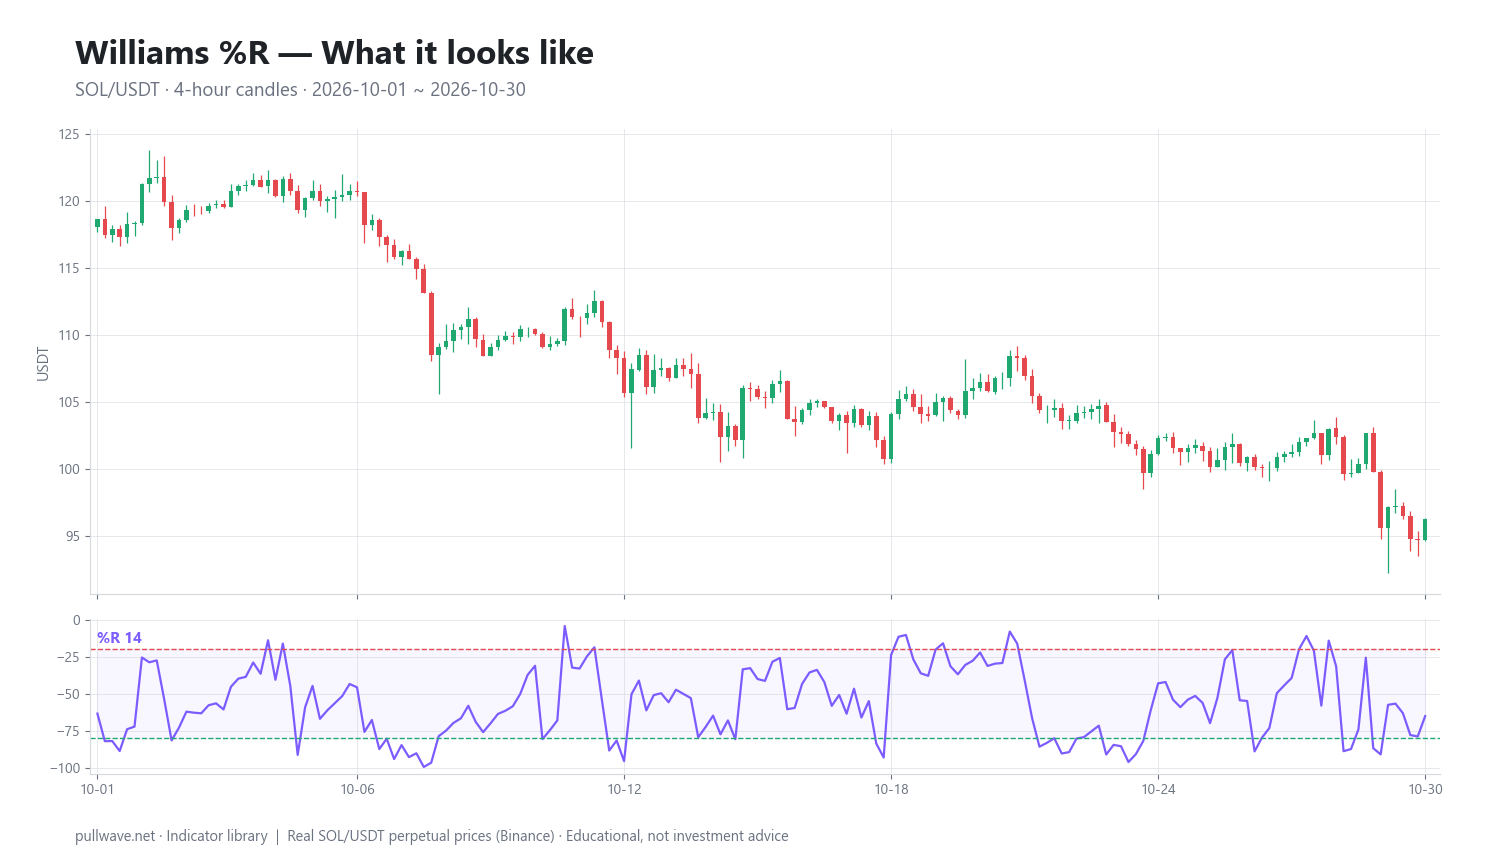
Figure 1 shows %R(14) plotted under real SOL/USDT 4-hour candles. Notice how the oscillator rides the upper band while price grinds higher, then flushes to the lower band within a handful of bars when the market rolls over — the signature behavior you need to understand before using it.
The idea behind it (theory and history)
Williams %R is credited to Larry Williams, the American futures trader and author, who introduced it in his 1970s commodity trading work — it is most often associated with his 1973 book How I Made One Million Dollars Last Year Trading Commodities. Exact first-publication details vary between sources, so treat the date as approximate rather than quotable precision.
The theory is a momentum-exhaustion idea borrowed from floor-trading practice. In a healthy uptrend, buyers are strong enough to push the close near the top of the recent range day after day. When rallies start closing in the lower half of the range, the demand that was driving the move is fading, even if price has not yet turned down.
That makes %R a measure of closing strength within a range, not of price level. It is deliberately short-memory: only the last n bars exist as far as the formula is concerned. Anything older drops out of the window completely, which is why %R can jump sharply when an old extreme high or low rolls out of the lookback.
It is worth knowing that %R is not an independent invention relative to the stochastic oscillator — the two are the same measurement on different scales. %R equals the fast stochastic %K minus 100. The inverted scale was a presentation choice, not a different theory.
How it is calculated
Step by step, for a lookback of n bars:
- Find the highest high of the last n bars (including the current bar).
- Find the lowest low of the last n bars (including the current bar).
- Subtract the current close from the highest high. This is how far price finished below the top of the range.
- Divide that by the full range (highest high minus lowest low).
- Multiply by -100 to express it on the 0 to -100 scale.
``` %R(n) = (HighestHigh(n) - Close) / (HighestHigh(n) - LowestLow(n)) * -100
Relationship to the fast stochastic: %K(n) = (Close - LowestLow(n)) / (HighestHigh(n) - LowestLow(n)) * 100 %R(n) = %K(n) - 100 ```
A worked micro-example: suppose over the last 14 bars the highest high is 110, the lowest low is 95, and the current close is 101. The range is 15, the distance from the high is 9, so %R = (9 / 15) × -100 = -60. Price closed in the lower-middle of its two-week range.
One edge case matters in practice. If the highest high equals the lowest low — a perfectly flat window, which can happen on illiquid low-timeframe crypto data — the denominator is zero. Most platforms return 0, -100 or carry the previous value forward. Know what yours does before trusting a signal from a dead market.
Default settings and variations
The standard setting is 14 periods. The number comes from the same tradition as Wilder's 14-period RSI: roughly half a lunar month, or about two to three weeks of daily trading bars in the commodity markets where these tools were developed. There is nothing magic about it — it is a convention that survived because it balances responsiveness and noise reasonably well on daily charts.
| Setting | Behavior | Typical use |
|---|---|---|
| %R 7–10 | Very fast, many touches of the extremes | Scalping, intraday range work |
| %R 14 | Default balance | General purpose, most published rules assume it |
| %R 20–28 | Slower, extremes are rarer and more meaningful | Swing trading, 4h and daily crypto charts |
| %R 50+ | Position of close within a long range | Regime context rather than signals |
The threshold defaults are -20 for overbought and -80 for oversold. Those are symmetric cutoffs marking the top and bottom 20% of the recent range. Traders who want fewer, stronger signals use -10 and -90; traders working in slow, well-defined ranges sometimes widen to -30 and -70.
Two common variations are worth knowing. The first is applying a short moving average (3 to 5 periods) to %R to reduce whipsaw, which effectively recreates a slow stochastic. The second is shifting the zones asymmetrically in a known trend — for example requiring only -60 for an oversold reading in a confirmed uptrend, because pullbacks in strong trends rarely reach the full extreme.
How to read it
Read the level first. Above -20 means recent closes are at the top of the range; below -80 means they are at the bottom. Between -20 and -80 the oscillator carries little information and is best ignored.
Read the persistence second. A single bar poking above -20 in a choppy market is noise. %R pinned above -20 for ten or twenty consecutive bars is the signature of a strong trend, and in that state the "overbought" label is misleading — it is a strength reading, not a warning.
Read the exit from the zone third. Most practitioners treat the moment %R crosses back out of an extreme (for example rising back above -80) as more informative than the moment it enters. Entering an extreme tells you momentum is strong; leaving it tells you that strength has paused.
Finally, read failure to reach the extreme. If a market makes a new price high but %R fails to climb back above -20, the close is no longer finishing at the top of its range — a classic momentum divergence.
How traders use it
1. Range fading. In a sideways market with clear horizontal boundaries, readings below -80 near support and above -20 near resistance mark the edges of the range. Works when volatility is contracting and the range has already held several times. Fails the moment the range breaks — and the breakout bar will, by construction, produce an extreme %R reading, which is exactly the signal a fader would act on.
2. Pullback timing inside a trend. Define the trend with something external (a 200-period moving average, higher-timeframe structure), then use %R dipping into oversold within an uptrend as a timing tool for the pullback. Works in orderly trends with regular retracements. Fails in parabolic moves, where price simply never pulls back far enough to register a sub -80 reading, and in trend reversals, where the first oversold print is followed by many more.
3. Trend confirmation and the pinning effect. Instead of fading extremes, use them as evidence. A market where %R spends most of its time above -50 and repeatedly touches 0 is being bought aggressively. Works for staying in a position and filtering out counter-trend ideas. Fails near the end of an extended move, when the pinning behavior persists right into the top.
4. Divergence. Price makes a higher high while %R makes a lower high (or fails to return above -20). This flags deteriorating closing strength. Works as an early warning at the end of a mature trend, especially on 4h and daily crypto charts. Fails frequently as a standalone entry — divergences can repeat three or four times before price responds, and in a strong trend they often never resolve.
In crypto, timeframe choice changes what you are measuring. On a 4-hour chart, %R(14) covers about 56 hours — a bit over two days of continuous 24/7 trading. There is no weekend gap to reset momentum, so extremes can persist longer than in traditional markets. On perpetual futures with leverage, the pinning effect is dangerous: a "deeply oversold" reading during a liquidation cascade can get substantially more oversold before anything stabilizes.
Example on a real SOL chart
This is one indicator, on one market, over one month. It illustrates behavior; it does not test anything. Treat it as a case study, not evidence.
The chart is SOL/USDT perpetual on Binance, 4-hour candles, 1 October to 30 October 2026, with %R set to 14. The last close in the window was 96.30, with %R at -65.21 — in the lower half of the recent range but not at an extreme. Across the whole window, %R spent 26.7% of the time in an extreme zone (above -20 or below -80), which is typical for a market alternating between short trends and chop.
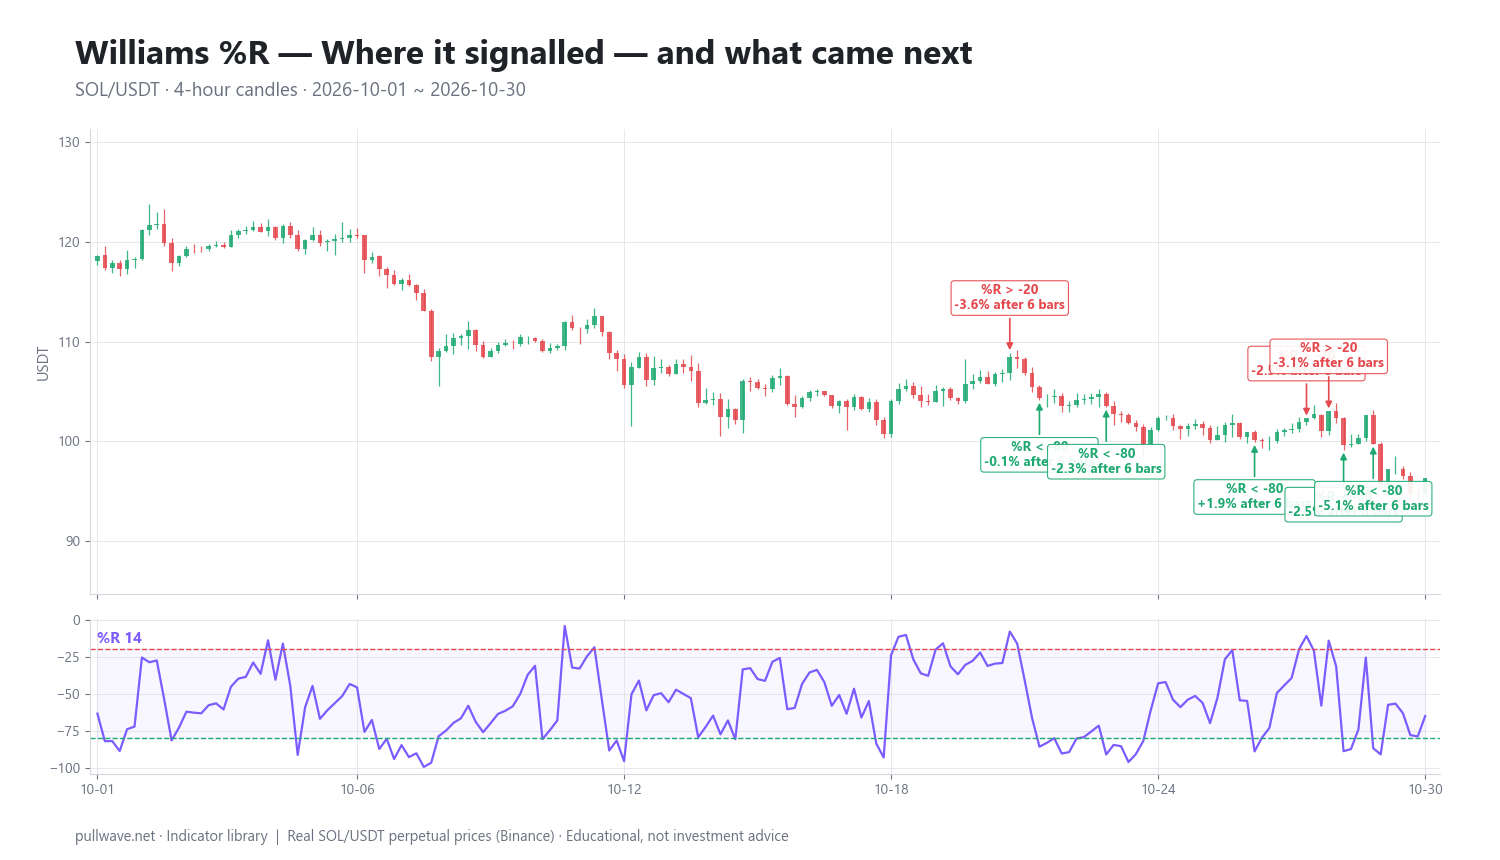
Figure 2 marks each threshold crossing and the percentage move that followed after 6 bars (24 hours) and 18 bars (3 days). Here are ten of them:
| Date (UTC) | Signal | Price | After 6 bars | After 18 bars |
|---|---|---|---|---|
| 2026-10-19 00:00 | %R > -20 | 105.22 | +0.06% | +0.24% |
| 2026-10-20 00:00 | %R > -20 | 105.28 | +0.47% | -1.04% |
| 2026-10-21 12:00 | %R > -20 | 108.44 | -3.56% | -8.04% |
| 2026-10-22 04:00 | %R < -80 | 104.38 | -0.12% | -2.67% |
| 2026-10-23 16:00 | %R < -80 | 103.52 | -2.33% | -2.98% |
| 2026-10-27 00:00 | %R < -80 | 100.13 | +1.86% | -2.94% |
| 2026-10-28 04:00 | %R > -20 | 102.31 | -2.54% | -5.87% |
| 2026-10-28 16:00 | %R > -20 | 103.02 | -3.15% | -6.52% |
| 2026-10-29 00:00 | %R < -80 | 99.64 | -2.46% | -3.35% |
| 2026-10-29 16:00 | %R < -80 | 99.78 | -5.09% | -3.49% |
There were 22 signals in total over the month, and the dataset counts 14 of 22 as being followed by a move in the signal's direction over the measurement horizon. That sounds encouraging until you look at the magnitudes: several moves were a fraction of a percent, well inside normal 4-hour noise for SOL, while the losing cases included clusters of -3% to -8%.
The cluster behavior is the real lesson. The three overbought prints on 19–21 October came in a market that was still drifting up, and the first two led nowhere; the third, at 108.44, preceded a -8.04% move over three days. Then the oversold prints on 22, 23, 27 and 29 October fired repeatedly into a declining market — the 29 October 16:00 signal at 99.78 was followed by another -5.09% within 24 hours. That is the classic %R failure mode: in a directional move, the oscillator keeps generating the same counter-trend signal while price keeps going.
Also note the mixed signs between the two horizons. On 27 October the market was up +1.86% after 6 bars but down -2.94% after 18. A short-horizon oscillator says nothing about what happens three days later.
Common mistakes
- Treating -20 and -80 as decisions. They are descriptions of where the close sits in a range. In a trend, the extreme zone is where price spends most of its time.
- Fading the first extreme after a breakout. A breakout from a range mathematically produces an extreme %R reading. Fading it means betting against the move at its strongest point.
- Using %R on dead, low-volume charts. When the n-bar range is tiny, the denominator is tiny, and %R swings from 0 to -100 on noise.
- Ignoring the lookback rollover. %R can jump without any meaningful price move, simply because an old high or low dropped out of the 14-bar window.
- Stacking it with the stochastic. %R and the fast stochastic are the same number. Running both is one signal pretending to be two.
- Comparing readings across timeframes as if they were equivalent. %R at -90 on a 5-minute chart and -90 on a daily chart describe completely different events.
Combining it with other tools
The single most valuable companion is a trend filter. A long-period moving average, higher-timeframe structure, or a directional measure such as ADX tells you which of %R's two personalities applies: fade the extremes (range) or respect the pinning (trend). Without that context, you are guessing which regime you are in.
Price structure adds location. An oversold %R reading sitting on a level that has been defended three times is a different proposition from the same reading in open space halfway through a decline.
Volatility measures such as ATR or Bollinger Bands help with sizing and with expectations. If ATR has doubled in a week, a -85 reading can get to -100 and stay there, and any level-based stop needs to be wider than it would be in a quiet market.
A slower momentum tool — RSI on a longer setting, or a MACD histogram — gives a second, less twitchy opinion. The combination works best when the slow tool defines the bias and %R handles timing, not the other way around.
Finally, in perpetual futures, context from funding rates and open interest is worth more than another oscillator. An overbought %R reading alongside extremely positive funding describes a crowded long position; the same reading with neutral funding describes ordinary strength.
Frequently asked questions
Q. What is the best Williams %R setting for crypto?
There is no universally best setting. The 14-period default is a reasonable starting point on 4-hour and daily charts; many swing traders slow it to 20 or 28 to cut down on false extremes in 24/7 markets, while intraday traders shorten it to 7 to 10. Change the lookback deliberately and keep it consistent, rather than tuning it after every losing signal.
Q. Is Williams %R the same as the stochastic oscillator?
Mathematically, yes — Williams %R equals the fast stochastic %K minus 100, so the two lines have identical shape on an inverted scale. The practical differences are presentational: %R runs from 0 to -100 and is usually plotted unsmoothed, while most stochastic implementations add a %D signal line and optional smoothing. Running both on the same chart adds no new information.
Q. What does a Williams %R reading of -100 mean?
It means the current bar closed at the lowest low of the entire lookback window — the weakest possible close relative to recent range. It indicates maximum downside momentum, not a floor. In a strong downtrend, %R can print near -100 for many consecutive bars.
Q. Does Williams %R work in a strong trend?
Not as an overbought/oversold tool. During strong trends the oscillator pins near one extreme and the counter-trend signals it generates fire repeatedly against the move, as the late-October cluster in the SOL example above shows. Used as a trend-confirmation reading, or with a trend filter to take only pullback signals in the trend direction, it behaves far better.
Q. What is the difference between Williams %R and RSI?
RSI compares the size of average gains to average losses over the lookback and is smoothed, so it moves slowly and rarely reaches its extremes. %R compares the close to the high-low range and is unsmoothed, so it reaches its extremes constantly. RSI is better for divergence and regime reading; %R is better for short-term range location.
Q. Can Williams %R be used for exits rather than entries?
Many traders find it more useful that way. A position opened on structure can be reduced when %R leaves an extreme in the adverse direction, or held as long as the oscillator keeps pinning in the trend direction. Because %R responds to the current bar immediately, it tends to flag momentum loss earlier than smoothed indicators — at the cost of more false alarms.
Key takeaways
- Williams %R, credited to Larry Williams in the early 1970s, measures where the close sits inside the n-bar high-low range on a 0 to -100 scale.
- The formula is
(HighestHigh - Close) / (HighestHigh - LowestLow) * -100; it is the fast stochastic %K shifted down by 100, so the two are the same indicator. - Default 14 periods with -20/-80 thresholds; slower settings (20–28) suit 4-hour and daily crypto charts where extremes are frequent.
- The thresholds describe range position, not opportunity — in trends %R pins at an extreme and counter-trend signals cluster and fail.
- In the SOL/USDT 4h window shown, 22 signals produced mixed results, with several sub-1% moves and losing clusters of -3% to -8%: one illustration of why %R needs a trend filter and structural context, not a standalone rule.
Educational material. Charts use real SOL/USDT perpetual prices; past behaviour does not predict future results. Not investment advice.