Indicator & technique library · Indicator library
RSI Indicator Explained: Formula, Settings and Signals
At a glance
- RSI is a bounded momentum oscillator created by J. Welles Wilder Jr. in 1978 that compares average gains to average losses over a lookback period, usually 14.
- It is read on a 0-100 scale, with 70/30 as the classic overbought/oversold levels and 50 as a rough trend midline.
- RSI behaves very differently in ranges (mean reversion) than in trends (it can stay stretched for days), so regime matters more than the level itself.
- In the SOL/USDT 4h example window, four oversold readings produced short bounces 3 out of 4 times after 6 bars, but only 1 of 4 was still positive after 18 bars.
The Relative Strength Index (RSI) is a momentum oscillator that measures how one-sided recent price changes have been. It compresses the tug-of-war between up closes and down closes into a single line that moves between 0 and 100, which makes "strong" and "weak" comparable across assets, timeframes and price levels.
Traders care about RSI because it answers a question raw price cannot: is the current move being driven by steady, broad participation, or by a last gasp? It is one of the few indicators that is simple enough to compute by hand, old enough to be in every charting package, and still misread by most people who use it — usually because they treat 70 and 30 as instructions rather than as descriptions.
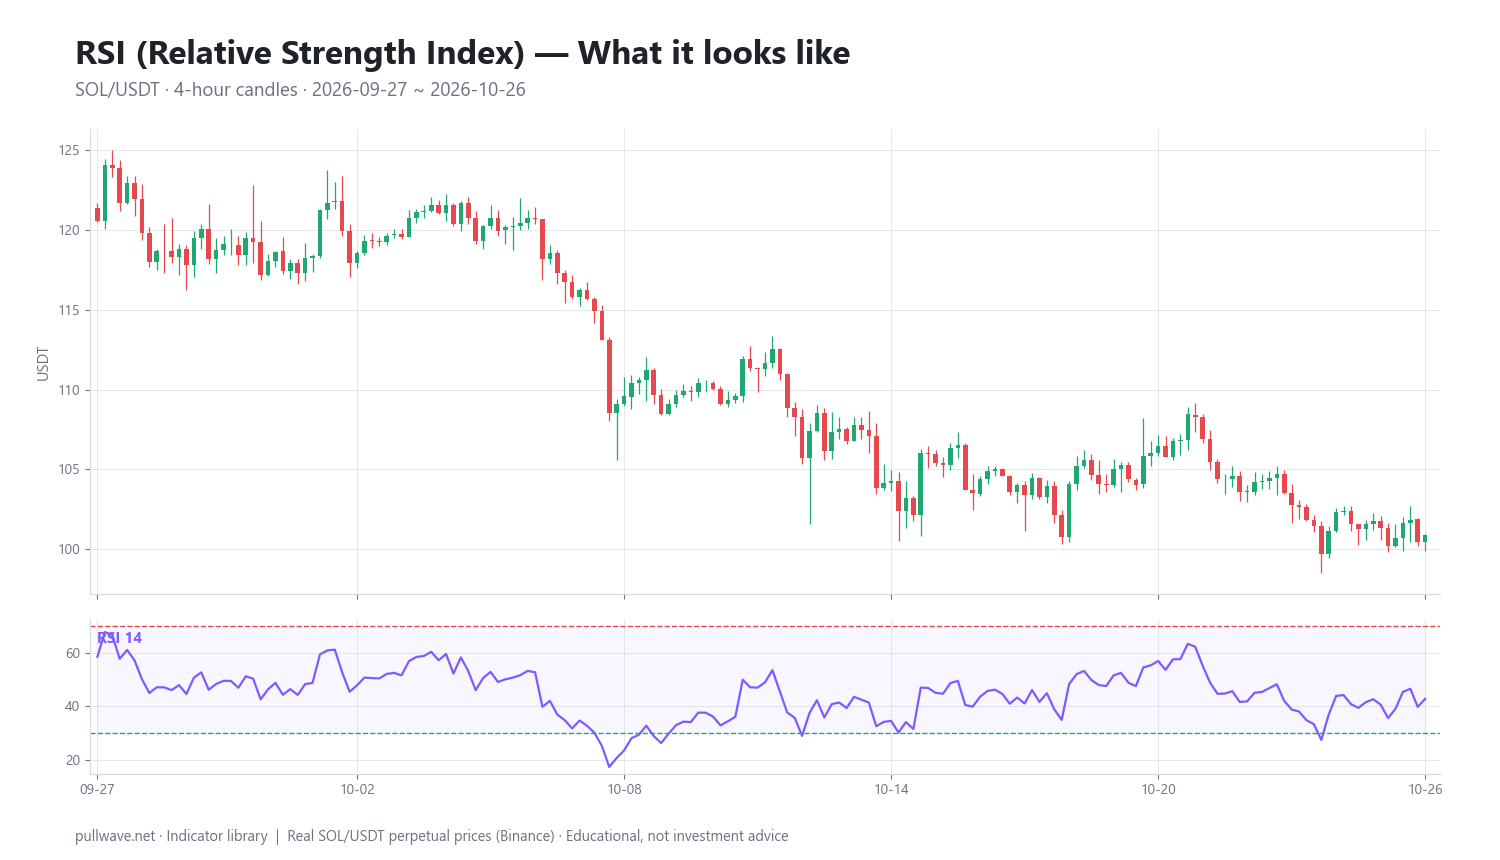
The figure above shows RSI(14) plotted under SOL/USDT perpetual 4h candles for the window used later in the example. The upper panel is price; the lower panel is the oscillator with its 70 and 30 reference lines, so you can see directly how the line reacts to each leg of the move.
What is RSI (Relative Strength Index)?
RSI is a bounded momentum oscillator. Over a lookback window (14 bars by default) it averages the size of up moves and the size of down moves, forms a ratio between them, and maps that ratio onto a 0–100 scale.
The name is a common source of confusion. "Relative Strength" here does not mean comparing one asset against another (that is relative strength comparison, a different tool). RSI compares an asset to its own recent behavior — the average gain versus the average loss of the same instrument.
Because the output is bounded, RSI(14) on SOL at $100 and RSI(14) on BTC at $60,000 are directly comparable. Both say the same thing: the proportion of recent movement that has been upward. A reading of 70 means roughly that average gains are more than twice as large as average losses over the lookback; a reading of 30 means the reverse.
The idea behind it (theory and history)
RSI was created by J. Welles Wilder Jr., a mechanical engineer turned commodities trader, and published in 1978 in his book New Concepts in Technical Trading Systems. The same book introduced ATR, the Parabolic SAR and the Directional Movement system (ADX/DMI) — a remarkable run of indicators that are all still in use. RSI was also presented in Commodities magazine in 1978, which is how it spread to floor traders before the book did.
Wilder's problem was practical. Pure momentum lines (today's close minus the close n bars ago) jump when a single large bar drops out of the lookback window, and they are unbounded, so you cannot say what "high" means without studying each market separately. He wanted something that smoothed those artifacts and that had fixed boundaries.
His solution was to separate price changes into gains and losses, smooth each one separately with an exponential-style average, take their ratio (RS), and normalize it into a 0–100 range. The normalization step is what makes 70 and 30 meaningful across markets, and it is why RSI can never run off the top or bottom of the chart.
One important nuance from later work: Andrew Cardwell, who taught RSI extensively in the 1980s and 1990s, argued that RSI's real information is in the range it travels in, not in single touches of 70 or 30. In sustained uptrends RSI tends to live roughly between 40 and 80; in downtrends roughly between 20 and 60. That reframing is the single most useful upgrade to Wilder's original presentation.
How it is calculated
Step by step, for a lookback of 14 bars:
- For each bar, take the change in closing price versus the previous close.
- If the change is positive, it is a gain and that bar's loss is 0. If negative, the absolute value is a loss and the gain is 0. Unchanged closes count as zero for both.
- For the very first value, take a simple average of the first 14 gains and the first 14 losses.
- For every bar after that, apply Wilder's smoothing: multiply the previous average by 13, add the current bar's gain (or loss), divide by 14.
- Divide the average gain by the average loss to get RS (relative strength).
- Convert RS to a 0–100 reading with the final formula.
``` change = close[i] - close[i-1] gain[i] = max(change, 0) loss[i] = max(-change, 0)
AvgGain[i] = (AvgGain[i-1] * 13 + gain[i]) / 14 (Wilder smoothing) AvgLoss[i] = (AvgLoss[i-1] * 13 + loss[i]) / 14
RS = AvgGain / AvgLoss RSI = 100 - (100 / (1 + RS))
If AvgLoss = 0 -> RSI = 100 ```
Two details matter in practice. First, Wilder smoothing is an exponential average with a smoothing factor of 1/14, which is slower than a 14-period EMA (factor 2/15). Platforms that substitute an EMA or SMA will produce slightly different values — usually a point or two, occasionally more at turning points. Second, RSI is recursive: today's value depends on all previous values, so charts with very little loaded history can show small discrepancies until the smoothing settles, typically after a few hundred bars.
Default settings and variations
Wilder used 14 periods. He applied 14 to several of his indicators, and the common explanation is that it approximates half of a monthly cycle in the daily commodity data he worked with. He did not publish an optimization study; 14 is a sensible, well-tested convention rather than a magic number.
The trade-off is mechanical. A shorter lookback gives fewer bars of smoothing, so the line swings further and reaches 70/30 far more often. A longer lookback flattens the line and makes extremes rare but more meaningful.
| Setting | Behavior | Typical use |
|---|---|---|
| RSI 2–5 | Extremely fast, hits extremes constantly | Short-term mean reversion systems (popularized by Larry Connors) |
| RSI 7–9 | Responsive, more signals, more noise | Intraday crypto, scalping on 5m–1h |
| RSI 14 | Wilder's default, balanced | General-purpose on any timeframe |
| RSI 21–25 | Smooth, few extremes | Swing and position trading, trend filtering |
Level variations are just as important as period variations:
- 70/30 — Wilder's original thresholds.
- 80/20 — fewer, more selective signals; often used in strongly trending or very volatile markets such as crypto.
- 60/40 — used as trend range boundaries in Cardwell's approach rather than as reversal triggers.
- 50 — the midline; sustained readings above it describe net upward momentum, below it net downward momentum.
Related tools built on RSI include Stochastic RSI (Tushar Chande and Stanley Kroll, The New Technical Trader, 1994), which applies a stochastic calculation to RSI values and oscillates far faster, and Connors RSI, which blends a short RSI with streak length and rate-of-change ranking.
How to read it
Read RSI in three layers, from most to least reliable.
Layer one — the range. Where has RSI been living over the last few weeks? If it repeatedly tops out near 60 and bottoms near 20, the market is in a downward regime and "oversold" readings are normal, not exceptional. If it bottoms near 40 and pushes past 80, the regime is upward.
Layer two — the midline. Crossings of 50 are a rough momentum flip. They lag price, but they filter out a lot of noise and are useful for deciding which direction of signal you are willing to act on at all.
Layer three — the extremes and divergences. Touches of 70 and 30 describe a stretched condition. A divergence occurs when price makes a new high (or low) and RSI does not — the new extreme in price was made with less momentum behind it. Divergence is a warning about the character of a move, not a timing tool; in strong trends divergences can repeat several times before anything happens.
Wilder's own preferred signal was the failure swing: RSI drops below 30, rebounds, pulls back without making a new low, then breaks above the rebound high. The structure is in the oscillator itself and does not require a price divergence.
How traders use it
1. Mean reversion inside a range. When price is oscillating between horizontal boundaries, RSI touching 30 or 70 often coincides with the edges of that range. Works when volatility is stable and there is no dominant trend. Fails when the range breaks — the first real trend leg will pin RSI at an extreme and every "oversold" reading becomes an entry into a falling market.
2. Trend filtering with the midline or Cardwell ranges. Instead of fading extremes, some traders only take signals aligned with the RSI regime: in an uptrend, buy the pullbacks where RSI dips to 40–50. Works when there is a clear, established trend. Fails when the market is choppy — RSI crosses 50 repeatedly and generates whipsaw after whipsaw.
3. Divergence as a warning. Bearish divergence at a new high suggests the move is being carried by fewer and smaller up-bars. Works when it appears after an extended run and is confirmed by a structural break in price. Fails when used alone in a powerful trend; crypto trends routinely produce three or four consecutive divergences before a top.
4. Cross-timeframe confirmation. Check RSI on a higher timeframe to define the regime, then use a lower timeframe for timing. Works when the two agree. Fails when traders quietly switch timeframes until they find one that supports a position they already wanted.
In crypto specifically: markets run 24/7, so there are no overnight gaps to distort the gain/loss series, but there is also no session close to reset momentum — trends can extend through what would be a weekend in traditional markets. On perpetual futures, persistently stretched RSI readings often accompany extreme funding, and fading them with leverage turns an "overbought" opinion into a liquidation risk if the trend simply continues.
Example on a real SOL chart
The window is SOL/USDT perpetual on Binance, 4h candles, 2026-09-27 to 2026-10-26, with RSI 14, Wilder smoothing, levels 70/30. The last close in the window was 100.91 with RSI at 42.8.
The regime is visible in two numbers: RSI spent 0.0% of the window above 70 and 6.1% of it below 30. There was no overbought condition at all — this was a declining, momentum-poor stretch in which the oscillator worked the lower half of its range.
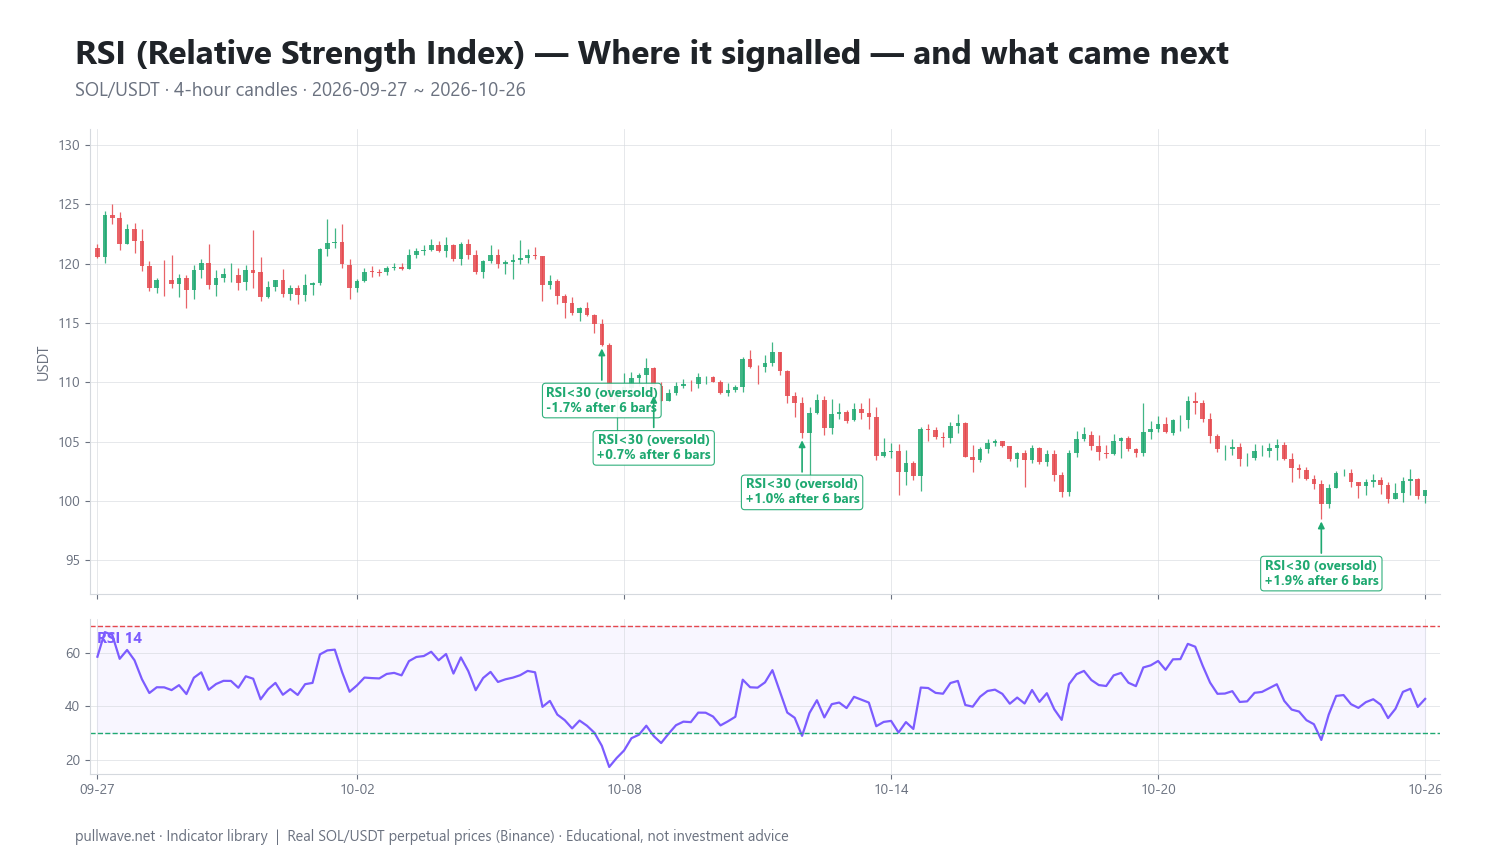
Four oversold signals occurred. The figure above marks each of them on the same candles, and the table below shows the close at each signal and the percentage move 6 bars (one day) and 18 bars (three days) later.
| Date (UTC) | Signal | Price | After 6 bars | After 18 bars |
|---|---|---|---|---|
| 2026-10-08 08:00 | RSI<30 (oversold) | 113.13 | −1.69% | −3.15% |
| 2026-10-09 12:00 | RSI<30 (oversold) | 109.66 | +0.70% | −0.73% |
| 2026-10-12 20:00 | RSI<30 (oversold) | 105.70 | +1.02% | −0.30% |
| 2026-10-24 12:00 | RSI<30 (oversold) | 99.72 | +1.88% | +1.19% |
Read the two columns together, because they tell different stories. After 6 bars, 3 of 4 signals had moved in the direction the oversold reading implied — but the gains were small, between +0.70% and +1.88%, while the one failure lost −1.69%. After 18 bars, only 1 of 4 was still positive. Each oversold reading occurred at a lower price than the one before: 113.13, then 109.66, then 105.70, then 99.72.
That is the textbook behavior of an oscillator in a downtrend. The short bounces were real but shallow, and holding through them gave the moves back. The last signal, at 99.72, was the only one that produced a gain at both horizons — and it is also the one closest to the end of the data, so there is no information about what followed.
This is a single indicator on a single market over roughly one month of 4h bars — four signals in total. It is an illustration of how RSI behaves when the regime is one-sided, not evidence that oversold readings work or do not work. A different window, a different asset, or a 1h chart instead of 4h would produce a different table.
Common mistakes
- Treating 70/30 as a signal rather than a condition. RSI can sit above 70 for weeks in a strong trend. "Overbought" means the market has been strong, not that it is about to fall.
- Ignoring the regime. Fading oversold readings in a downtrend — exactly the pattern in the SOL table above — is the most common way traders lose money with RSI.
- Acting on divergence alone. Divergence describes weakening momentum, not a reversal date. Without a structural confirmation in price it is an opinion with no trigger.
- Shortening the period to get more signals. RSI(5) will touch 30 constantly. More signals is not more information; it is the same information at a worse signal-to-noise ratio.
- Mixing smoothing methods. If your backtest uses Wilder smoothing and your chart uses an EMA, your levels will not line up at the moments that matter most.
- Assuming RSI knows about volume or liquidity. It is built purely on closing prices. A thin, manipulated wick and a well-supported rally look identical to it.
Combining it with other tools
RSI measures one dimension — the momentum of closing prices — so the useful combinations add a different dimension.
- Trend direction: a long moving average or ADX tells you whether you are in a regime where fading extremes is plausible at all. This pairs naturally with the Cardwell range idea.
- Volatility: Bollinger Bands or ATR tell you whether the market is expanding or compressing. An oversold RSI at a compressed lower band is a different situation from an oversold RSI in an expanding downtrend.
- Structure: horizontal support/resistance, prior swing points or volume profile give a divergence something to confirm against. Momentum warning plus a broken structure is far stronger than either alone.
- Volume: since RSI is price-only, on-balance volume or simple volume analysis can flag whether a push to an extreme had participation behind it.
Avoid stacking tools that measure the same thing. RSI, the Stochastic Oscillator and Williams %R are all momentum / overbought–oversold oscillators, and in practice they repeat most of the same information even though their inputs differ: RSI is built purely on closes, while the Stochastic measures where the close sits inside the high–low range of the lookback — %K = (close − lowest low) / (highest high − lowest low) — and Williams %R measures the same range from the other end, (highest high − close) / (highest high − lowest low). Running all three mostly produces three versions of one signal and three times the confidence you are entitled to.
Frequently asked questions
Q. What is the best RSI setting for crypto?
There is no single best setting, but RSI(14) with 70/30 remains the sensible default, and many crypto traders widen the levels to 80/20 because high volatility pushes the oscillator to extremes more often. Shorter periods such as 7 or 9 suit intraday charts at the cost of far more false signals. Whatever you choose, keep it constant long enough to learn how that specific configuration behaves on the market you trade.
Q. What does it mean when RSI is above 70 or below 30?
Above 70 means average gains over the lookback have been roughly twice the size of average losses; below 30 means the opposite. These are descriptions of recent momentum, not predictions. In a strong trend an asset can remain above 70 or below 30 for many consecutive bars, which is why the levels work better as context than as triggers.
Q. Is RSI a leading or lagging indicator?
RSI is derived entirely from past closing prices, so it is technically lagging. It is often called "leading" because divergences and failure swings can appear before a price reversal is visible, but those patterns are only visible after the bars that form them have closed. Treat it as a description of what has already happened, with some predictive value about regime.
Q. What is RSI divergence?
Divergence occurs when price makes a higher high while RSI makes a lower high (bearish), or price makes a lower low while RSI makes a higher low (bullish). It indicates that the new price extreme was achieved with less momentum than the previous one. Divergences can repeat several times inside a strong trend, so most traders wait for a confirming break in price structure before acting on one.
Q. Which timeframe should I use RSI on?
Higher timeframes produce fewer and more stable signals; lower timeframes produce many more, most of them noise. A common approach is to define the regime on the daily or 4h chart and use a lower timeframe only for timing. The critical discipline is choosing the timeframe before you look, not after you have an opinion.
Q. Does RSI work on 24/7 crypto markets?
The calculation works identically, and the absence of weekend gaps actually makes the gain/loss series cleaner than in markets with session breaks. The practical difference is that continuous trading allows trends to extend without the pauses that traditional markets impose, so extreme readings can persist longer than a stocks-trained intuition expects. On perpetual futures with leverage, that persistence is a real risk, not a statistical curiosity.
Key takeaways
- RSI, created by J. Welles Wilder Jr. in 1978, normalizes the ratio of average gains to average losses into a 0–100 oscillator; the default lookback is 14 with Wilder smoothing.
- The levels 70 and 30 describe a stretched condition, not a reversal; the range RSI travels in over recent weeks carries more information than any single touch.
- RSI's usefulness is regime-dependent: it suits mean reversion in ranges and trend-pullback timing in trends, and it misleads badly when the two are confused.
- In the SOL/USDT 4h window, all four signals were oversold readings in a declining market — 3 of 4 bounced within 6 bars, but only 1 of 4 was still positive after 18 bars. One window, one market, no conclusion about the tool overall.
- Combine RSI with tools that measure something different — trend, volatility, structure, volume — rather than with other momentum oscillators such as the Stochastic or Williams %R that largely repeat the same signal.
Educational material. Charts use real SOL/USDT perpetual prices; past behaviour does not predict future results. Not investment advice.