Indicator & technique library · Indicator library
Moving Averages Explained: SMA vs EMA, Formula, Uses
At a glance
- A moving average smooths price into a single trend line; SMA weights all bars equally while EMA weights recent bars more heavily.
- The EMA smoothing factor is 2/(n+1), chosen so an EMA and an SMA of the same length share the same average data age of (n-1)/2 bars.
- Lengths like 20, 50 and 200 come from legacy equity trading calendars, so in 24/7 crypto they are conventions rather than optimized values.
- Crossovers capture large trends but cluster and fail in ranges — in the SOL 4h example only 2 of 5 signals moved in the signal's direction.
A moving average is the simplest way to turn a noisy price series into a single, smooth line that answers one question: where has price been centered recently? Nothing more. It does not predict, it does not oscillate between fixed bounds, and it has no "overbought" level. It averages.
That simplicity is why moving averages sit underneath half the indicator universe — MACD, Bollinger Bands, Keltner Channels, RSI's internal smoothing, the signal line of almost every oscillator. If you understand how a simple moving average (SMA) and an exponential moving average (EMA) differ, and how badly both behave in a sideways market, you understand the mechanics of a large part of technical analysis.
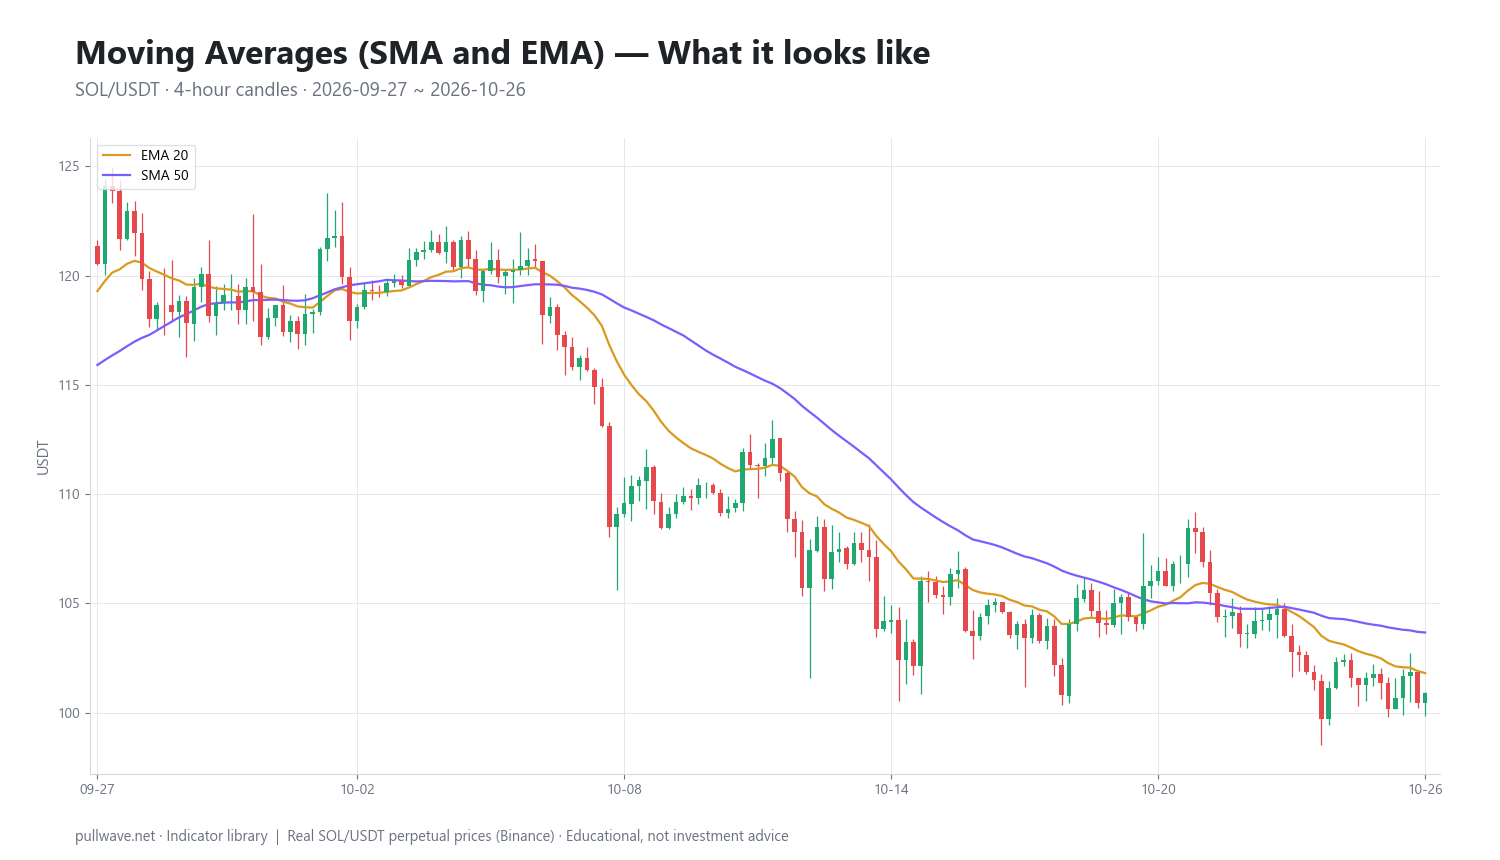
Figure 1 shows an EMA 20 and an SMA 50 drawn over SOL/USDT perpetual 4h candles. Notice two things: both lines point the same general direction most of the time, and the faster EMA hugs price while the slower SMA stays further away and turns later. Everything else on this page is a consequence of those two facts.
What is a moving average (SMA and EMA)?
A moving average is the average of the last n prices, recalculated on every new bar. As the newest price enters the window, the oldest one drops out — the window "moves," which is where the name comes from. Plotted under price, it becomes a trend line that adapts automatically instead of being drawn by hand.
The two standard forms differ only in how they weight the data:
- SMA (simple moving average) gives every bar in the window the same weight. The close from 50 bars ago counts exactly as much as the close that just printed.
- EMA (exponential moving average) gives the newest bar the most weight and lets older bars fade geometrically. Nothing is ever fully discarded, but a bar from 100 periods back contributes almost nothing.
So the SMA is a fair average of a fixed window, and the EMA is a recency-weighted average of all history. The practical consequence: the EMA reacts to a change in trend sooner, and whipsaws more often. The SMA is slower and steadier. Neither is "better" — they sit at different points on the same lag-versus-noise trade-off.
The idea behind it (theory and history)
Moving averages were not invented for trading. They are a standard smoothing tool from early 20th-century statistics and economics, used to strip seasonal and random variation out of time series long before anyone plotted them on a price chart. The underlying assumption is that an observed price equals a slower underlying trend plus noise, and that averaging cancels much of the noise while leaving the trend.
In markets, moving averages became a mainstream timing tool in the mid-20th century. Richard Donchian, a futures trader and the central figure in early trend-following, is widely credited with popularizing mechanical moving-average crossover rules in the 1950s and 1960s — his 5- and 20-day crossover method is the ancestor of every "fast crosses slow" system you will see today. Joseph Granville's 1960 book on daily stock market timing and later studies of the 200-day average helped cement long moving averages as a measure of primary trend. J.M. Hurst's The Profit Magic of Stock Transaction Timing (1970) gave a cycle-based rationale for why a moving average of a given length suppresses some frequencies of price movement and lets others through.
The exponential form came from operations research rather than from a trading floor. Exponential smoothing was developed in the 1950s for forecasting demand and inventory — Robert G. Brown and Charles C. Holt are the names usually cited — and was adapted to market timing by technicians in the 1960s. P.N. Haurlan is commonly credited with being among the first to apply exponential smoothing to stock market trend measurement. The details of who used what first are murky, and you should treat any single attribution with mild suspicion; what is not in doubt is that the math predates its use in markets.
The honest theoretical statement is this: a moving average is a low-pass filter. It passes slow movements and attenuates fast ones, and it pays for that with lag. For an SMA of length n, the average age of the data in the line is (n-1)/2 bars — an SMA 50 is, loosely, telling you where the market was about 24 bars ago. That lag is not a flaw to be engineered away. It is the price of smoothing, and every "zero-lag" variant pays for reduced lag with increased false signals somewhere else.
How it is calculated
Simple moving average, step by step:
- Choose a length n (number of bars) and a price source (usually the close).
- Add the last n closes together.
- Divide by n. That is the value for the current bar.
- On the next bar, add the new close and remove the oldest one, then repeat.
Exponential moving average, step by step:
- Choose a length n. Compute the smoothing factor
alpha = 2 / (n + 1). - Seed the line. The common convention is to use an SMA of the first n closes as the initial EMA value.
- For every bar after that, take
alphatimes the current close plus(1 - alpha)times the previous EMA value. - Repeat. Because each value depends on the previous one, an EMA technically depends on all prior data, so two platforms with different seeding or different chart history can show slightly different EMA values. The difference becomes negligible after a few hundred bars.
``` SMA(n)t = (P_t + P(t-1) + ... + P_(t-n+1)) / n
alpha = 2 / (n + 1) EMA(n)t = alpha * P_t + (1 - alpha) * EMA(n)(t-1) EMA(n)_0 = SMA(n) over the first n bars (seed) ```
For an EMA 20, alpha = 2/21 ≈ 0.0952, so each new close contributes about 9.5% of the new value and the prior EMA carries the remaining 90.5%.
Why 2/(n+1) and not 1/n? Because that choice makes the EMA's average data age equal to the SMA's: (1 - alpha)/alpha = (n-1)/2. In other words, an EMA 20 and an SMA 20 are calibrated to have the same center of mass, which is what makes the lengths comparable across the two types. It is a convention, but a well-motivated one.
Default settings and variations
There is no sacred number. The common lengths are popular because they map onto trading horizons and because enough people watch them that they occasionally become self-reinforcing reference levels.
| Setting | Typical use | Notes |
|---|---|---|
| EMA 9 / EMA 12 | Very short-term momentum | Noisy; mostly for intraday structure |
| EMA 20 / SMA 20 | Swing trend, pullback reference | 20 ≈ one month of daily bars |
| SMA 50 | Intermediate trend | ~10 weeks of daily data |
| EMA 50 / 100 | Medium trend on lower timeframes | Common on crypto 1h–4h |
| SMA/EMA 200 | Primary trend, "bull vs bear" line | Heavily watched on daily charts |
The classic pairs are 5/20 (Donchian's original), 20/50, and 50/200 — the 50/200 daily crossover is what financial media call a "golden cross" (fast above slow) or "death cross" (fast below slow). The numbers 20, 50 and 200 come from the trading calendar of legacy equity markets: roughly one month, one quarter and about forty weeks (~10 months) of sessions, since a trading year runs closer to 252 sessions than to 200. Crypto trades every day, so those calendar meanings do not transfer cleanly, which is a good argument for choosing lengths by the behavior of the market you trade rather than by tradition.
Common variations worth knowing:
- WMA (weighted MA) — weights decline linearly across a fixed window, so the newest bar gets
2/(n+1)of the total weight, exactly the EMA's alpha. Its average data age is(n-1)/3, which makes a WMA(n) more responsive than both an SMA(n) and an EMA(n) — but because the window is finite, it has no long tail and drops old data abruptly. - SMMA / RMA (Wilder's smoothing) — an EMA with
alpha = 1/n, used inside RSI, ATR and ADX. A Wilder 14 behaves roughly like an EMA 27. - HMA, DEMA, TEMA — constructions that reduce lag by extrapolating from multiple averages. They turn faster and overshoot more.
- VWMA — weights each bar by volume. Interesting on spot markets; treat cautiously on perpetuals, where reported volume reflects leveraged turnover rather than capital committed.
- Price source — close is standard;
hl2orhlc3produce slightly smoother lines and slightly different crossover timing.
How to read it
Read a moving average in three layers, in this order.
Slope. The direction of the line is the trend statement. A rising SMA 50 says the 50-bar center of price is moving up. A flat line says there is no net drift — and a flat slow average is the single most reliable warning that crossover signals are about to become unreliable.
Position of price relative to the line. Closes persistently above the average describe an uptrend; closes persistently below describe a downtrend. The fraction of closes on one side is a quick regime gauge. Over the SOL window used in the example below, only 27.8% of 4h closes were above the SMA 50 — a market spending most of its time under its own intermediate average.
Distance and ordering. How far price has stretched from the average is a crude measure of how extended a move is (this is exactly what Bollinger Bands and Keltner Channels formalize). The ordering of several averages — fast above medium above slow — describes trend quality; when the lines cross repeatedly and sit on top of each other, the market is ranging.
How traders use it
1. Trend filter. Use a slow average to decide which direction you are willing to trade at all, and take entries from something else. Works when the market has a persistent drift and the slow line has a clear slope. Fails in a range, where price oscillates across a flat average and the filter flips constantly. The filter is also at its worst at the exact moment a long trend ends, since lag guarantees you are still on the wrong side for a while.
2. Dynamic support and resistance / pullback entries. In a trend, traders watch for price to pull back to a moving average and resume. Works in strong, orderly trends where the average has become a visible reference. Fails badly in two situations: when the trend is accelerating (price never comes back) and when the trend is over (the "support" breaks and the same level becomes resistance). A moving average is not a price level — it is a moving statistic, and it has no obligation to hold.
3. Crossover signals. A fast average crossing a slow one marks a change in the relationship between short- and medium-term price centers. Works as a way to catch and hold large trends, which is its historical purpose. Fails in chop, where crossovers cluster and each one reverses. The example below is a clean demonstration of this failure mode.
4. Measuring extension and mean reversion. The gap between price and a moving average (or between two averages) is used to judge whether a move has run far from its base. Works for sizing down or trailing out of an extended position. Fails as a standalone reversal trigger: in crypto, "too far from the average" can persist for days, and fading it with leverage is how accounts get liquidated during a trend's strongest phase.
For crypto specifically: 24/7 trading means there is no daily reset and no gap structure, so weekly-boundary effects are weaker and the usual "20 = one month" framing does not apply. On perpetual futures, remember that a moving-average bounce entry near a crowded level often sits just above a dense band of liquidation prices; using high leverage to enter "right at the EMA" means a normal wick can close the position before the thesis is tested. Higher timeframes (4h and above) produce fewer crossovers than 5m or 15m charts, where a 20/50 pair will generate signals almost continuously.
Example on a real SOL chart
The window below is SOL/USDT perpetual on Binance, 4h candles, 2026-09-27 to 2026-10-26, with an EMA 20 and an SMA 50. The last close in the window was 100.91. Only 27.8% of closes in the window were above the SMA 50, and the EMA 20 crossed the SMA 50 five times in roughly four weeks — about one crossover every six days on a 4h chart. That frequency alone tells you the regime: this was not a trending window, it was a declining, choppy one.
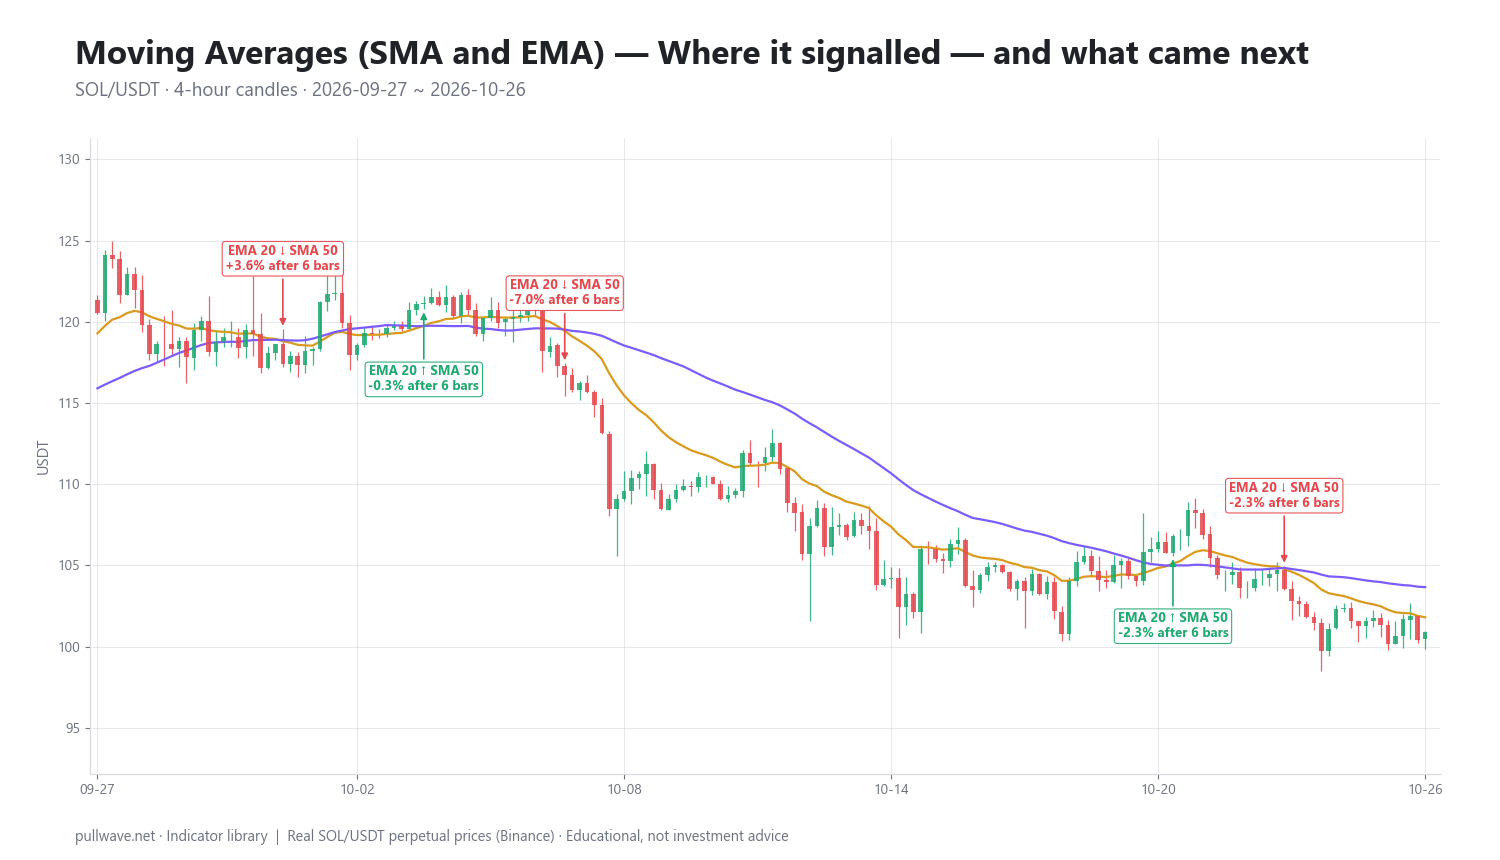
Figure 2 marks each crossover and the percentage move 6 bars and 18 bars later.
| Date (UTC) | Signal | Price | After 6 bars | After 18 bars |
|---|---|---|---|---|
| 2026-10-01 04:00 | EMA 20 ↓ SMA 50 | 117.42 | +3.65% | +3.13% |
| 2026-10-04 08:00 | EMA 20 ↑ SMA 50 | 121.17 | −0.35% | −3.20% |
| 2026-10-07 12:00 | EMA 20 ↓ SMA 50 | 116.72 | −7.04% | −5.39% |
| 2026-10-21 04:00 | EMA 20 ↑ SMA 50 | 106.80 | −2.27% | −4.63% |
| 2026-10-23 16:00 | EMA 20 ↓ SMA 50 | 103.52 | −2.33% | −2.98% |
Counting a bearish cross as "correct" if price fell and a bullish cross as "correct" if price rose, 2 of the 5 signals moved in the signal's direction over the measured horizons — the bearish crosses on October 7 and October 23. The October 1 bearish cross was followed by a rise of 3.65% within 6 bars, and the October 4 bullish cross was followed by a drift of −3.20% over 18 bars. The October 21 bullish cross came at 106.80 and price was 4.63% lower 18 bars later.
Two observations are worth more than the hit rate. First, of the two signals that aligned with the dominant direction and followed through, the October 7 bearish cross at 116.72 produced the largest move in the table (−7.04% after 6 bars), roughly three times the size of the October 23 follow-through. That asymmetry — many small or wrong-way outcomes and the occasional large one — is the structural signature of trend-following. Second, both bullish crosses in this window failed, which is what you should expect when only 27.8% of closes sit above the slow average: a counter-trend crossover in a downtrending market is the lowest-quality version of the signal.
This is one indicator, one market, one 30-day window, measured at two arbitrary horizons. Results were mixed, and a different pair of lengths, timeframe or outcome window would produce a different table. It illustrates how moving-average crossovers behave in a choppy regime. It is not evidence that the tool works or does not work.
Common mistakes
- Treating the line as a prediction. A moving average is a lagging summary of past prices. The slope tells you what has been happening, not what will.
- Optimizing the lengths on past data. If 21/55 looks better than 20/50 on last quarter's chart, that is almost always noise. Pick lengths that match your holding period and leave them alone.
- Taking crossovers without a regime check. The flatter the slow average, the more worthless the crossover. Requiring the slow line to have a clear slope removes a large share of the bad signals — at the cost of entering later.
- Using too many averages. Five lines on a chart do not add five pieces of information; they add one piece of information and four ways to rationalize a trade you already wanted.
- Acting on an unclosed bar. On a 4h crypto chart, an intrabar cross can un-cross before the candle closes. Decide in advance whether your rules use closed bars, and be consistent.
- Confusing the SMA/EMA choice with an edge. The difference between them is a few bars of timing. The regime you are trading in matters an order of magnitude more.
Combining it with other tools
Moving averages are a trend tool, so they pair best with something that measures a different dimension of price.
- With a trend-strength measure. ADX or simply the slope of the slow average separates "trending" from "ranging" and tells you whether crossover signals deserve attention at all.
- With volatility bands. Bollinger Bands are a 20-period SMA plus standard-deviation envelopes; Keltner Channels use an EMA plus ATR. Both turn "distance from the average" into a measurable quantity and add a natural squeeze/expansion read.
- With an oscillator. RSI or Stochastic can time an entry within a trend defined by a moving average. The standard combination — only act on oscillator pullbacks that agree with the slow average's slope — exists precisely because oscillators alone are terrible in trends and moving averages alone are terrible in ranges.
- With MACD. MACD is two EMAs differenced (12 and 26) plus a 9-period signal line. It is a moving-average crossover rendered as a histogram, so running both is largely duplication rather than confirmation.
- With structure and volume. Horizontal support/resistance, prior swing highs and lows, and volume profile give fixed reference levels; a moving average gives a moving one. Confluence between a fixed level and a rising average is more interesting than either alone.
Frequently asked questions
Q. What is the difference between SMA and EMA?
An SMA weights every bar in its window equally, while an EMA weights recent bars more heavily and lets older bars decay exponentially. The result is that the EMA turns sooner after a change in trend but also produces more false turns in choppy conditions. Both are calibrated to the same average data age when the EMA uses alpha = 2/(n+1), so an EMA 20 and SMA 20 are broadly comparable in horizon.
Q. What is the best moving average setting for crypto?
There is no single best setting, and any specific pair that looks optimal on past data is usually curve-fit. What matters is matching the length to your holding period: short averages (9–20) for intraday and swing structure, 50 for intermediate trend, 200 for primary trend. On crypto's 24/7 charts the traditional calendar logic behind 20/50/200 does not apply, so treat those numbers as conventions rather than as optimized values.
Q. Is EMA better than SMA for day trading?
EMAs are more popular on lower timeframes because they respond faster to new information, which matters when holding periods are measured in minutes. That responsiveness also means more whipsaw during consolidations, so the advantage is situational rather than absolute. Many traders use an EMA for entry timing and an SMA for the slower trend filter precisely to get both behaviors.
Q. What is a golden cross and a death cross?
A golden cross occurs when a faster moving average crosses above a slower one — classically the 50-day above the 200-day — and a death cross is the opposite. They are widely reported because the lengths are long and heavily watched, not because long-term studies show reliable short-term edge. Both are lagging by construction: by the time a 50/200 cross prints, a large part of the move has already occurred.
Q. Which price should a moving average be calculated on?
The closing price is the standard and the most defensible choice, since the close is the price most participants treat as the bar's settlement. Alternatives such as hl2 (midpoint) or hlc3 (typical price) produce marginally smoother lines and can shift crossover timing by a bar. The choice is a minor detail compared with length and timeframe.
Q. Do moving averages lag, and can that be fixed?
Yes, lag is mathematically unavoidable: an SMA of length n has an average data age of (n-1)/2 bars, and a same-length EMA has the same. A WMA shortens that to (n-1)/3, and variants such as HMA, DEMA and TEMA reduce apparent lag further by extrapolating from multiple averages — but they overshoot and generate more false turns in return. Lag is the cost of smoothing, so the realistic goal is choosing how much of it you want, not eliminating it.
Key takeaways
- A moving average is a low-pass filter on price: it reveals the trend by discarding fast movement, and the unavoidable cost is lag of roughly
(n-1)/2bars for an SMA or EMA. - SMA weights all bars in its window equally; EMA weights recent bars more via
alpha = 2/(n+1), trading smoothness for responsiveness. - Moving averages are regime-dependent tools. They earn their keep in persistent trends and fail systematically in flat, choppy markets — check the slow line's slope before trusting any crossover.
- In the SOL/USDT 4h window shown, an EMA 20 / SMA 50 pair produced 5 crossovers in about four weeks with only 2 of 5 moving in the signal's direction, while 27.8% of closes sat above the slow average. That is one illustration of chop, not a verdict on the tool.
- Length and timeframe matter far more than SMA-versus-EMA; pick them from your holding period rather than from backtest optimization, and combine the average with a tool that measures something other than trend.
Educational material. Charts use real SOL/USDT perpetual prices; past behaviour does not predict future results. Not investment advice.