Indicator & technique library · Indicator library
Bollinger Bands Explained: Formula, Settings and Uses
At a glance
- Bollinger Bands are a 20-period moving average with bands 2 standard deviations above and below, so the envelope widens and narrows with volatility.
- John Bollinger developed them in the early 1980s and treats band tags as relative definitions of high and low, not as buy or sell signals.
- Real containment with the 20/2 default is roughly 88-90% of closes, not the 95% implied by the normal distribution.
- On SOL/USDT 4h over one month, 90.6% of closes stayed inside the bands and 7 of 9 band tags mean-reverted after 6 bars but only 5 of 9 after 18.
Bollinger Bands are a volatility envelope: a moving average in the middle and two bands placed a number of standard deviations above and below it. Because standard deviation is recalculated on every bar, the bands widen when the market gets noisy and contract when it goes quiet. They are one of the few indicators that answer the question "is this price move big relative to recent conditions?" rather than just "is price up or down?"
Traders care about them because they turn an absolute price into a relative one. A close at 121 means nothing on its own; a close above the upper band means that price is at the high end of its own recent distribution. In crypto — where realized volatility can triple in a week and then collapse — that relative framing is often more useful than any fixed-percentage channel.
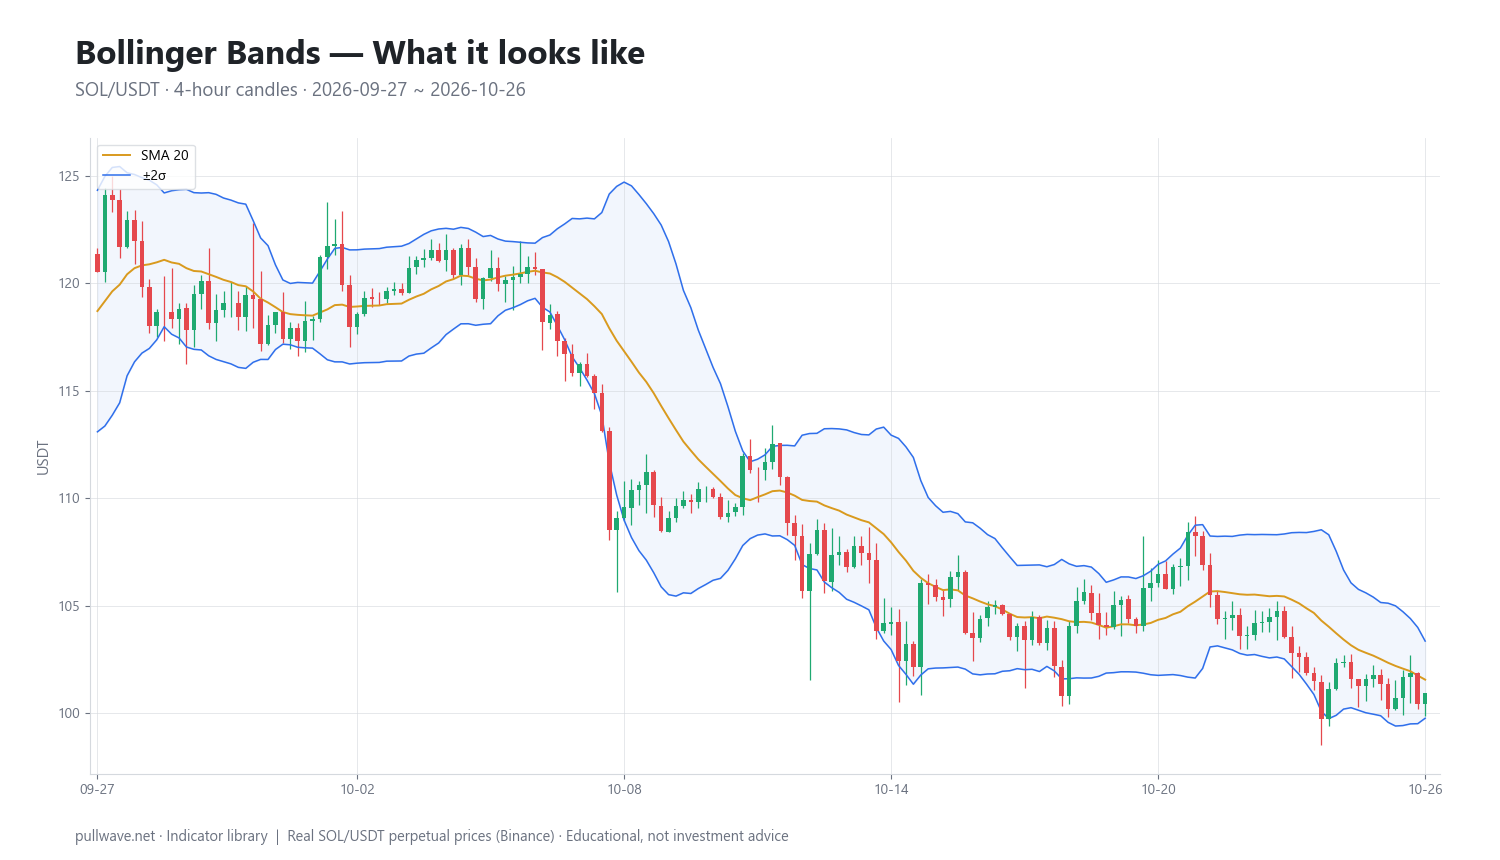
Figure 1 shows the bands drawn on real SOL/USDT 4-hour candles with the standard 20-period, 2-standard-deviation setting. Notice how the envelope narrows during the quiet stretches and flares out around the sharp down-candles: the bands are a picture of volatility, not a prediction.
What is Bollinger Bands?
Bollinger Bands are a three-line indicator plotted directly on the price chart:
- Middle band — a simple moving average of closing price, 20 periods by default.
- Upper band — the middle band plus 2 standard deviations of the same 20 closes.
- Lower band — the middle band minus 2 standard deviations.
The middle band describes trend; the distance between the outer bands describes volatility. Together they form a dynamic range that contains most, but deliberately not all, price action. With the 20/2 default, roughly 85–90% of closes typically fall inside the bands on real market data — in the SOL window used below it was 90.6%.
Two companion readings, both defined by John Bollinger himself, turn the visual into numbers: %b (where price sits inside the bands, 0 = lower band, 1 = upper band) and Bandwidth (band width as a fraction of the middle band). Serious users of the tool spend as much time on those two as on the bands themselves.
The idea behind it (theory and history)
John Bollinger, a market technician who holds both the CFA and CMT designations, developed the bands in the early 1980s. He has said the name was not his own invention — it was coined on air during his time presenting technical analysis on the Financial News Network. He later set out the full framework, including %b, Bandwidth, the Squeeze and his well-known list of rules for using the bands, in Bollinger on Bollinger Bands (McGraw-Hill, 2001).
Trading bands existed before him. Percentage envelopes — a moving average shifted up and down by a fixed percentage — were common, and Chester Keltner described a volatility-based channel in his 1960 book How to Make Money in Commodities. The so-called Bomar Bands of the 1970s tried to adjust width so that a chosen percentage of data stayed inside. The problem with all of them was the width: a fixed 4% envelope is too tight in a panic and far too wide in a dead market.
Bollinger's contribution was to let the data set the width by using standard deviation, a measure that responds to volatility automatically and quickly. The underlying logic is statistical in spirit rather than strictly statistical in fact: price is treated as a distribution around its own mean, and the bands mark the edges of that distribution. Bollinger has been explicit that market returns are not normally distributed, so the textbook "95% within two standard deviations" does not apply — the real containment with 20/2 is closer to 88–89%, and he treats the bands as relative definitions of high and low, not as probability boundaries.
That distinction matters. "High" at the upper band means high compared with the last 20 bars. It does not mean overvalued, and it does not mean a reversal is due.
How it is calculated
Step by step, for a 20-period, 2-standard-deviation setting:
- Take the last 20 closing prices.
- Average them. That is the middle band (a 20-period simple moving average).
- For each of those 20 closes, subtract the average and square the result.
- Average the 20 squared differences, then take the square root. That is the standard deviation of price over the window.
- Add 2 × standard deviation to the middle band to get the upper band.
- Subtract 2 × standard deviation from the middle band to get the lower band.
- Repeat on every new bar, so all three lines move.
``` Middle = SMA(Close, 20)
sigma = sqrt( SUM( (Close_i - Middle)^2 ) / 20 ) i = 1..20 (population)
Upper = Middle + 2 * sigma Lower = Middle - 2 * sigma
%b = (Close - Lower) / (Upper - Lower) Bandwidth = (Upper - Lower) / Middle ```
One technical note that explains small differences between platforms: the divisor in step 4 can be 20 (population standard deviation) or 19 (sample standard deviation). Bollinger specifies the population version, which is what most charting software uses and what the SOL example below uses. The sample version produces very slightly wider bands. It is not a meaningful difference for trading, but it is why two charts can disagree by a few cents.
Default settings and variations
| Setting | Default | Why it exists |
|---|---|---|
| Period | 20 | About one month of daily bars; long enough to be stable, short enough to adapt. Bollinger found it a good general-purpose length. |
| Deviations | 2 | Keeps most closes inside while leaving the tails visible. Pairs sensibly with a 20-period average. |
| Average type | Simple (SMA) | The same average is used in the deviation calculation, so SMA keeps the math internally consistent. |
| Price input | Close | Closes are the most meaningful prices; some traders use typical price (H+L+C)/3. |
Bollinger's own guidance is that period and width should move together. If you shorten the average you should narrow the bands, and if you lengthen it you should widen them — his suggested pairings are roughly 10 periods with 1.9 deviations and 50 periods with 2.1 deviations. The reason is containment: a shorter window produces a less stable mean, so 2 deviations would let too much price action escape.
Common variations in practice:
- Shorter settings (10/1.9) for intraday crypto scalping, where the 20-period average on a 5-minute chart can feel slow.
- Longer settings (50/2.1) for swing context on daily charts.
- Three deviations as an extra outer band to separate "stretched" from "extreme."
- Bandwidth and %b plotted in a sub-panel so squeezes and band position can be measured instead of eyeballed.
Resist the urge to tune the numbers until signals look good on a past chart. Changing 20/2 to something else does not create information; it only changes how often the bands are touched.
How to read it
Read the three lines as three separate pieces of information.
Band width = volatility regime. Narrow bands mean the recent range is compressed. Wide bands mean the market is already moving. Bandwidth falling to a multi-month low is what Bollinger named the Squeeze — a statement that volatility is low, and therefore likely to expand at some point, with no information about direction.
Middle band = trend. Its slope, and whether price is consistently holding above or below it, is the simplest trend read on the chart. In a healthy uptrend, pullbacks tend to stall near the middle band rather than reach the lower one.
Band position = relative price. A close outside a band is not a signal by itself; it says price is at an extreme of its own recent distribution. In strong trends price can "walk the band," printing close after close against the upper band while the trend continues — which is why treating every band tag as a reversal is the most expensive beginner mistake with this tool.
Bollinger also described W-bottoms and M-tops, adapted from Arthur Merrill's pattern work: a second low that is lower in price but higher in %b (it does not reach as deep into the lower band) suggests selling pressure is fading, and the mirror image applies at highs.
How traders use it
1. Mean reversion inside a range. When Bandwidth is moderate and the middle band is flat, closes outside a band often snap back toward the average. Works in sideways, balanced markets with no fresh news. Fails badly in trends, where the band tag is the start of the move rather than its end — and where leverage makes the failure expensive.
2. Squeeze then breakout. Bandwidth contracts to a local extreme, then price closes decisively outside a band and the bands begin to expand. Traders use the expansion as confirmation that a new volatility regime has started. Works when the squeeze is genuine and the breakout is accompanied by volume and range expansion. Fails when the first push out of a squeeze is a liquidity grab that reverses — common in crypto around weekend lulls and funding resets.
3. Trend continuation with the middle band. In an established trend, traders use the middle band as the dynamic area where pullbacks are expected to stall, and band-walking as evidence of strength. Works while the middle band is clearly sloped. Fails when the slope flattens, because the middle band stops acting like support and starts acting like the center of a range.
4. Volatility sizing rather than signal generation. Many experienced users never trade band touches at all. They read Bandwidth to decide position size and stop distance — wider bands mean wider stops and smaller size for the same risk. This is the most regime-robust use of the indicator, and the one most relevant to anyone using perpetual futures with leverage, where a stop set inside normal band width is an invitation to be liquidated by noise.
Example on a real SOL chart
The window below is SOL/USDT perpetual on Binance, 4-hour bars, 2026-09-27 to 2026-10-26, with the standard 20-period SMA and 2 population standard deviations. The last close in the window was 100.91, and 90.6% of closes fell inside the bands — close to the containment Bollinger describes as typical. There were 9 closes outside a band, which we track 6 bars and 18 bars later.
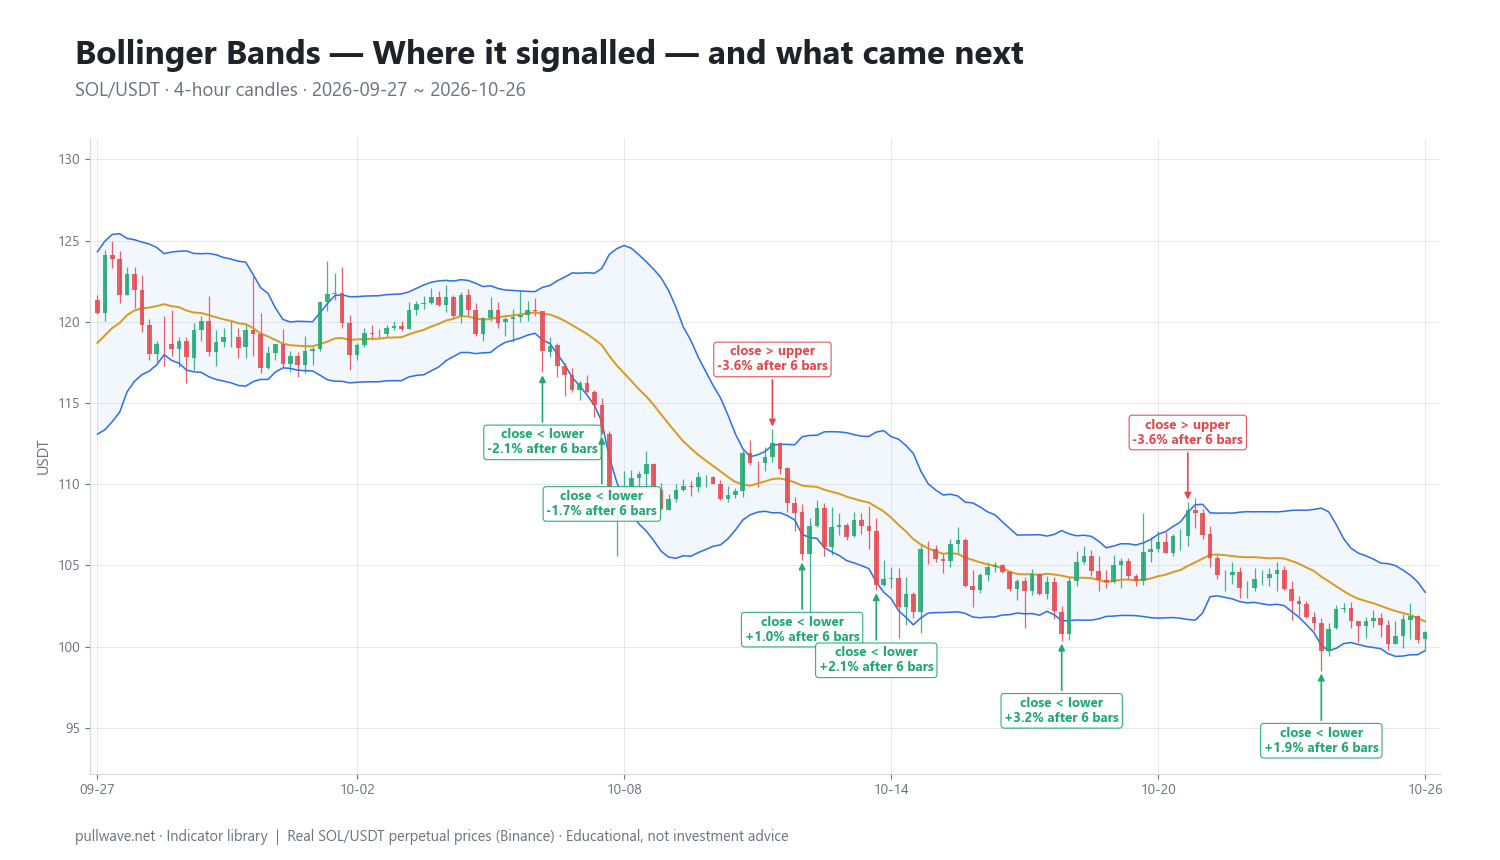
Figure 2 marks each of those nine signals with the subsequent percentage move. Treating each band tag as a mean-reversion hint (upper band → price falls, lower band → price rises), 7 of 9 resolved in the expected direction after 6 bars:
| Date (UTC) | Signal | Price | After 6 bars | After 18 bars |
|---|---|---|---|---|
| 2026-10-02 00:00 | close > upper | 121.22 | -1.56% | -0.69% |
| 2026-10-07 00:00 | close < lower | 118.18 | -2.11% | -7.22% |
| 2026-10-08 08:00 | close < lower | 113.13 | -1.69% | -3.15% |
| 2026-10-12 04:00 | close > upper | 112.54 | -3.58% | -8.28% |
| 2026-10-12 20:00 | close < lower | 105.70 | +1.02% | -0.30% |
| 2026-10-14 12:00 | close < lower | 103.82 | +2.14% | -0.25% |
| 2026-10-18 16:00 | close < lower | 100.78 | +3.19% | +7.41% |
| 2026-10-21 12:00 | close > upper | 108.44 | -3.56% | -8.04% |
| 2026-10-24 12:00 | close < lower | 99.72 | +1.88% | +1.19% |
The honest reading is that results were mixed, and the context explains why. Price fell from 121.22 at the first signal to 100.91 by the end of the window, so this was a downtrend — and six of the nine signals were lower-band tags, which is exactly the asymmetry a falling market produces. Over the longer 18-bar horizon only 5 of 9 still pointed the right way: the three upper-band tags were followed by declines of 0.69%, 8.28% and 8.04%, while several lower-band bounces faded back into further weakness (-7.22% and -3.15% at the 10-07 and 10-08 signals).
That is one indicator, one market, one month of 4-hour bars. It is an illustration of how band tags behave inside a downtrend, not evidence that the tool predicts anything. A different window — especially a ranging one — would produce a different-looking table, and no sample of nine events can support a conclusion either way.
Common mistakes
- Treating a band touch as a reversal signal. Bollinger's own first rule is that tags are relative definitions of high and low, not buy or sell signals. Band-walking in a trend will punish the assumption repeatedly.
- Assuming 95% containment. That figure comes from the normal distribution, which crypto returns do not follow. Real containment is nearer 88–90%, and the tails are fatter than the math implies.
- Over-optimizing the settings. Fitting period and deviations to a past chart produces confidence, not edge.
- Confusing a squeeze with a direction. Low Bandwidth says volatility is compressed. It says nothing about which way the release goes.
- Placing stops just outside the bands on leveraged positions. The bands are where normal volatility reaches. A stop there is inside the noise, and on a perpetual with high leverage that is a liquidation risk, not a risk-management plan.
- Combining the bands with another indicator built from the same price data and calling it confirmation. A 20-period average and a 20-period oscillator largely say the same thing.
Combining it with other tools
Bollinger Bands measure volatility and relative price level. They say nothing about participation or momentum, so the useful partners are tools that measure something genuinely different.
- Volume or open interest answers whether a close outside the band is backed by real participation. A breakout out of a squeeze on falling volume and flat open interest is a weaker proposition than one where both expand.
- Momentum oscillators (RSI, MACD) help with the divergence idea behind M-tops and W-bottoms: a new price high that does not produce a new momentum high while %b falls is a classic non-confirmation.
- Keltner Channels, which use ATR instead of standard deviation, respond differently to volatility; some traders watch for the Bollinger Bands contracting inside the Keltner Channels as a stricter definition of a squeeze.
- Higher-timeframe structure — prior swing highs and lows, or the daily middle band — gives the band tag a location. A lower-band close at a long-standing support area is a different proposition from one in open air.
- ATR for stop placement, since it answers "how far does this market normally travel" in the same spirit as Bandwidth but in price units.
In crypto there is one more consideration: the market trades 24/7, so the 20-period window has no session boundaries. On a 4-hour chart that window is about 3.3 days, which means a single weekend of thin liquidity can compress the bands and a Monday expansion can look like a breakout when it is partly a return to normal volume.
Frequently asked questions
Q. What are the best Bollinger Bands settings for crypto?
The 20-period, 2-standard-deviation default works as well in crypto as anywhere else and is the setting almost everyone else is looking at. If you shorten the average, narrow the bands with it — Bollinger suggests roughly 10/1.9 — and if you lengthen it, widen them, around 50/2.1. Changing the numbers to make past signals look better is optimization, not improvement.
Q. Does price always return to the middle Bollinger Band?
No. Price returns to the middle band often, because the middle band is an average of recent price, but "often" is not "always." In strong trends price can hold against one band for many bars while the middle band rises or falls to meet it, so a position taken on the assumption of a quick snap-back can sit at a loss for a long time.
Q. What does a Bollinger Band squeeze mean?
A squeeze is a period when Bandwidth — the band width divided by the middle band — falls to a low level relative to its own history, meaning recent volatility has compressed. Because volatility tends to cycle rather than stay flat, a squeeze suggests an expansion is coming at some point. It gives no information about direction, and the first move out of a squeeze can reverse.
Q. Are Bollinger Bands a leading or lagging indicator?
The middle band is a moving average, so it lags price by construction. Bandwidth is better described as a condition indicator: it tells you what regime you are in now, which is why it is more useful for sizing and expectation-setting than for timing entries.
Q. What is the difference between Bollinger Bands and Keltner Channels?
Both are volatility envelopes around a moving average, but Bollinger Bands use the standard deviation of closing prices while Keltner Channels use Average True Range, which includes highs and lows. Standard deviation reacts faster to sharp moves, so Bollinger Bands expand and contract more dramatically. Keltner Channels tend to be smoother, which is why some traders use the two together.
Q. Can you trade using Bollinger Bands alone?
You can plot them alone, but using band touches as standalone entry triggers ignores the regime question that determines whether reversion or continuation is the right expectation. In practice the bands are most reliable as context — trend from the middle band, volatility from the width — combined with independent evidence such as volume, market structure or momentum.
Key takeaways
- Bollinger Bands are a 20-period moving average with bands placed 2 standard deviations above and below it, developed by John Bollinger in the early 1980s and documented in Bollinger on Bollinger Bands (2001).
- Band width is a volatility reading, and band position is a relative price reading — a close outside a band means "high or low compared with the last 20 bars," not "reversal."
- The usual 95% containment claim is wrong for markets; real-world containment with 20/2 is closer to 88–90%, and it was 90.6% in the SOL/USDT 4-hour window examined above.
- In that window, 7 of 9 band tags moved in the mean-reversion direction after 6 bars but only 5 of 9 after 18 bars, inside an overall downtrend — a reminder that one sample on one market proves nothing about the tool.
- The most regime-robust uses are reading the middle band for trend and Bandwidth for position sizing and stop distance, especially on leveraged perpetual futures where stops placed inside normal band width risk liquidation on noise.
Educational material. Charts use real SOL/USDT perpetual prices; past behaviour does not predict future results. Not investment advice.