Indicator & technique library · Indicator library
Stochastic Oscillator Explained: Formula, Settings, Uses
At a glance
- The Stochastic Oscillator measures where the current close sits inside the high–low range of the last N bars, on a 0–100 scale.
- It was developed in the 1950s by the Investment Educators group in Chicago and popularized by George C. Lane.
- Default 14·3·3 settings give a %K line and its 3-period average %D; readings above 80 and below 20 mark the top and bottom of the recent range.
- It is a range-and-rotation tool: in strong trends it stays pinned at an extreme, so a trend filter matters more than the signal itself.
The Stochastic Oscillator answers one narrow question: where did price close relative to its own high–low range over the last N bars? If the last close is at the very top of a two-week range, the oscillator reads near 100. If it closed at the bottom of that range, it reads near 0. Everything else — crossovers, overbought zones, divergence — is interpretation built on that single measurement.
Traders care about it because it is fast and bounded. Unlike price, which can run forever, the Stochastic always lives between 0 and 100, which makes it easy to compare swings, spot loss of momentum inside a range, and time entries at the edges of consolidation. That same boundedness is its biggest trap: in a strong trend it can sit "overbought" for days while price keeps climbing.
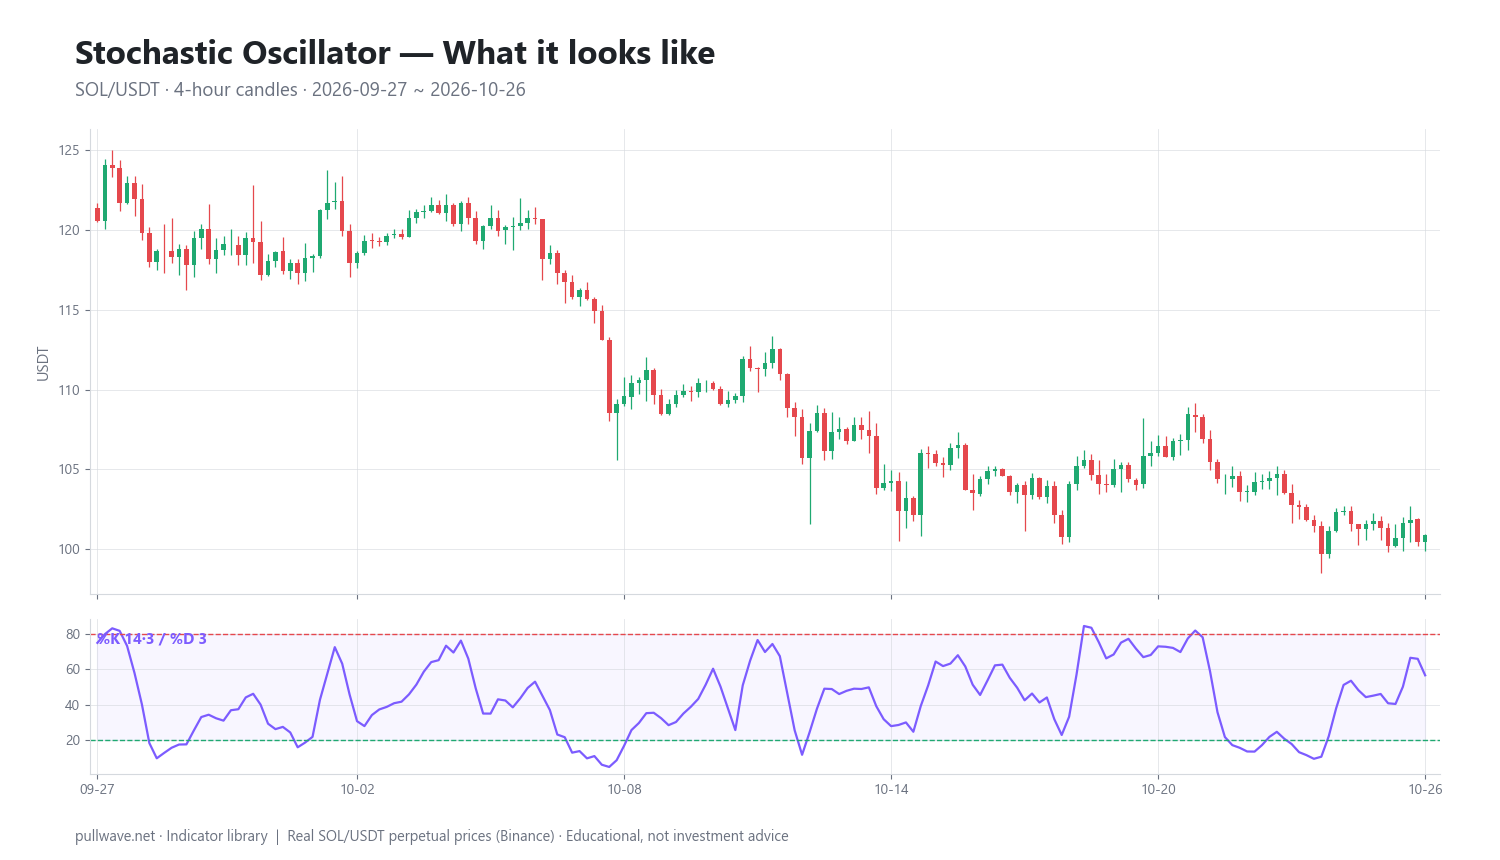
Figure 1 shows the indicator plotted under real SOL/USDT 4-hour candles: the faster %K line, the slower %D average, and the 80/20 reference lines that frame the top and bottom of the recent range.
What is the Stochastic Oscillator?
The Stochastic Oscillator is a momentum indicator that normalizes the current close into a percentage of the recent trading range. It plots two lines: %K, the raw (or lightly smoothed) position of the close within that range, and %D, a short moving average of %K that acts as a signal line.
The name has nothing to do with stochastic processes in mathematics. It is simply the label the original developers used for one of a series of formulas they were testing. What the indicator actually computes is a position statistic, not a probability model.
Because it is bounded between 0 and 100, the Stochastic is most often read through three lenses: the level (above 80, below 20, or in the middle), the slope (rising or falling), and the relationship between %K and %D (crossovers). A fourth lens, divergence against price, is popular but needs more care.
The idea behind it (theory and history)
The indicator came out of Investment Educators in Chicago in the late 1950s, a group that tested a long series of formulas labeled with letters — %A, %B, and so on through %R. Only two survived into common use: %K and %D. George C. Lane became the public face of the method, teaching and writing about it for decades, and he is the name most often attached to it today. Lane himself described it as a group effort rather than a solo invention, and credit is sometimes also given to the firm's head, Ralph Dystant; the precise authorship is not settled, so it is fair to say Lane popularized rather than single-handedly created it.
The underlying observation is simple and still holds up. When a market is rising with conviction, buyers keep lifting offers into the close, so closes tend to cluster near the top of each bar's and each period's range. When a market is falling, closes cluster near the lows. A loss of that tendency — price making a new high but closing in the middle or lower part of the range — suggests the push is weakening.
Lane's teaching framed the indicator as a momentum measure rather than a price measure, using the analogy of a rocket that must decelerate before it can fall. That framing is useful but also where most misuse begins: deceleration can last a long time, and in trending markets momentum can reset without price ever reversing.
How it is calculated
Step by step, for a lookback of N bars:
- Find the highest high of the last N bars (including the current bar).
- Find the lowest low of the last N bars.
- Subtract the lowest low from the current close. This is how far above the range bottom price has closed.
- Divide by the full range (highest high minus lowest low) and multiply by 100. That is raw %K, also called Fast %K.
- Smooth raw %K with a short moving average (default 3 periods). This smoothed line is what most platforms plot as %K in the "slow" version.
- Take a 3-period moving average of that smoothed %K. That is %D, the signal line.
``` Raw %K = 100 * (Close - LowestLow(N)) / (HighestHigh(N) - LowestLow(N))
%K (slow) = SMA(Raw %K, smoothK) # default smoothK = 3 %D = SMA(%K, smoothD) # default smoothD = 3
Settings written as N · smoothK · smoothD, e.g. 14 · 3 · 3 ```
Two practical notes. If the highest high equals the lowest low — a perfectly flat N-bar window, rare but possible on illiquid pairs or very low timeframes — the denominator is zero and most platforms carry forward the previous value or print 50. And because the formula uses highs and lows, a single long wick redefines the range for the next N bars, which matters a great deal in crypto.
Default settings and variations
The classic lookback is 14. It traces back to the era of daily charts, where 14 sessions covered roughly two to three trading weeks — long enough to contain a full short-term swing, short enough to react. It is the same number Welles Wilder chose for RSI, and it survived mostly because it was the published default, not because 14 is optimal.
The 3-period smoothing on %K exists to kill the jitter of raw %K, which can swing from 5 to 95 in a single bar. The 3-period %D exists to give a slower reference line so crossovers are possible at all.
| Preset | N · smoothK · smoothD | Character | Typical use |
|---|---|---|---|
| Fast | 14 · 1 · 3 | Very noisy, many crosses | Rarely used alone today |
| Slow (classic) | 14 · 3 · 3 | Balanced, the common default | Swing and intraday context |
| Full / slower | 21 · 7 · 7 or 14 · 5 · 5 | Fewer, later signals | Trend-following filters, higher timeframes |
| Short | 5 · 3 · 3 or 9 · 3 · 3 | Fast, scalping-oriented | Range scalps, needs a trend filter |
"Full Stochastic" on most charting platforms simply means all three parameters are user-editable. The example in this page uses %K 14·3 with a %D of 3 — the standard slow configuration.
For crypto, the lookback interacts with the 24/7 clock. On a 4-hour chart, 14 bars is about 2.3 days; on a daily chart it is two full weeks including weekends, which behave differently from weekdays in volume terms. Shorter lookbacks on 1-minute and 5-minute charts produce almost continuous extremes and are mostly noise.
How to read it
Start with the level. Above 80 means the close sits in the top fifth of the N-bar range; below 20 means the bottom fifth. These are descriptions of position, not instructions. A market can close in the top fifth of its range for twenty bars in a row — that is what a trend looks like through this lens.
Then read the slope and the crossover. %K crossing above %D means short-term closes are strengthening relative to the recent range; crossing below means the opposite. Crossovers that happen near the extremes carry more information than crossovers in the 40–60 zone, where the oscillator is just wandering.
Finally, read the shape over time. A series of lower peaks in %K while price makes higher highs is bearish divergence; higher troughs while price makes lower lows is bullish divergence. Divergence is a statement about the quality of a move, not its timing, and it can persist through several more price extensions.
How traders use it
1. Range rotation. Inside a well-defined sideways range, fade %K extremes that line up with the range boundary — below 20 at support, above 80 at resistance. Works when the range has already produced at least two clean touches on each side and volatility is contracting. Fails when the range breaks; the first failed fade in a breakout is usually the most expensive trade of the cycle.
2. Pullback timing inside a trend. Use a higher-timeframe trend filter, then take only the oscillator extremes that point back in the direction of that trend — oversold readings in an uptrend, overbought readings in a downtrend. Works when the trend is intact and pullbacks are orderly. Fails when the trend is ending; the last pullback signal before a reversal looks identical to all the profitable ones.
3. Crossovers as a momentum filter rather than a trigger. Instead of entering on the cross, require %K to cross %D and a price-based condition — a break of the pullback high, a reclaim of a moving average, a prior swing level. This cuts the signal count sharply. Works when you accept fewer entries. Fails when the extra condition arrives so late that the move is already mature.
4. Divergence as a warning, not an entry. Track %K peaks against price peaks to flag deteriorating momentum, then wait for structure to confirm — a lower high, a broken trendline. Works when used to reduce exposure or tighten risk. Fails when traded directly against a strong trend; in crypto bull phases, bearish divergence can print three or four times before anything happens.
Example on a real SOL chart
The window below is SOL/USDT perpetual on Binance, 4-hour candles, from 2026-09-27 to 2026-10-26, with settings %K 14·3 / %D 3. Over this stretch price moved from 124.09 down to a last close of 100.91, so the backdrop was a decline, not a range. The oscillator spent 18.3% of the bars at an extreme (above 80 or below 20), and its final reading was 56.63 — mid-range, telling you nothing directional on its own.
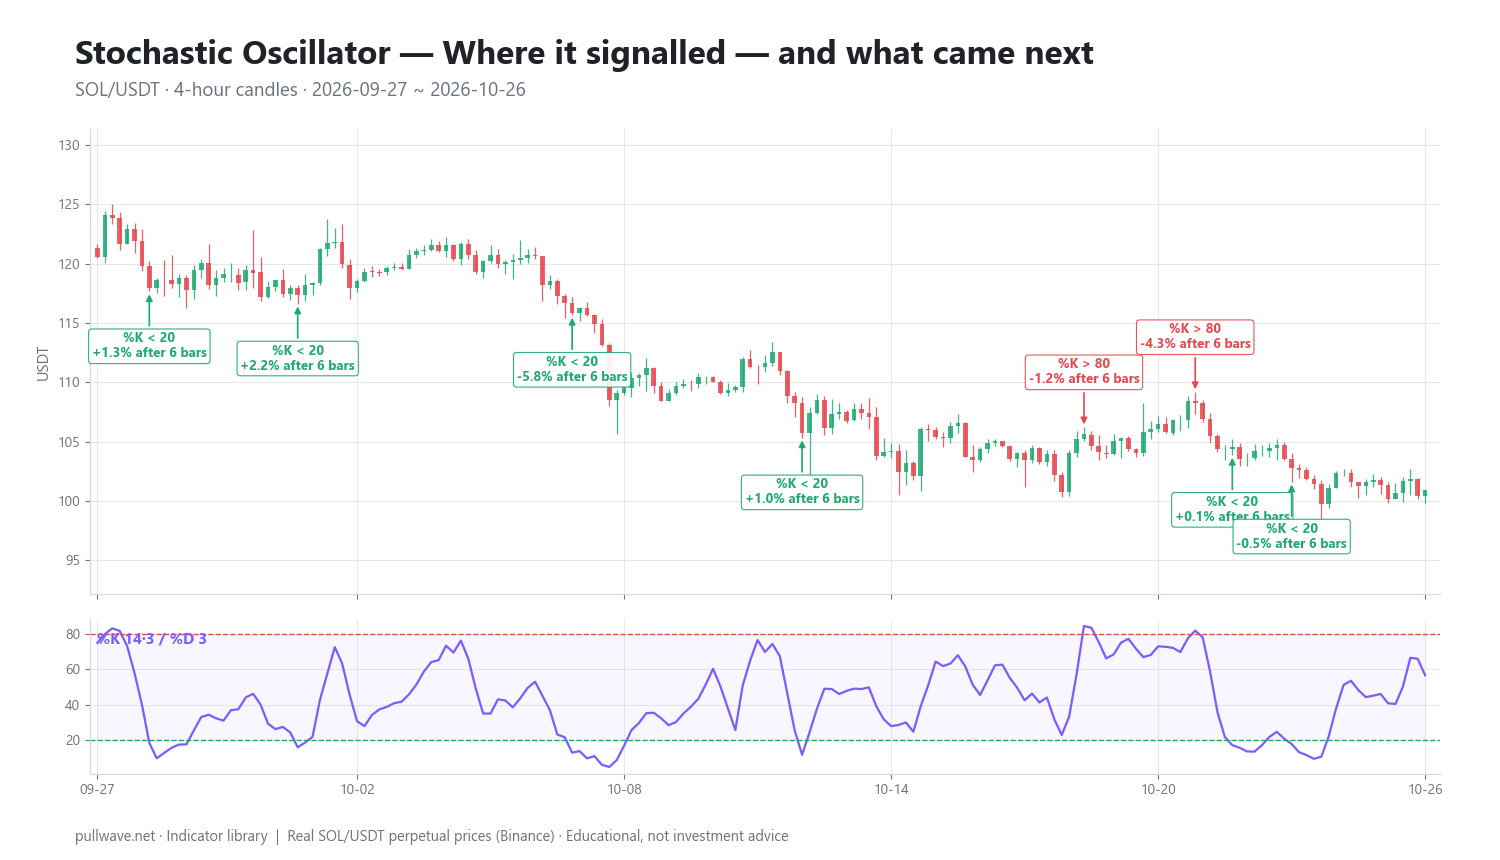
Figure 2 marks all 9 extreme events in the window and the percentage move after 6 bars (one day) and after 18 bars (three days).
| Date (UTC) | Signal | Price | After 6 bars | After 18 bars |
|---|---|---|---|---|
| 2026-09-27 04:00 | %K > 80 | 124.09 | -4.92% | -4.58% |
| 2026-09-28 04:00 | %K < 20 | 117.99 | +1.26% | -0.48% |
| 2026-10-01 12:00 | %K < 20 | 117.32 | +2.22% | +3.59% |
| 2026-10-07 16:00 | %K < 20 | 115.81 | -5.81% | -4.65% |
| 2026-10-12 20:00 | %K < 20 | 105.70 | +1.02% | -0.30% |
| 2026-10-19 04:00 | %K > 80 | 105.61 | -1.17% | -1.16% |
| 2026-10-21 16:00 | %K > 80 | 108.25 | -4.31% | -6.60% |
| 2026-10-22 12:00 | %K < 20 | 104.58 | +0.14% | -2.86% |
| 2026-10-23 20:00 | %K < 20 | 102.79 | -0.45% | -1.83% |
Counting mean-reversion direction — down after an overbought reading, up after an oversold one — 7 of the 9 events moved the "expected" way after 6 bars. That sounds encouraging until you look at the size and the horizon. The three overbought readings were followed by declines of -4.92%, -1.17% and -4.31%, while the oversold bounces were +1.26%, +2.22%, +1.02% and +0.14% — the winners on the short side were several times larger than the bounces on the long side.
Extend to 18 bars and the picture changes again: only 4 of the 9 events were still moving in the mean-reversion direction. Every oversold signal except 2026-10-01 had faded or reversed by then, with 2026-10-07 at -4.65% and 2026-10-22 at -2.86%. The overbought readings, which pointed in the direction of the prevailing downtrend, held up better.
That asymmetry is the lesson, and it is the whole point of using a trend filter. In a market drifting from 124 to 101, extremes aligned with the trend persisted and extremes against it decayed. This is one indicator, one market, one month, and 9 observations — far too small a sample to conclude anything about the tool's general reliability. A different month, or a ranging month, would very plausibly have inverted these results.
Common mistakes
- Treating 80 and 20 as buy and sell lines. They are range-position thresholds. In a strong trend the oscillator parks at one end, and each fade attempt is a trade against the dominant flow.
- Running it without any trend context. The same signal has opposite expected behavior depending on whether price is trending or rotating. Decide the regime first.
- Over-fast settings on low timeframes. 5·3·3 on a 1-minute crypto chart produces dozens of crosses per hour. More signals is not more information.
- Letting liquidation wicks define the range. A single violent wick sets a new N-bar high or low and compresses the oscillator for the next N bars. Check whether the range is real or wick-driven.
- Trading divergence in isolation. Divergence describes weakening momentum; it does not say when, or whether, price will turn.
- Stacking redundant oscillators. Stochastic, RSI and CCI all measure closely related things. Three agreeing oscillators is one opinion repeated, not confirmation.
- Ignoring leverage math. On perpetuals, a bounded oscillator invites frequent entries; frequent entries at high leverage compound fees, funding and liquidation risk regardless of signal quality.
Combining it with other tools
The most valuable companion is a trend definition: a long moving average, higher-timeframe market structure, or simply the slope of the 4-hour and daily swing highs and lows. Use it to decide which half of the oscillator's signals you are even willing to consider.
Price levels come second. An oversold reading at a well-tested support shelf or a prior consolidation edge is a different proposition from an oversold reading in the middle of empty space. The level provides the invalidation point; the oscillator only provides the timing nudge.
Volatility tools help size the risk. ATR tells you how wide a stop has to be to survive normal noise on the timeframe you are trading — important in crypto, where a 4-hour candle can cover 5% without anything unusual happening. Volume or open-interest context can flag whether a move at an extreme is real participation or thin-book drift.
Finally, pair it with something that measures a different dimension. A trend-strength reading such as ADX, or a volume-based measure, adds information that another momentum oscillator cannot.
Frequently asked questions
Q. What is the best Stochastic setting for crypto?
There is no universally best setting, but 14·3·3 remains the sensible starting point on 1-hour, 4-hour and daily crypto charts because it is slow enough to filter wick noise. Traders who want fewer, later signals often move to 21·7·7; scalpers sometimes use 9·3·3 or 5·3·3, which require a strict trend filter to be usable. Change one parameter at a time and judge it over many market regimes, not over one trending month.
Q. What is the difference between Stochastic and RSI?
RSI measures the average size of up closes versus down closes over the lookback, while the Stochastic measures where the current close sits inside the high–low range. In practice the Stochastic reaches its extremes far more often and reacts faster, which makes it better suited to range rotation and RSI better suited to measuring the strength of a trend. They frequently disagree, and that disagreement is more informative than running both as confirmation of each other.
Q. What do %K and %D actually mean?
%K is the position of the close within the N-bar range, expressed from 0 to 100, usually after a short 3-period smoothing. %D is a 3-period moving average of %K and serves as the slower signal line. Crossovers between the two are the standard way of reading short-term momentum shifts in the indicator.
Q. Does overbought mean I should sell?
No. Overbought only means the close is in the top fifth of the recent range, which is exactly what you would expect during a healthy uptrend. In strong trends the Stochastic can hold above 80 for many consecutive bars, so the reading is better used as context — and as a reason to manage risk — than as a standalone reversal signal.
Q. What is the difference between fast, slow and full Stochastic?
Fast Stochastic plots raw %K with a 3-period %D and is very noisy. Slow Stochastic applies a 3-period smoothing to %K before averaging it again for %D, which is the classic 14·3·3 configuration. Full Stochastic is the same calculation with all three parameters exposed for editing, so fast and slow are just specific cases of it.
Q. Does the Stochastic Oscillator work on 24/7 crypto markets?
The calculation works identically because it only needs highs, lows and closes. What changes is interpretation: there is no session close, weekends have different liquidity, and liquidation cascades create wicks that redefine the N-bar range and distort readings for the following N bars. Checking the same setting on a higher timeframe helps separate genuine range extremes from wick artifacts.
Key takeaways
- The Stochastic Oscillator expresses the current close as a percentage of the last N bars' high–low range; %K is that value smoothed, %D is its 3-period average.
- It emerged from the Investment Educators group in Chicago in the late 1950s and was popularized by George C. Lane; the 14·3·3 default is convention, not an optimum.
- Readings above 80 and below 20 describe position within a range, not trade signals — in trends the indicator stays pinned at an extreme.
- In the SOL/USDT 4-hour window shown, 7 of 9 extremes moved in the mean-reversion direction after 6 bars but only 4 of 9 after 18 bars, with signals aligned to the prevailing downtrend holding up far better. One month, one market — not evidence of reliability.
- Pair it with a trend definition, real price levels and a volatility-based risk framework; avoid stacking it with other momentum oscillators that measure the same thing.
Educational material. Charts use real SOL/USDT perpetual prices; past behaviour does not predict future results. Not investment advice.