Indicator & technique library · Indicator library
MACD Indicator Explained: Formula, Settings and Uses
At a glance
- MACD is the difference between a 12-period and a 26-period EMA, smoothed by a 9-period signal line and plotted as a histogram.
- Gerald Appel developed it in the late 1970s; Thomas Aspray added the histogram in 1986 to make crossovers visible earlier.
- It is a lagging, trend-following momentum tool: strong in sustained trends, prone to repeated whipsaws in sideways markets.
- In the SOL/USDT 4h sample window below, 13 crossovers fired in about a month and only 3 of 13 moved in the signal's direction after 6 bars.
MACD — Moving Average Convergence Divergence — measures the distance between two exponential moving averages of price. When that distance grows, momentum is building; when it shrinks, momentum is fading. It is one of the few indicators that sits comfortably between trend-following and oscillator logic, which is why it appears on so many charts.
Traders care about MACD because it compresses two questions into one picture: which way is the trend leaning and is that lean accelerating or decaying. It is not a timing device on its own, and in choppy crypto markets it produces a lot of noise. Understanding exactly what it computes is the difference between using it well and chasing every crossover.
What is MACD?
MACD is a momentum indicator built from moving averages. It plots three things in a panel below price:
- The MACD line — a fast exponential moving average (EMA) minus a slow one, by default EMA(12) − EMA(26) of closing prices.
- The signal line — a 9-period EMA of the MACD line, used as a smoothed reference.
- The histogram — the MACD line minus the signal line, drawn as bars around zero.
Because the MACD line is a difference between two averages, it oscillates around a zero line. Above zero means the fast EMA is above the slow EMA (recent prices are stronger than the longer average); below zero means the opposite. Unlike RSI or Stochastics, MACD has no fixed upper or lower bound — in a violent crypto trend it can reach values it has never reached before.
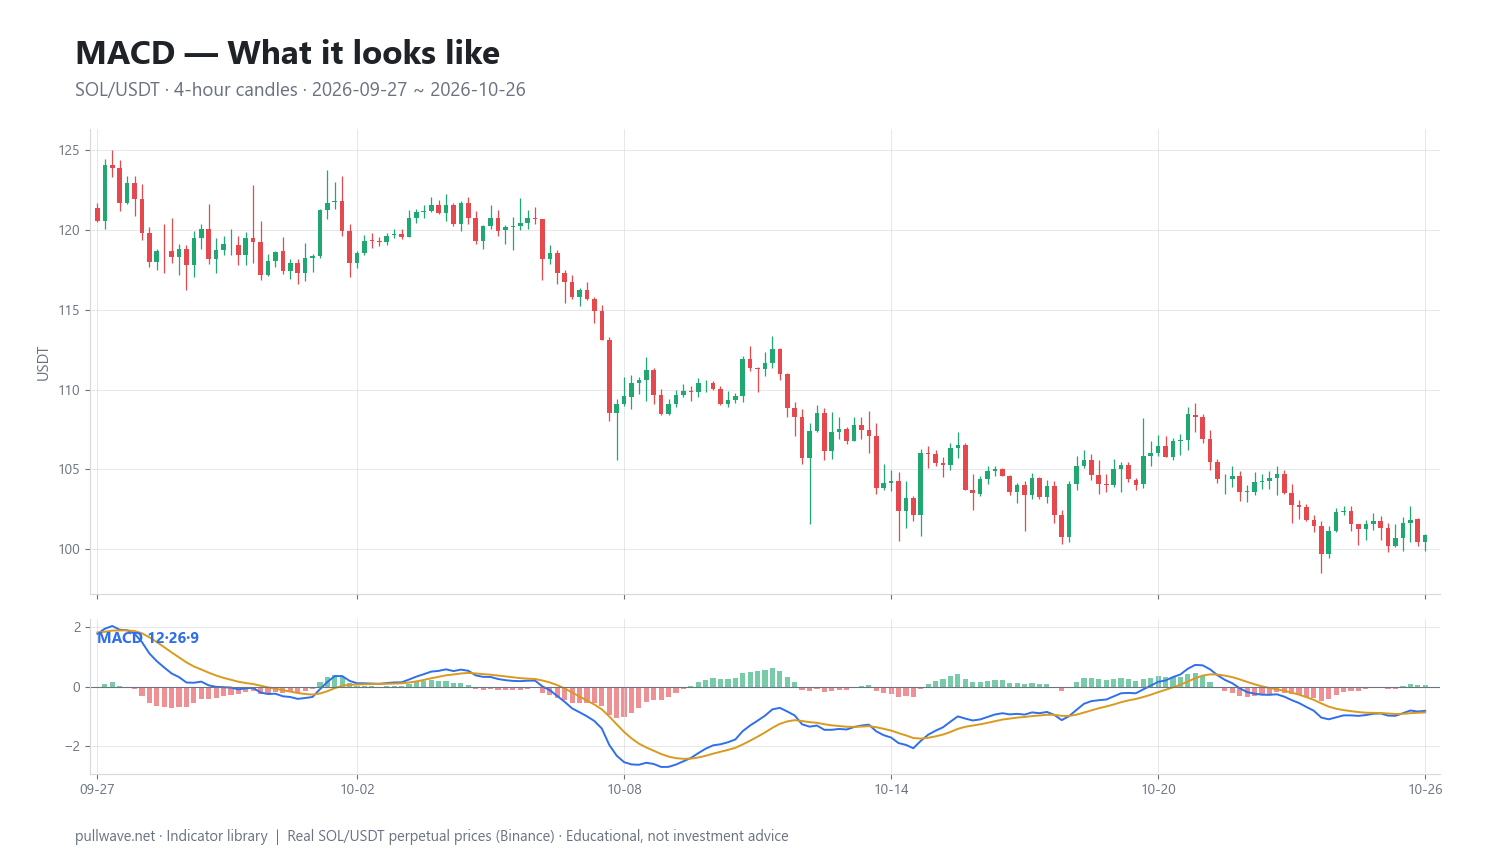
Figure 1 shows the standard 12/26/9 MACD drawn under real SOL/USDT 4-hour candles. Notice how the MACD line and signal line weave around each other and around zero, and how the histogram bars expand when the two lines separate and shrink to nothing right before each crossover.
The idea behind it (theory and history)
MACD was developed by Gerald Appel in the late 1970s, and he popularized it through his newsletters and later writings on technical analysis. The design problem he was solving was practical: a simple moving-average crossover system tells you the trend has changed only after a visible lag, and plotting two averages on price makes the rate of change hard to see.
Appel's trick was to subtract one average from the other and plot the result separately. The distance between a fast and a slow EMA is a direct read on momentum — when the fast average pulls away, buyers (or sellers) are pressing; when it drifts back toward the slow one, pressure is easing. The term "convergence divergence" describes exactly that: the two averages converging toward each other or diverging apart.
The histogram came later. It is generally credited to Thomas Aspray, who presented it in Technical Analysis of Stocks & Commodities in 1986 as a way to anticipate MACD crossovers rather than wait for them. Since the histogram is the gap between MACD and signal, it crosses zero at the exact moment the lines cross — but it starts shrinking well before, which gives an earlier, noisier warning.
The theory is deliberately simple: price trends persist more often than chance would suggest, and momentum usually deteriorates before a trend reverses. MACD is a lens on that deterioration. It makes no claim about why price moves and has no predictive model behind it.
How it is calculated
Step by step, on closing prices:
- Compute a 12-period EMA of the close. An EMA weights recent prices more heavily; the weight applied to the newest close is
k = 2 / (n + 1), so for n = 12 that is about 0.1538. - Compute a 26-period EMA of the close, with k ≈ 0.0741.
- Subtract: MACD line = EMA(12) − EMA(26). This value is in price units — on a $100 coin a MACD of −0.8 means the fast EMA sits about 80 cents below the slow one.
- Compute a 9-period EMA of the MACD line itself (not of price). That is the signal line.
- Subtract again: histogram = MACD − signal.
``` k(n) = 2 / (n + 1) EMA(n)t = Close_t * k(n) + EMA(n){t-1} * (1 - k(n))
MACD = EMA(12) - EMA(26) Signal = EMA(9) applied to the MACD series Histogram = MACD - Signal ```
Two practical notes. First, EMAs need a seed value; most platforms start with a simple moving average and then iterate, so the first 30–40 bars of any MACD series are slightly unreliable. Second, because MACD is measured in price units, values are not comparable across assets or across large price changes in the same asset. A MACD of 2.0 means something very different for SOL at $100 than for BTC at $100,000. The PPO (Percentage Price Oscillator) solves this by dividing the difference by the slow EMA and expressing it as a percentage.
Default settings and variations
The classic parameters are 12, 26, 9. These date from an era when US markets traded six days a week: 12 bars was roughly two weeks, 26 roughly a month, and 9 about a week and a half. That rationale no longer matches any modern calendar, and it certainly does not match a 24/7 crypto market. They survive because they are conventional, not because they are optimal — which also means a lot of traders are watching the same lines.
| Setting | Fast / Slow / Signal | Character |
|---|---|---|
| Classic | 12 / 26 / 9 | Default everywhere; balanced lag |
| Faster | 8 / 17 / 9 or 5 / 13 / 5 | More crossovers, earlier, far more noise |
| Slower | 19 / 39 / 9 or 24 / 52 / 9 | Fewer signals, better for position holding |
| Appel's asymmetric pair | different inputs for buy vs sell | Appel himself argued the up and down sides need not be symmetric |
| PPO | 12 / 26 / 9 as a % | Comparable across assets and price levels |
The honest guidance: changing settings does not remove the trade-off, it only moves you along it. Faster parameters shorten lag and multiply false signals; slower ones do the reverse. If you shorten the inputs, expect to filter harder elsewhere. Also decide once whether you read the indicator on closed bars only — in crypto, a MACD cross that exists mid-candle can vanish before the candle closes.
How to read it
There are four readings, and they answer different questions.
- Position relative to zero. MACD above zero = fast EMA above slow EMA = the medium-term bias on that timeframe is up. Below zero = down. This is the slowest, most stable piece of information in the whole indicator.
- MACD vs signal line. A cross above the signal says short-term momentum is improving relative to its own recent average; a cross below says it is deteriorating. This is the fastest and noisiest piece.
- Histogram shape. Rising bars mean the lines are separating (momentum expanding); shrinking bars mean they are converging (momentum fading), regardless of which side of zero price is on.
- Divergence. Price makes a higher high while MACD makes a lower high — the new high was achieved with less momentum. The reverse at lows is bullish divergence. Divergence is a condition, not a trigger.
A useful habit is to read the two slow elements first (zero line, histogram trend) and only then look at crossovers. Reading crossovers first is how traders end up trading noise.
How traders use it
1. Signal-line crossovers as a momentum trigger. The most common use. It works best when it happens in the direction of an established trend — a bullish cross while MACD is already above zero and price is above a long moving average. It fails badly in ranges, where the MACD line oscillates tightly around the signal and produces cluster after cluster of crossovers within a few days.
2. Zero-line crosses as a regime filter. Rather than trading the cross, many traders use MACD's side of zero to decide which direction they are allowed to look for setups. This is slower and produces far fewer signals, which is the point. It fails at the start of a new trend, when MACD crosses zero only after a sizeable move has already occurred, and in slow drifting markets where it flips repeatedly.
3. Histogram contraction as an early warning. When a strong trend is running and the histogram bars start shrinking for several bars in a row, momentum is decaying even though price may still be making new highs. Traders use this to tighten stops or scale out rather than to reverse. It fails as a reversal signal — momentum often decays for a long time inside a continuing trend, especially on lower timeframes.
4. Divergence as context for exhaustion. Bearish divergence into a resistance level, or bullish divergence into a prior support zone, gives a reason to expect the move to stall. It works best on higher timeframes (4h and above) and near structural levels. It fails spectacularly in parabolic crypto moves, where divergence can persist through several further legs up — "divergence" is not a short signal by itself.
For perpetual futures traders, the regime point is especially important. MACD's crossover frequency rises sharply when volatility compresses, and funding-driven chop can generate a dense cluster of signals. With leverage, a string of small adverse moves between crossovers is more dangerous than the indicator's hit rate suggests.
Example on a real SOL chart
The window below is SOL/USDT perpetual, 4-hour candles, 27 September 2026 to 26 October 2026, with standard settings EMA 12, EMA 26, signal EMA 9. At the final close of the window, price was 100.91, the MACD line was −0.811 and the signal line −0.865 — both below zero, with MACD marginally above its signal.
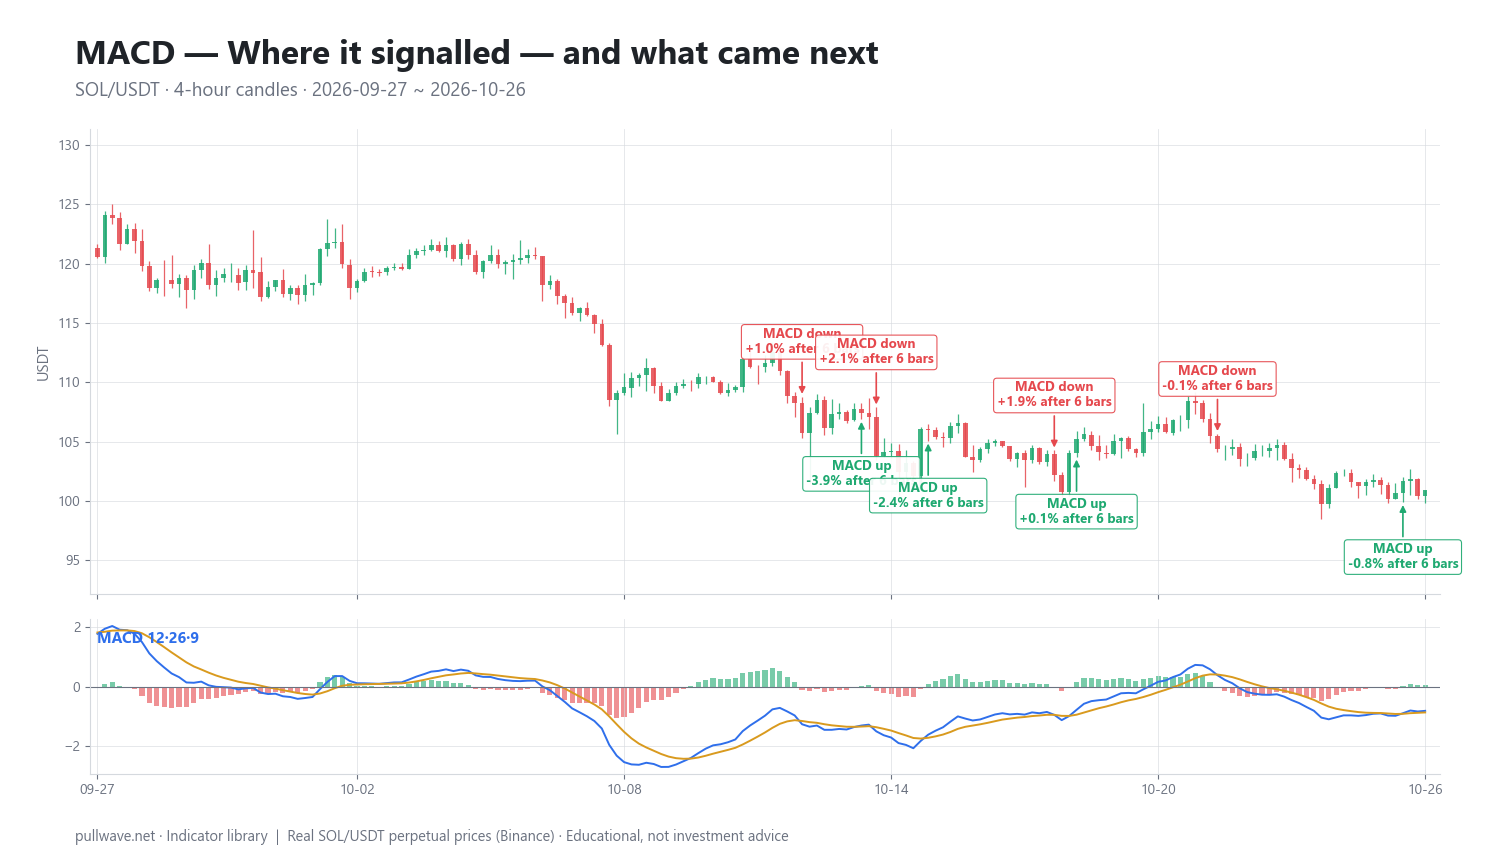
Figure 2 marks each MACD/signal crossover in the window and the percentage move in price 6 bars (one day) and 18 bars (three days) later. The window produced 13 crossovers in about a month — roughly one every two and a half days, which is the first thing worth noticing. A selection:
| Date (UTC) | Signal | Price | After 6 bars | After 18 bars |
|---|---|---|---|---|
| 2026-10-05 12:00 | MACD down | 119.28 | +0.97% | −9.04% |
| 2026-10-10 08:00 | MACD up | 109.83 | −0.24% | −3.37% |
| 2026-10-12 20:00 | MACD down | 105.70 | +1.02% | −0.30% |
| 2026-10-14 04:00 | MACD up | 107.44 | −3.93% | −2.23% |
| 2026-10-14 12:00 | MACD down | 103.82 | +2.14% | −0.25% |
| 2026-10-15 16:00 | MACD up | 105.98 | −2.35% | −4.91% |
| 2026-10-18 12:00 | MACD down | 102.17 | +1.88% | +6.14% |
| 2026-10-19 00:00 | MACD up | 105.22 | +0.06% | +0.24% |
| 2026-10-22 04:00 | MACD down | 104.38 | −0.12% | −2.67% |
| 2026-10-26 08:00 | MACD up | 101.67 | −0.75% | −0.75% |
Counting across all 13 crossovers, price moved in the direction of the signal after 6 bars in only 3 of 13 cases. That is a poor short-horizon record, and the pattern behind it is visible in the table: bearish crosses were repeatedly followed by small bounces (+0.97%, +1.02%, +2.14%, +1.88%), and bullish crosses by small drops (−0.24%, −3.93%, −2.35%). This is textbook whipsaw behavior — the market was chopping inside a downward drift, and the crossover kept firing at local extremes of the chop.
The 18-bar column tells a different story in places. The 5 October bearish cross at 119.28 was followed by −9.04% three days later, and the 15 October bullish cross was followed by −4.91%. In other words, the signals that aligned with the dominant direction of the window — down, from 119.28 to 100.91 — eventually paid, while counter-trend signals did not. The 18 October bearish cross is the clear exception: +6.14% after three days, against the signal.
Treat this as one illustration on one market over one month, not as evidence about MACD in general. A month of 4-hour data in a drifting, range-bound regime is exactly the environment MACD handles worst, and a trending month would likely produce the opposite-looking table. Note also that the last entry, 26 October, is at the edge of the window, so its 6-bar and 18-bar figures are the same number. The useful lesson is structural: 13 crossovers in a month on a 4h chart is a signal frequency that no realistic fee and slippage budget absorbs comfortably.
Common mistakes
- Trading every crossover. The crossover is the noisiest output of the indicator. Without a trend filter or a level to trade against, its frequency alone will grind an account down through fees and spread — especially on perpetuals.
- Treating MACD as overbought/oversold. It is unbounded. A high MACD value means a strong trend, not an imminent reversal. Only RSI-style oscillators have meaningful fixed extremes.
- Comparing MACD values across time or assets. Because it is denominated in price units, the same asset at $20 and at $200 produces completely different MACD scales. Use PPO if you need comparability.
- Acting on unclosed candles. In 24/7 crypto markets there is no closing bell, so an intrabar cross can reverse before the bar finishes. Pick a bar-close rule and apply it consistently.
- Forcing divergence. On a volatile chart you can almost always find two highs and two MACD peaks that "diverge" if you choose the points freely. Define the swing points before you look at the indicator.
- Over-optimizing parameters. Tuning 12/26/9 to the best-performing numbers on a past sample usually produces a setting that fits that sample's noise, not a durable edge.
Combining it with other tools
MACD answers "is momentum expanding or contracting?" It does not know where price is, how volatile the market is, or whether the structure is trending. Pairing it with tools that answer those questions is what makes it workable.
- A long-term moving average (e.g. 200-period) as a regime filter: only take bullish MACD signals above it, bearish signals below. In the SOL window above, this kind of filter would have discarded most of the counter-trend crosses.
- ADX or a volatility measure to detect ranges. MACD's weakness is chop; ADX below its typical threshold, or a strongly contracted Bollinger Band width, is a warning that crossovers are about to multiply.
- RSI for a second, bounded momentum read. MACD gives direction and acceleration; RSI gives relative position. Divergences confirmed by both are rarer and generally more meaningful than either alone.
- Horizontal support and resistance, or higher-timeframe structure. A bearish MACD cross into a well-tested resistance zone is a different proposition from the same cross in the middle of nowhere.
- Multi-timeframe alignment. Reading the daily MACD for bias and the 4h MACD for timing cuts signal count substantially and keeps you from fighting the larger trend.
None of these combinations removes losing signals. They mainly reduce how often you act in conditions where the indicator is structurally weak.
Frequently asked questions
Q. What is the best MACD setting for crypto?
There is no single best setting. 12/26/9 remains the most widely used and the most widely watched; faster inputs like 8/17/9 reduce lag at the cost of many more false crossovers, and slower ones like 19/39/9 do the opposite. Because crypto trades 24/7 with no session boundaries, the calendar logic behind the original numbers does not apply, so choose based on how often you are willing to act and test on data you did not use to pick the parameters.
Q. Is MACD a leading or a lagging indicator?
MACD is fundamentally lagging, because it is built entirely from moving averages of past closes. The histogram is the least lagging component — it begins shrinking before the lines cross — and divergence can appear before price turns, but neither is predictive in a reliable sense. Any claim that MACD leads price should be treated as marketing language rather than description.
Q. What does a MACD crossover actually mean?
A bullish crossover means the MACD line has risen above its own 9-period average, so short-term momentum is improving relative to its recent norm. A bearish crossover means the opposite. It is a statement about the rate of change of two EMAs, not a forecast, and in sideways markets these crossovers occur very frequently — 13 times in a single month in the SOL 4h example above.
Q. What timeframe works best for MACD?
Higher timeframes generally produce fewer and cleaner signals, because the averaging has more data to work with and less microstructure noise. Many traders use daily or 4h for bias and a lower timeframe only for entry refinement. Below roughly 15 minutes in crypto, MACD crossovers tend to fire so often that fees and spread dominate any apparent edge.
Q. What is the difference between MACD and RSI?
MACD measures the distance between two moving averages and is unbounded, so it describes trend strength and acceleration. RSI is a bounded oscillator between 0 and 100 that describes where recent gains stand relative to recent losses, which makes it more useful for identifying stretched conditions. They are complementary rather than substitutes, and they will frequently disagree in trending markets.
Q. Does MACD divergence reliably predict reversals?
No. Divergence identifies that a new price extreme was reached with weaker momentum than the previous one, which is a reason for caution, not a reversal signal. In strong crypto trends divergence can persist through several further legs in the same direction, so most practitioners require a level, a structural break, or a second confirmation before treating it as actionable.
Key takeaways
- MACD is EMA(12) − EMA(26), smoothed by a 9-period EMA signal line, with the histogram being the gap between the two; it is denominated in price units and has no fixed bounds.
- Gerald Appel created it in the late 1970s; the histogram is credited to Thomas Aspray in 1986 as a way to see crossovers coming earlier.
- Its side of zero is the stable, slow information; the signal-line crossover is the fast, noisy information — most mistakes come from treating the second as if it were the first.
- Market regime decides its usefulness: in the SOL/USDT 4h window from 27 September to 26 October 2026, 13 crossovers fired and only 3 of 13 moved in the signal's direction after 6 bars, while the signals aligned with the larger downward drift fared better over 18 bars.
- Used with a trend filter, a volatility or range detector, and real price structure, MACD is a reasonable momentum lens; used alone as a trigger, it mostly measures chop.
Educational material. Charts use real SOL/USDT perpetual prices; past behaviour does not predict future results. Not investment advice.