Indicator & technique library · Indicator library
Stochastic RSI Explained: Formula, Settings and Uses
At a glance
- Stochastic RSI applies the stochastic formula to RSI values instead of price, measuring where RSI sits inside its own recent range.
- It was introduced by Tushar Chande and Stanley Kroll in their 1994 book The New Technical Trader.
- Default settings are usually 14·14·3·3: a 14-period RSI, a 14-period stochastic lookback, and 3-period smoothing for %K and %D.
- It is far more sensitive than RSI, which makes it useful in ranges and unreliable as a standalone reversal signal in strong trends.
Stochastic RSI (often written StochRSI) is an oscillator built on top of another oscillator. Instead of applying the stochastic formula to price, it applies it to the Relative Strength Index, asking a narrower question: where does today's RSI sit inside its own range over the last N periods? The result swings between 0 and 100 and reaches those extremes far more often than RSI itself.
Traders care about it because plain RSI can spend weeks without touching 30 or 70, especially on assets that grind sideways. StochRSI re-scales RSI so that its quiet middle range becomes readable. The trade-off is sensitivity: it fires a lot of signals, and in a trending crypto market most of them are noise unless you filter them.
What is Stochastic RSI?
Stochastic RSI is a momentum oscillator that measures the position of the current RSI value relative to the highest and lowest RSI values over a lookback window. If RSI is at the top of its recent range, StochRSI reads near 100. If RSI is at the bottom, it reads near 0.
It is a second-derivative tool in the loose sense: price feeds RSI, RSI feeds the stochastic transformation. That double processing is what makes it fast and what makes it jumpy. It is not a replacement for RSI and it does not measure the same thing — RSI measures the balance of average gains and losses, while StochRSI measures RSI's position within its own range.
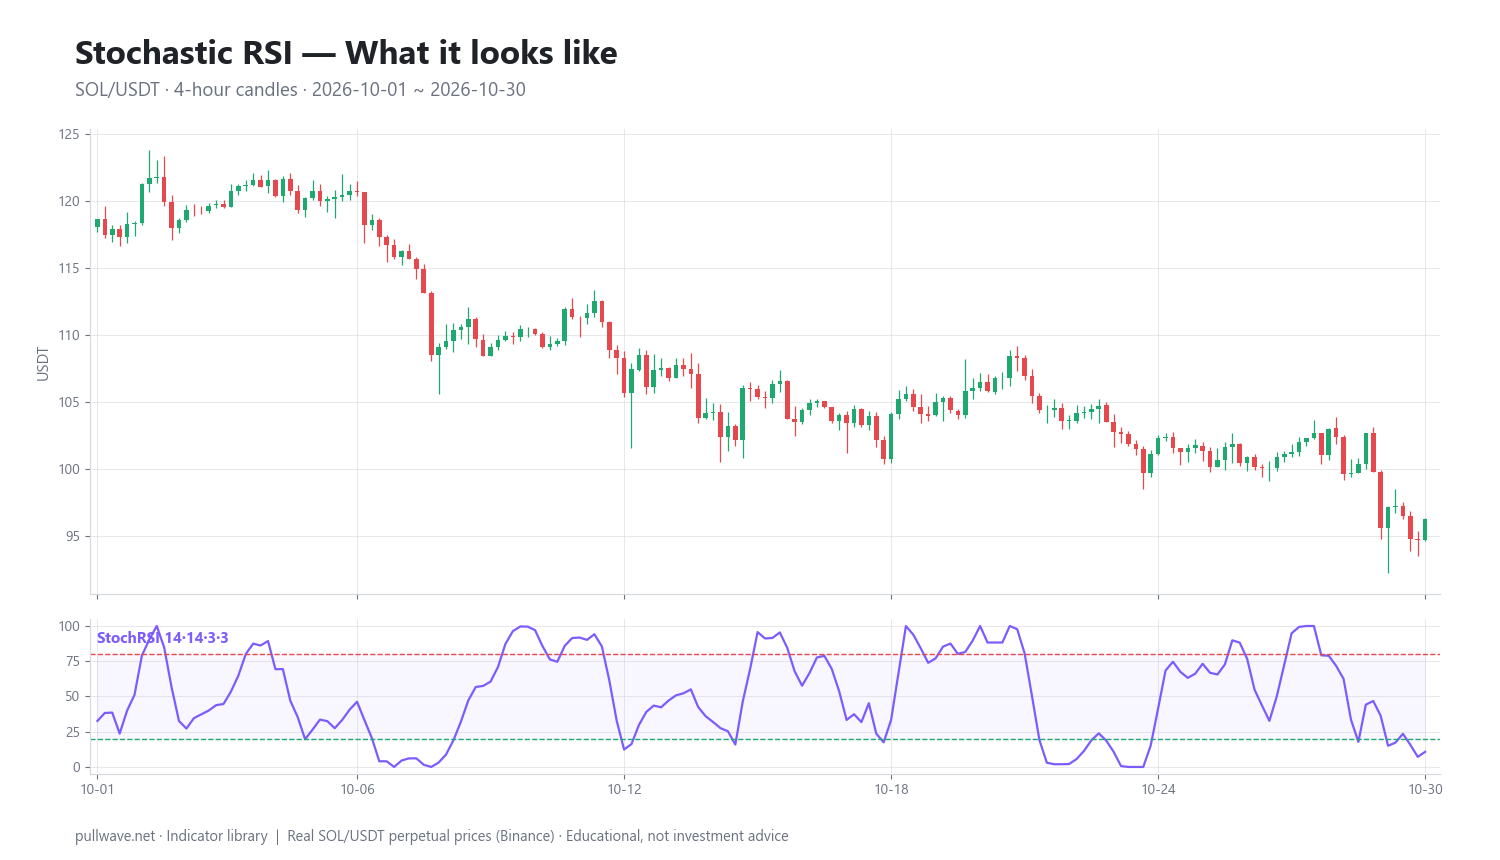
The figure above shows StochRSI plotted under real SOL/USDT 4-hour candles. Notice how the oscillator repeatedly travels the full 0–100 distance while price moves only a few percent, and how it can sit pinned against one boundary while a directional move runs.
The idea behind it (theory and history)
Stochastic RSI was introduced by Tushar Chande and Stanley Kroll in The New Technical Trader (John Wiley & Sons, 1994). Their stated motivation was practical: RSI frequently fails to reach the classic 30 and 70 thresholds over long stretches, so a trader waiting for those levels sees no signals at all for extended periods.
Their solution borrowed the normalization logic of the stochastic oscillator, a tool popularized by George Lane and his associates from the late 1950s onward. The stochastic asks where the close sits between the period high and the period low. Chande and Kroll substituted RSI for price, producing an indicator that is always calibrated to recent conditions rather than to a fixed historical scale.
The theory is that momentum is relative. A 55 RSI is unremarkable in a volatile market where RSI routinely travels from 25 to 80, but it may be a genuine momentum peak in a market where RSI has been oscillating between 38 and 56. StochRSI makes the second case visible. The cost is that it discards absolute information: a StochRSI of 100 tells you RSI is at a local high, not that momentum is strong in any absolute sense.
One detail worth knowing: the original Chande and Kroll version was the raw ratio, output between 0 and 1, with no %K/%D smoothing. The three-period smoothing and signal line that most charting platforms show by default are a later convention borrowed from the standard stochastic.
How it is calculated
Step by step:
- Compute RSI. Use Wilder's standard RSI over the chosen length, by default 14 bars. This gives a series of values between 0 and 100.
- Find the RSI range. Over the stochastic lookback (also 14 by default), record the highest RSI value and the lowest RSI value.
- Locate the current RSI in that range. Subtract the lowest RSI from the current RSI, then divide by the range (highest minus lowest). Multiply by 100 to express it as a percentage.
- Smooth to get %K. Take a short simple moving average of that raw series, usually 3 periods. This is the fast line most platforms label %K.
- Smooth again to get %D. Take a 3-period simple moving average of %K. This is the slower signal line.
``` RSI = Wilder RSI(close, rsiLength) # default 14
RSI - Lowest(RSI, stochLength)
StochRSIraw = --------------------------------- x 100 # default stochLength 14 Highest(RSI, stochLength) - Lowest(RSI, stochLength)
%K = SMA(StochRSIraw, smoothK) # default 3 %D = SMA(%K, smoothD) # default 3 ```
Two edge cases matter. If RSI is perfectly flat over the lookback, the denominator is zero and the value is undefined; platforms typically carry forward the previous reading or output zero. And because both the RSI and the stochastic use a lookback, the indicator needs roughly rsiLength + stochLength + smoothK + smoothD bars of history before its values are stable.
Default settings and variations
| Parameter | Default | What it controls |
|---|---|---|
| RSI length | 14 | How many bars feed the underlying RSI |
| Stochastic length | 14 | How far back the RSI high/low range is measured |
| %K smoothing | 3 | Smoothing of the raw StochRSI line |
| %D smoothing | 3 | Smoothing of the signal line |
| Zones | 20 / 80 | Oversold and overbought thresholds |
The 14 comes from Wilder's original RSI work, where it represented roughly half a monthly cycle in the daily commodity markets he studied. Chande and Kroll kept 14 for both the RSI and the lookback, which keeps the two stages symmetric. There is nothing magic in the number; it survives because it is widely used and therefore widely watched.
The 20/80 zones are wider than RSI's conventional 30/70 because StochRSI reaches its extremes far more often. Some traders push them to 10/90 to cut signal count, others use 5/95 on fast timeframes. Common variations include lengthening the RSI to 21 while keeping the lookback at 14 (smoother, fewer whipsaws), raising both smoothing values to 5, or dropping smoothing entirely to see the original raw oscillator.
In crypto, where there are no session breaks and volatility clusters are violent, many traders lengthen rather than shorten. A 14·14·3·3 StochRSI on a 5-minute perpetual chart produces dozens of extreme readings per day, nearly all of them meaningless.
How to read it
The basic vocabulary is small:
- Above 80 — RSI is near the top of its recent range. Conventionally called overbought, which really means "momentum is locally stretched," not "price must fall."
- Below 20 — RSI is near the bottom of its recent range. Conventionally oversold.
- %K crossing %D — the fast line crossing the signal line, used as a timing trigger, most often taken seriously only when it happens inside a zone.
- Exit from a zone — the line crossing back above 20 or back below 80, which some traders prefer to entry into the zone because it confirms the stretch is unwinding.
- Pinning — the line sitting at or near 0 or 100 for many consecutive bars. This is a trend signature, not a reversal signature.
- Divergence — price makes a higher high while StochRSI makes a lower high, or the reverse. Because StochRSI is noisy, divergences on it are less reliable than the same pattern on RSI.
The single most important interpretive rule is regime-dependence. In a range, zone readings tend to coincide with the edges of the range. In a trend, they coincide with pullbacks in the direction of the trend and with nothing useful in the opposite direction.
How traders use it
1. Mean reversion inside a defined range. When price is bounded between a visible support and resistance, StochRSI dipping below 20 near support or rising above 80 near resistance adds timing to a structural idea. Works when range boundaries are clear and volatility is stable. Fails the moment the range breaks — the first thrust out of a range usually produces an extreme reading that keeps extending.
2. Pullback timing within a trend. Establish trend direction with something slower (a long moving average, higher-timeframe structure), then use StochRSI dips below 20 in an uptrend as pullback markers. Works in orderly trends with regular retracements. Fails in parabolic moves where the oscillator never retraces, and in choppy markets where "trend direction" is ambiguous.
3. Exit and profit-management timing. Rather than entering on extremes, some traders use StochRSI reaching the opposite zone as a cue to tighten management on an existing position. Works as a scaling aid because it fires early. Fails as a full exit rule in strong trends, where it will take you out of the best part of the move.
4. Divergence confirmation. Using StochRSI divergence only when RSI or price structure already suggests exhaustion. Works as a secondary confirmation. Fails badly as a primary signal, because the oscillator produces so many local highs and lows that a divergence can be drawn almost anywhere.
For crypto specifically: perpetual futures add funding costs and liquidation risk to the equation. An oscillator that fires frequently encourages frequent entries, and on leverage, frequency multiplies cost and exposure. A signal that would be a tolerable loser on spot can be fatal at high leverage during a volatility spike.
Example on a real SOL chart
The window below is SOL/USDT perpetual on Binance, 4-hour candles, from 2026-10-01 to 2026-10-30, with StochRSI set to 14·14·3·3. The last close in the window is 96.3 and the last StochRSI reading is 10.74 — deep in the lower zone. Over the whole window the oscillator spent 45.6% of its time in an extreme zone (above 80 or below 20), which is a good illustration of how often this tool reaches its boundaries.
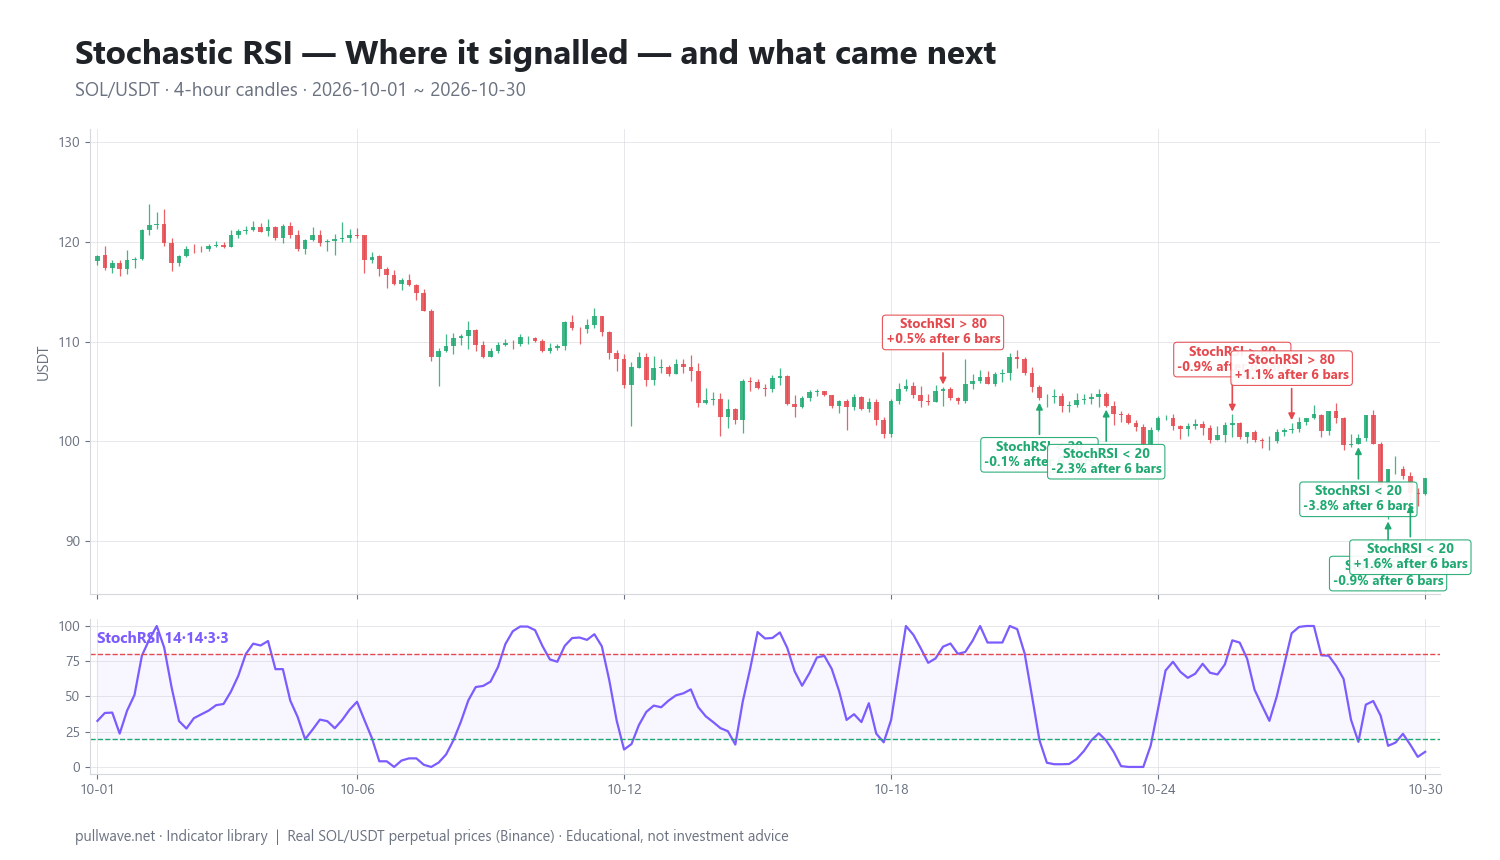
The figure marks each of the 19 zone events in the window and the percentage move after 6 bars and after 18 bars. Across all 19 events, 12 of 19 moved in the signal's implied direction by the measured horizon. That is one market, one timeframe, one month — not evidence that the tool works.
A closer look at the last ten events shows why the headline count flatters the picture:
| Date (UTC) | Signal | Price | After 6 bars | After 18 bars |
|---|---|---|---|---|
| 2026-10-18 16:00 | StochRSI < 20 | 100.78 | +3.19% | +7.41% |
| 2026-10-19 04:00 | StochRSI > 80 | 105.61 | −1.17% | −1.16% |
| 2026-10-20 00:00 | StochRSI > 80 | 105.28 | +0.47% | −1.04% |
| 2026-10-22 04:00 | StochRSI < 20 | 104.38 | −0.12% | −2.67% |
| 2026-10-23 16:00 | StochRSI < 20 | 103.52 | −2.33% | −2.98% |
| 2026-10-26 12:00 | StochRSI > 80 | 101.86 | −0.92% | +0.79% |
| 2026-10-27 20:00 | StochRSI > 80 | 101.29 | +1.08% | −4.93% |
| 2026-10-29 08:00 | StochRSI < 20 | 100.34 | −3.80% | −4.03% |
| 2026-10-30 00:00 | StochRSI < 20 | 97.19 | −0.92% | −0.92% |
| 2026-10-30 12:00 | StochRSI < 20 | 94.81 | +1.57% | +1.57% |
The pattern is instructive. The single best oversold reading, on 18 October at 100.78, was followed by +3.19% within six bars and +7.41% within eighteen. But from 22 October onward, price was drifting lower from 104.38 to 94.81, and in that stretch the oversold signals mostly preceded further weakness: −2.67%, −2.98%, −4.03%. The oscillator kept announcing that RSI was at the bottom of its recent range, which was true and unhelpful, because the range itself was sliding down.
The overbought readings in the same stretch behaved somewhat better, which is consistent with the downward drift — but note 27 October, where price rose 1.08% over the next six bars before falling 4.93% by the eighteenth. Six-bar and eighteen-bar outcomes disagreed on three of these ten events. If you are reading this as a reversal tool, the horizon you choose changes the verdict. Results here were genuinely mixed, and nothing in a single month of one perpetual contract should be generalized.
Common mistakes
- Treating 80 and 20 as instructions. They mark a condition, not an action. In a trend, the oscillator can hold above 80 for dozens of bars while price keeps climbing.
- Trading every crossover. With 45.6% of the time spent in a zone, on this chart alone, a rule that acts on every entry or cross produces constant turnover. Fees and funding consume the thin edge quickly on perpetuals.
- Forgetting it is derived from RSI. StochRSI at 100 can occur while RSI is only at 55. The underlying momentum may be unremarkable; only its position in the recent range is extreme.
- Using it on too fast a timeframe. On 1- and 5-minute crypto charts the indicator is close to a random number generator for most retail setups.
- Drawing divergences after the fact. The oscillator has so many local turning points that hindsight divergences are trivially easy and forward-looking ones are rare.
- Ignoring position sizing. A fast oscillator encourages many entries. Many entries at high leverage means many chances to be liquidated by a routine 4% wick.
Combining it with other tools
StochRSI is a timing layer, not a direction layer. It works best when something else has already answered "which way" and "where."
- A trend filter. A long moving average or higher-timeframe structure tells you which extreme readings to ignore. In a confirmed downtrend, oversold readings are usually pullback noise; the October 22–29 sequence above is a clean illustration.
- Market structure. Support, resistance and prior swing points give a level. The oscillator gives a moment. A reading without a level is just a number.
- RSI itself. Looking at both answers the question StochRSI cannot: is momentum absolutely weak, or just locally low? Divergence that appears on both is more interesting than divergence on StochRSI alone.
- Volatility measures. An ATR-based stop sized to current conditions matters more than the entry signal, especially on leveraged perpetuals where volatility expansion and liquidation interact.
- Volume or open interest. In crypto, a reversal with falling open interest reads differently from one with rising open interest, regardless of what the oscillator shows.
Frequently asked questions
Q. What is the difference between Stochastic RSI and RSI?
RSI measures the ratio of average gains to average losses over a lookback and is calculated directly from price. Stochastic RSI takes those RSI values and measures where the current one sits between the highest and lowest RSI of the last N periods. The result is a much more sensitive oscillator that reaches 0 and 100 frequently, whereas RSI may rarely touch 30 or 70.
Q. What are the best Stochastic RSI settings for crypto?
There is no universally best setting, and anyone claiming one is overselling. The 14·14·3·3 default is a reasonable starting point on 4-hour and daily crypto charts; on faster timeframes many traders lengthen the RSI to 21 or raise the smoothing to 5 to cut noise. Settings should be chosen to match the timeframe and the volatility of the specific pair, then left alone rather than tuned after every losing signal.
Q. What does it mean when Stochastic RSI is above 80?
It means RSI is in the top 20% of its own range over the lookback window. It describes a locally stretched momentum condition, not a prediction. In a strong uptrend the reading can remain above 80 for many consecutive bars while price continues higher, which is why it is read as trend confirmation rather than a reversal signal in that regime.
Q. Does Stochastic RSI work in a strong trend?
As a counter-trend reversal tool, generally not — it will signal "overbought" repeatedly during a sustained advance. It is more useful in a trend as a pullback timer in the trend's direction, or simply as evidence that a trend exists when the line pins near an extreme. Identifying the regime first is the whole job.
Q. Can you use Stochastic RSI on its own?
It is not designed for standalone use. Because it fires so often — in the SOL example it was in an extreme zone 45.6% of the time — it needs a directional filter and a structural level to be meaningful. Used alone it mostly measures short-term oscillation, which in a trending or gapping market is the least useful thing to measure.
Q. Is Stochastic RSI good for day trading crypto?
It can serve as a timing input on 15-minute to 4-hour charts when paired with higher-timeframe context. On very fast charts the signal-to-noise ratio collapses, and on leveraged perpetuals the combination of frequent signals, funding and liquidation risk makes high-frequency use of it expensive. The timeframe should be slow enough that each signal is worth the transaction cost.
Key takeaways
- Stochastic RSI, introduced by Chande and Kroll in 1994, applies the stochastic formula to RSI values rather than to price, normalizing RSI to its own recent range.
- The common 14·14·3·3 setup means a 14-period RSI, a 14-period range lookback, and 3-period smoothing for %K and %D; the original version had no smoothing at all.
- It is deliberately sensitive and reaches 0 and 100 often — in the SOL/USDT 4-hour example it sat in an extreme zone 45.6% of the time — so raw zone readings are conditions, not signals.
- The one-month SOL sample showed 12 of 19 events moving in the signaled direction, but several oversold readings preceded further decline and six-bar and eighteen-bar outcomes often disagreed; it is an illustration, not evidence.
- Pair it with a trend filter, market structure and explicit risk sizing, particularly on perpetual futures where frequent signals plus leverage compound both cost and liquidation risk.
Educational material. Charts use real SOL/USDT perpetual prices; past behaviour does not predict future results. Not investment advice.