Indicator & technique library · Indicator library
Donchian Channels Explained: Formula, Settings, Uses
At a glance
- Donchian Channels plot the highest high and lowest low of the last N bars, with a midline halfway between them.
- The default N is 20, inherited from Richard Donchian's four-week breakout rule for commodity futures.
- They are a trend and breakout tool: useful when volatility expands, prone to whipsaw in sideways markets.
- In the SOL/USDT 4h example below, 5 of 8 channel breakouts continued in the signal direction six bars later — a single illustrative window, not evidence of an edge.
Donchian Channels are one of the simplest indicators in technical analysis and one of the oldest ideas still in active use. The upper line is the highest high of the last N bars, the lower line is the lowest low of the last N bars, and the middle line sits halfway between them. There is no smoothing, no standard deviation, no weighting — just the extremes of recent price.
Traders care about them because they turn a vague question ("is price breaking out?") into a precise, testable one ("has price exceeded the highest high of the previous 20 bars?"). That precision is why channel breakouts became the backbone of systematic trend following, and why the tool survives in crypto, where 24/7 trading and violent volatility expansions make range breaks a daily occurrence.
What is Donchian Channels?
A Donchian Channel is a price envelope built from rolling extremes. For a chosen lookback N:
- Upper band — the highest high of the last N bars.
- Lower band — the lowest low of the last N bars.
- Middle band — the average of the two, i.e. the midpoint of the N-bar range.
Because the bands are made of actual highs and lows, they move in steps rather than curves. The upper band stays flat until a new high prints, then jumps; it drops only when the old high rolls out of the lookback window. That stair-stepping is a feature, not a flaw — it tells you exactly where the recent range boundary is, in price terms you can quote.
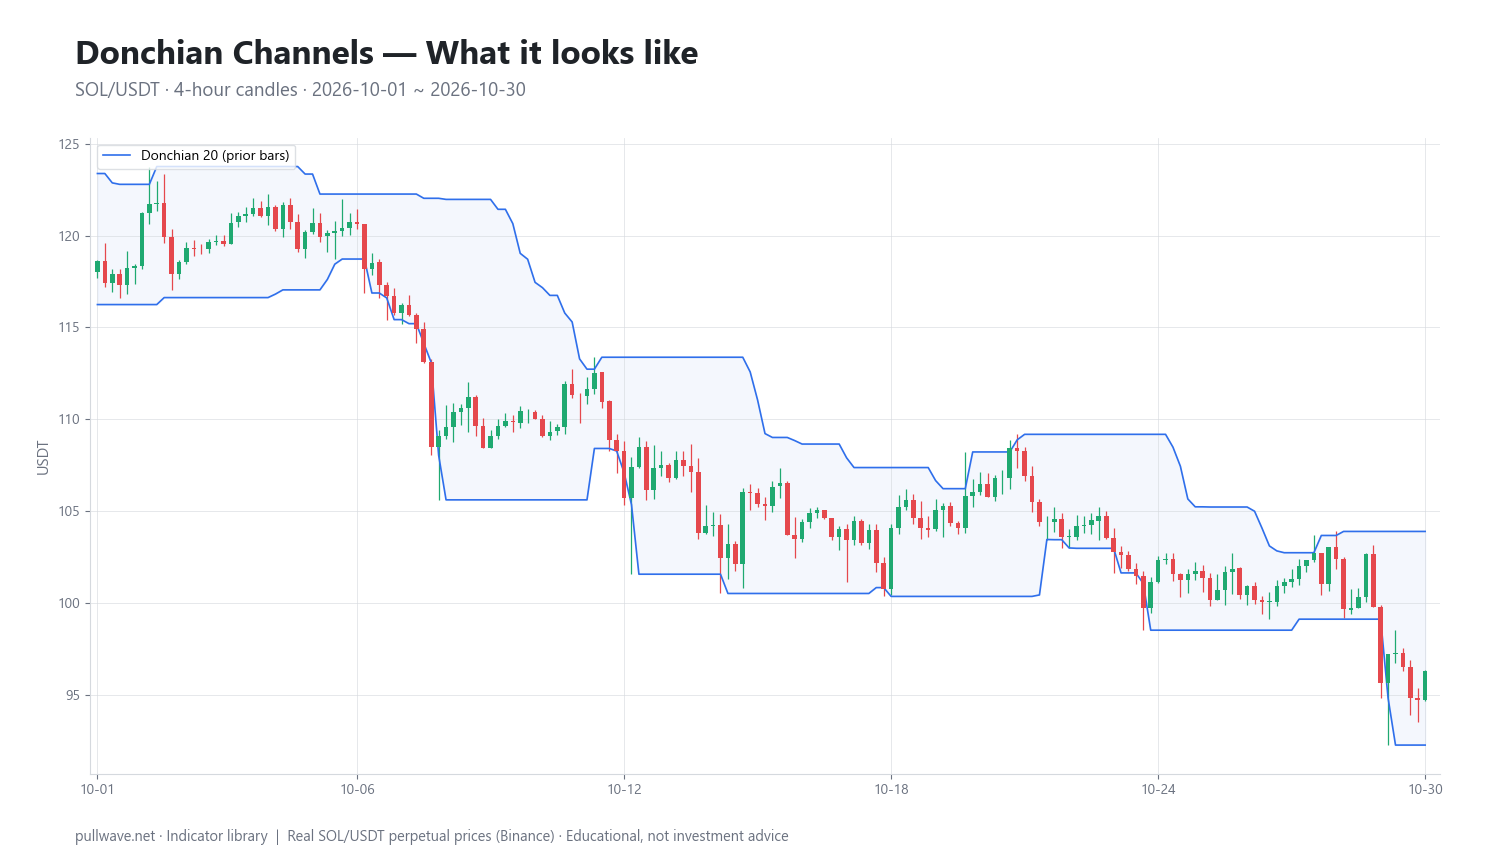
Figure 1 shows a 20-bar Donchian Channel drawn on real SOL/USDT 4h candles. Notice how the lower band tracks price lower in steps during the decline while the upper band stays frozen at old highs, and how the channel narrows when price goes quiet.
The idea behind it (theory and history)
The channel is named after Richard Davoud Donchian (1905–1993), an American futures trader widely regarded as a father of systematic trend following. He founded Futures, Inc. in 1949, commonly described as one of the first publicly offered managed commodity funds, and later wrote a widely read market letter while at the brokerage Shearson Hammill. His name is attached to two famous rules: a 5- and 20-day moving average crossover system, and the "four-week rule."
The four-week rule is the ancestor of the channel: cover shorts and go long when price exceeds the highest price of the preceding four full calendar weeks; cover longs and go short when price falls below the lowest price of the preceding four weeks. Plotting those two levels continuously on a chart produces exactly what we now call a Donchian Channel. Who first drew it as a band on a chart is not clearly documented; the rule came first, the visualization followed.
The underlying theory is about information, not geometry. In Donchian's view, a market that trades above everything it has traded at for a month has resolved a disagreement between buyers and sellers in favor of buyers, and such resolutions tend to persist long enough to pay for the false ones. The channel makes no attempt to forecast. It only defines the boundary where the recent balance has been broken.
The idea was popularized again in 1983 by the "Turtle" experiment run by Richard Dennis and William Eckhardt, whose published rules used breakouts of 20-day and 55-day extremes with shorter-lookback channel exits. The Turtle system is not the same thing as a Donchian Channel, but it is the reason the 20-period default is so deeply embedded in charting software.
How it is calculated
Step by step, for a lookback of N bars:
- Take the last N completed bars.
- Find the single highest high among them — that is the upper band for the current bar.
- Find the single lowest low among them — that is the lower band.
- Average the two to get the middle band.
- Move forward one bar and repeat; the oldest bar drops out of the window.
``` Upper(N) = max(High[1], High[2], ..., High[N]) Lower(N) = min(Low[1], Low[2], ..., Low[N]) Middle = (Upper + Lower) / 2
N = 20 (default) [1] = previous bar, so the current bar is excluded ```
The one detail worth getting right is whether the current bar is included. If you include it, price can never close above the upper band — by construction, the band equals the current high whenever a new high prints. For breakout work the band must be computed from previous bars only, which is the convention used in the example later on this page. Some platforms include the current bar by default and offset the plot by one bar instead; the result is the same, but you have to know which one you are looking at.
Note also that the bands use intrabar highs and lows, not closes. A variation sometimes used in systematic work builds the channel from closing prices only, which produces fewer, slower signals because single-wick spikes no longer set the boundary.
Default settings and variations
Twenty is the default because Donchian's rule covered four calendar weeks, and four weeks of daily commodity data was roughly 20 trading days. On a 24/7 crypto chart the arithmetic is different — 20 bars on a 4h chart is only about 3.3 days — so the number carries no magic. Treat it as a scale knob, not a law.
- N = 10–20: faster, more signals, more false breaks. Suited to intraday charts and to channel exits.
- N = 20–30: the common middle ground for swing trading on 4h and daily charts.
- N = 50–55: slow, few signals, fewer whipsaws, deeper giveback when a trend ends.
- Asymmetric channels: a long lookback for entry and a short one for exit (for example 20-bar breakout, 10-bar opposite channel to leave). This solves a structural problem: with a single N, a breakout level and its opposite exit level are too far apart.
- Close-based channels: replace high/low with close, filtering wick-driven signals.
- Shifted or offset channels: plotted forward one bar so the level you are watching is fixed before the bar opens.
How to read it
Read the three components separately. The width of the channel is a crude volatility measure: narrow bands mean the market has spent N bars in a tight range and energy is compressing; wide bands mean a large move is already in the window. The slope of the midline is a trend read — rising midline, higher highs and higher lows; flat midline, range.
The position of price inside the channel tells you who has been winning recently. Price riding the upper band with the midline rising is the classic trend signature. Price oscillating between the bands with a flat midline is a range, and in a range the bands behave more like boundaries than launchpads.
A band break is only meaningful relative to context. A break of the upper band after a long compression is a different event from a break that occurs after price has already run 30% and the channel has widened enormously — in the second case the band is far away and reaching it may be a late-stage move.
How traders use it
1. Breakout entry (trend following). The textbook use: a close beyond the N-bar extreme is treated as evidence that a new directional phase may be starting. Works when volatility is expanding and a market is transitioning out of compression into a sustained trend — in crypto, this often coincides with a decisive move after days of quiet. Fails in sideways, mean-reverting conditions, where each break is reversed and the trader is repeatedly stopped at the edge of the range. Breakout systems historically lose on the majority of signals and depend on a few large winners; that distribution is the whole point and also the reason most people abandon them.
2. Channel trailing exit. Enter however you like, then exit when price closes beyond the opposite band of a shorter channel (commonly 10 bars against a 20-bar entry). Works because it is adaptive: the stop tightens automatically when the market stops making new extremes. Fails when the shorter channel sits inside normal noise, shaking you out of a trend that is merely pausing.
3. Range fading. When the midline is flat and the channel width is stable, some traders treat the bands as the extremes of an established range and look for rejection back toward the midline. Works in low-volatility consolidations with clear horizontal structure. Fails catastrophically at the exact moment the range ends — fading a band is fading the one event the indicator was designed to detect, so it needs a hard invalidation level.
4. Regime and volatility filter. Channel width relative to its own recent average identifies compression and expansion phases. Many traders use it only as a filter — for example, taking breakout signals only when the channel has been narrow — rather than as a signal generator.
Example on a real SOL chart
The window below is SOL/USDT perpetual on Binance, 4h candles, from 1 October 2026 to 30 October 2026, with a 20-bar Donchian Channel computed from the previous bars only. The last close in the window was 96.30. This is one market over one month: it illustrates how the signals look and behave, nothing more.
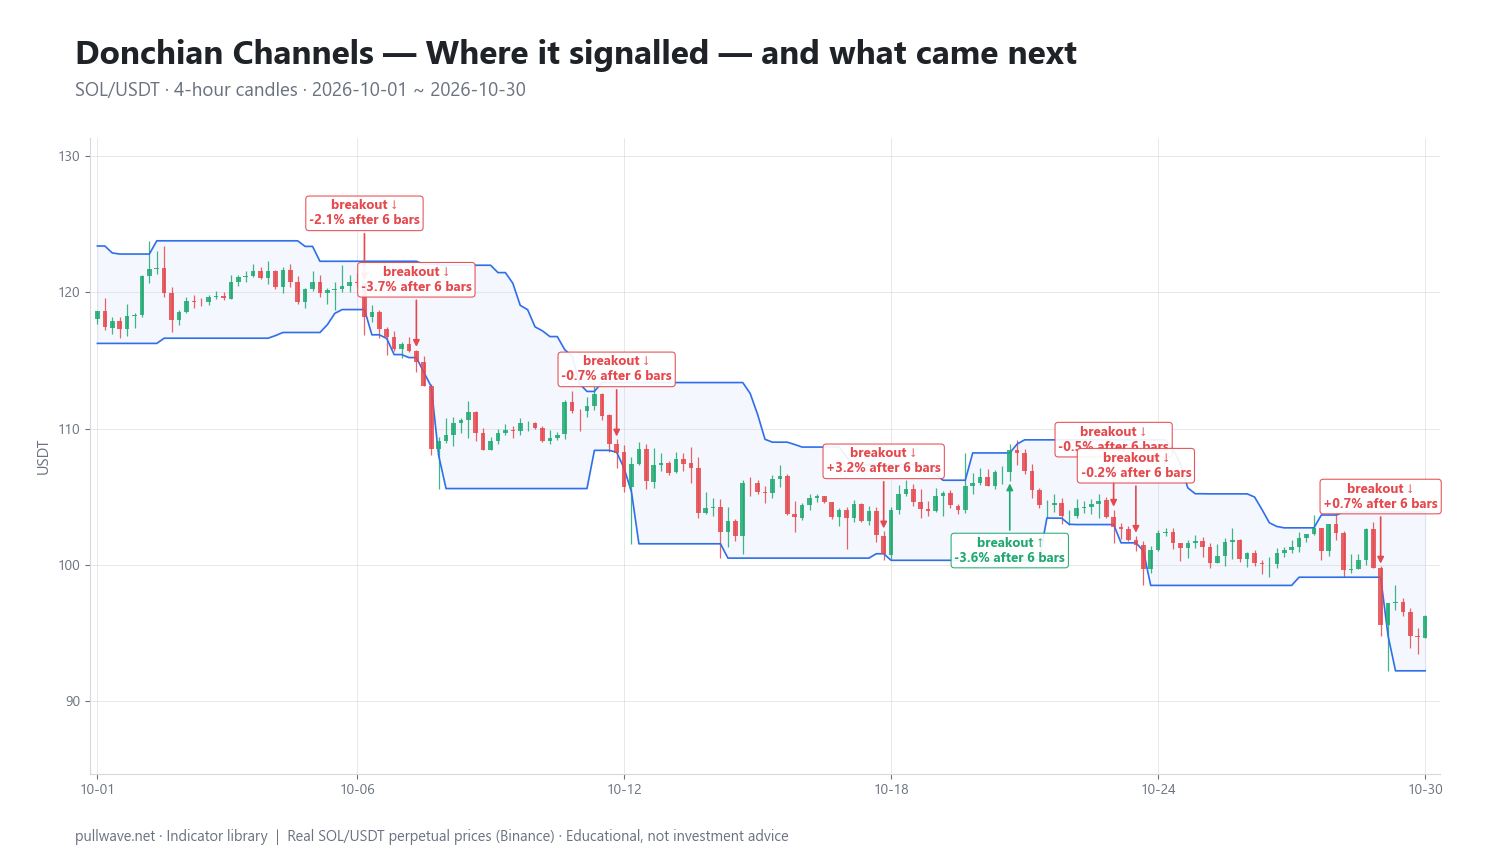
Across the window there were 8 channel breakouts — closes beyond the 20-bar extreme. For each one, the table shows the move 6 bars later (one day) and 18 bars later (three days), measured in the direction of price, not of the signal.
| Date (UTC) | Signal | Price | After 6 bars | After 18 bars |
|---|---|---|---|---|
| 2026-10-07 00:00 | breakout ↓ | 118.18 | -2.11% | -7.22% |
| 2026-10-08 04:00 | breakout ↓ | 114.90 | -3.72% | -4.85% |
| 2026-10-12 16:00 | breakout ↓ | 108.25 | -0.69% | -2.10% |
| 2026-10-18 16:00 | breakout ↓ | 100.78 | +3.19% | +7.41% |
| 2026-10-21 12:00 | breakout ↑ | 108.44 | -3.56% | -8.04% |
| 2026-10-23 20:00 | breakout ↓ | 102.79 | -0.45% | -1.83% |
| 2026-10-24 08:00 | breakout ↓ | 101.47 | -0.22% | -1.37% |
| 2026-10-29 20:00 | breakout ↓ | 95.62 | +0.71% | +0.71% |
Six bars after the signal, price had moved in the signal's direction in 5 of the 8 cases. The same five held up at 18 bars. That sounds respectable until you look at the sizes. The three downside breaks on 12, 23 and 24 October continued by less than 1% after six bars — well inside the range of a single SOL 4h candle, and easily consumed by fees and funding on a perpetual. The two meaningful winners were the first breaks of the month, when the market was falling from 118.18 to 114.90 and kept going.
The failures were larger than most of the successes. The downside break at 100.78 on 18 October was followed by a +7.41% rally over 18 bars, and the single upside break in the window, at 108.44 on 21 October, was followed by -8.04%. That asymmetry is the honest lesson here: in a choppy, downward-drifting month, channel breaks were frequent, mostly small when right, and occasionally expensive when wrong. Seven of the eight signals were downside breaks, which is simply what a falling market produces — the indicator did not predict the decline, it reported it.
Also note that the final signal, on 29 October at 95.62, had only 6 bars of data left in the window, which is why its two outcome numbers are identical. Small samples like these cannot validate or invalidate a method; they can only show you its texture.
Common mistakes
- Letting the current bar into the calculation. Price then touches the band constantly and your "breakout" is a tautology. Always check how your platform defines the bands.
- Using one N for both entry and exit. With a symmetric 20-bar channel, you only leave a long when price takes out a 20-bar low — a huge giveback. Asymmetric lookbacks exist for this reason.
- Taking every break regardless of regime. The same indicator that catches a trend will generate a dozen losing signals in a range. Most of the work in breakout trading is deciding when not to act.
- Treating the bands as reliable support and resistance. They are a record of past extremes, not an order book. In crypto they are also a magnet for stop hunts, since everyone can compute the same level.
- Ignoring position size. A method with a low hit rate and fat-tailed winners is extremely sensitive to leverage. On perpetuals, a sequence of small false breaks plus funding costs can erode an account long before the one large trend arrives, and a leveraged position sized for the "average" break can be liquidated by a normal one.
- Optimizing N until the backtest looks good. The difference between 18, 20 and 22 is noise. If your results depend on it, you have fitted the past.
Combining it with other tools
Donchian Channels tell you where the boundary is; they say nothing about how much the market typically moves. Pairing them with Average True Range covers that gap: ATR can set stop distance and position size, and the ratio of channel width to ATR tells you whether the range is unusually tight.
A trend filter reduces the worst whipsaws. A long-period moving average, the slope of the channel midline, or a higher-timeframe channel can be used to take only breakouts aligned with the larger structure — for example, acting on 4h upper-band breaks only while the daily midline is rising.
It is also worth understanding how Donchian relates to its two cousins. Bollinger Bands use a standard deviation around a moving average, and Keltner Channels use ATR around an EMA; both are smooth and centered on an average, so price spends most of its time inside them. Donchian bands are made of raw extremes, so price touches them precisely at the moments that matter. Using a volatility band together with a Donchian Channel — compression in one, break of the other — is a common pairing.
Finally, volume and open interest add context in crypto. A band break on expanding volume with rising open interest describes a different market state than a break on thin weekend liquidity, even though the indicator draws the same line.
Frequently asked questions
Q. What is the best Donchian Channel setting for crypto?
There is no single best value. Twenty bars is the conventional default and a reasonable starting point on 4h and daily crypto charts, but the right lookback depends on how long you intend to hold: shorter lookbacks (10–20) give more, noisier signals, longer ones (50–55) give fewer and slower ones. Rather than optimizing the number, most traders fix it and vary the timeframe.
Q. What is the difference between Donchian Channels and Bollinger Bands?
Donchian Channels plot the highest high and lowest low of the last N bars, so the bands are literal past extremes and price touches them only when it makes a new high or low. Bollinger Bands plot a standard-deviation envelope around a moving average, so they are smooth and price stays inside them most of the time. Donchian is a breakout tool by construction; Bollinger is primarily a volatility and dispersion tool.
Q. Does the Donchian Channel include the current candle?
It depends on the implementation. For breakout analysis the bands should be built from the previous N bars only, so that the current bar can actually close beyond them; if the current bar is included, price can never exceed the upper band. Check your charting tool's definition or offset the plot by one bar.
Q. Is the Donchian Channel the same as the Turtle trading system?
No. The Turtle rules taught by Richard Dennis and William Eckhardt in 1983 used breakouts of 20-day and 55-day price extremes, which are Donchian-style levels, but the full system also specified volatility-based position sizing, pyramiding, correlation limits and channel exits. The channel is one component, not the system.
Q. Do Donchian Channels work on low timeframes like 5 minutes?
They can be plotted on any timeframe, but the lower you go, the higher the proportion of false breaks, because microstructure noise and stop runs produce new extremes constantly. On perpetual futures, trading costs and funding also consume a larger share of the typical move. Shorter timeframes demand stricter filters, not looser ones.
Q. How do you use the middle line of a Donchian Channel?
The midline is the midpoint of the N-bar range. Its slope is a simple trend read, and some traders use it as a profit target for range trades or as a trailing reference in a trend. It is not a moving average and will sit still for long stretches, since it only changes when a new N-bar high or low is set or an old one rolls out of the window.
Key takeaways
- A Donchian Channel is the highest high and lowest low of the last N bars, with a midline between them — no smoothing, no forecasting.
- The 20-period default descends from Richard Donchian's four-week breakout rule for commodity futures, not from anything specific to crypto.
- The tool rewards trending, volatility-expanding markets and punishes ranges; deciding which regime you are in matters more than the setting you choose.
- In the SOL/USDT 4h window shown, 5 of 8 breakouts continued in the signal direction after six bars, but several winners were under 1% while two failures exceeded 7% — one illustrative month, not proof of an edge.
- Donchian Channels pair naturally with ATR for sizing and stops, and with a higher-timeframe trend filter to avoid acting on every break.
Educational material. Charts use real SOL/USDT perpetual prices; past behaviour does not predict future results. Not investment advice.