Indicator & technique library · Indicator library
Parabolic SAR Explained: Formula, Settings and Uses
At a glance
- Parabolic SAR is J. Welles Wilder's stop-and-reverse system from 1978 that plots an accelerating trailing stop as dots above or below price.
- The acceleration factor starts at 0.02, rises by 0.02 at each new extreme and caps at 0.20, pulling the stop closer to price as a trend extends.
- It is built for trending markets and produces frequent whipsaws in ranges, so most traders use it as an exit or trail rather than a standalone entry signal.
- In the SOL/USDT 4h example the indicator flipped 15 times in a month and only 5 of 15 flips were followed by a move in the signal's direction.
The Parabolic SAR ("Stop And Reverse") is a trend-following indicator that draws a single dot above or below each candle. The dots mark where a trailing stop would sit, and they accelerate toward price the longer a move extends. When price finally reaches the dot, the indicator flips to the other side and the assumed trend direction reverses.
Traders care about it for one reason above all: it is one of the few classic indicators that answers the question "where do I get out?" rather than "where do I get in?" It is mechanical, it never sits still, and it tightens automatically as a trend matures. That strength is also its weakness — in sideways markets the same mechanism produces a stream of false flips.
What is Parabolic SAR?
Parabolic SAR is a price-and-time system that places a stop level on the chart for every bar. In an uptrend the dots sit below price and rise; in a downtrend they sit above price and fall. The level only ever moves in the direction of the assumed trend — it never retreats.
The word "parabolic" describes the shape of the dot trail. Because the step size grows each time the trend makes a new extreme, the curve starts shallow and steepens, resembling a parabola. "Stop and reverse" describes the trading logic Wilder attached to it: the system is always in the market, long or short, and the stop for one position is the entry for the opposite one.
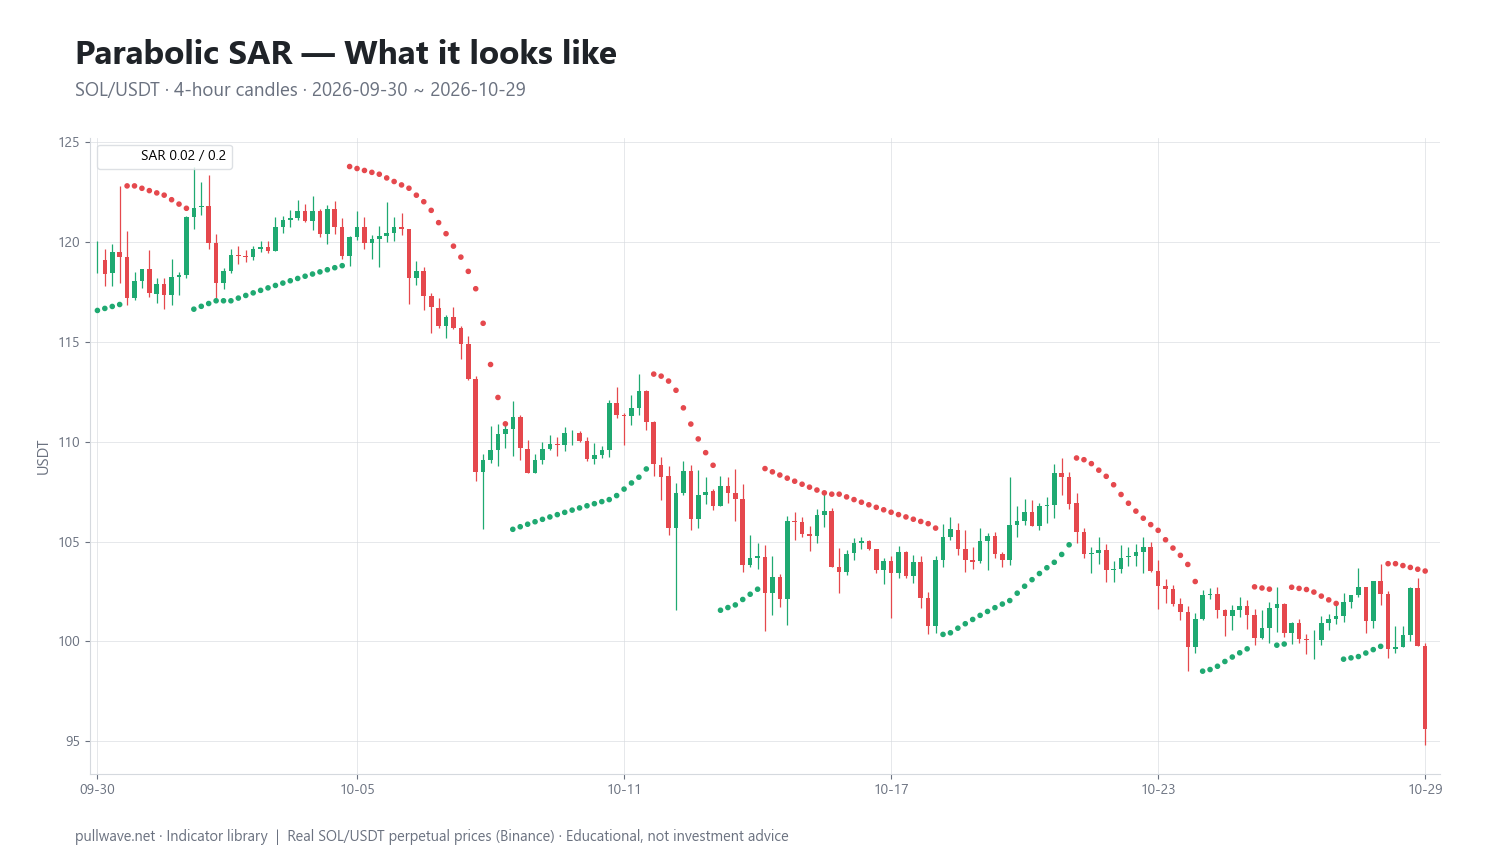
Figure 1 shows the indicator drawn on real SOL/USDT 4-hour candles over the window used later on this page. Notice how the dots cluster far from price right after a flip and then creep closer, bar by bar, as the move continues — and how quickly they change sides when the market stops trending.
The idea behind it (theory and history)
Parabolic SAR was created by J. Welles Wilder Jr. and published in his 1978 book New Concepts in Technical Trading Systems, the same book that introduced RSI, ATR and the Directional Movement system (ADX). Wilder originally called it the Parabolic Time/Price System.
The theory is simple and worth stating plainly: Wilder argued that a position should be given room when a trend is young, but that room should shrink as the trend ages, because the probability of a reversal grows with the distance already traveled. He also wanted time to matter. If a trend stalls and makes no new extreme, the stop still advances — the position is penalized for going nowhere.
That is what the acceleration factor encodes. Each new extreme in the direction of the trend earns the stop a slightly larger step. A trend that keeps extending is tracked loosely at first and tightly later; a trend that goes flat gets squeezed out. Wilder himself was explicit that the system works well in trending markets and poorly in congestion, and he suggested filtering it with his Directional Movement indicator.
How it is calculated
The calculation runs bar by bar and needs three state variables: the current SAR, the extreme point (EP) of the current trend, and the acceleration factor (AF).
- Decide the starting direction. Most implementations simply look at the first few bars and assume the prevailing direction; the choice washes out after a few flips.
- Track the extreme point. In an uptrend, EP is the highest high made since the trend began. In a downtrend, EP is the lowest low.
- Set the acceleration factor. AF starts at 0.02. Every time the trend posts a new EP, AF increases by 0.02. It stops increasing at 0.20.
- Advance the SAR. The next bar's SAR moves a fraction AF of the distance between the current SAR and the EP.
- Clamp it. The new SAR may never be placed inside the price range of the last two bars. In an uptrend it must stay at or below the lower of the previous two lows; in a downtrend at or above the higher of the previous two highs. Without this rule the stop could sit inside a bar that has already traded and trigger immediately.
- Check for a flip. If price penetrates the SAR, the trend is considered reversed. The new SAR is set to the EP of the trend that just ended, EP is reset to the current bar's extreme in the new direction, and AF resets to 0.02.
``` Uptrend: SAR(t+1) = SAR(t) + AF x (EP - SAR(t)) EP = highest high of the current uptrend clamp: SAR(t+1) <= min(low[t], low[t-1])
Downtrend: SAR(t+1) = SAR(t) - AF x (SAR(t) - EP) EP = lowest low of the current downtrend clamp: SAR(t+1) >= max(high[t], high[t-1])
AF: start 0.02, +0.02 at each new EP, capped at 0.20
Flip (price touches/crosses SAR): SAR(new) = EP(old trend) EP(new) = current bar extreme in the new direction AF = 0.02 ```
One implementation detail matters in practice: whether the flip is triggered by an intrabar touch (the bar's high or low reaching the SAR) or only by a close beyond it. Wilder's original description uses price penetration, and most charting platforms follow that. Close-only variants flip less often but later. Check which one your chart uses before comparing results with anyone else's.
Default settings and variations
The standard parameters are the ones Wilder published: AF start 0.02, step 0.02, maximum 0.20. The 0.02 step means the stop closes 2% of the remaining gap to the extreme on the first new-high bar, and the 0.20 cap means it can never close more than 20% of that gap in a single bar — a limit that stops the parabola from slamming into price after a long run.
Common variations change the character of the tool rather than fixing it:
- Slower (start/step 0.01, max 0.10): wider trail, fewer flips, more open profit given back. Often used on higher timeframes or very volatile assets.
- Faster (start/step 0.03–0.05, max 0.30): tighter trail, many more flips. Only defensible in strong, clean trends; in crypto ranges it is a whipsaw machine.
- Max only: some traders keep the 0.02 start and lower only the cap, which keeps early behavior intact but prevents the stop from tightening too aggressively late in a move.
A practical note on crypto: the indicator has no volatility normalization. It measures distance in price units from the running extreme, not in ATR multiples. The same settings therefore behave very differently on a 4-hour BTC chart and a 5-minute altcoin chart. If you change market or timeframe, re-examine the trail distance instead of assuming the defaults transfer.
How to read it
Reading the indicator takes three observations:
- Side. Dots below the candles means the system is in an assumed uptrend; dots above means an assumed downtrend. That is the directional state.
- Distance. A wide gap between dots and price signals a young trend or a recent flip. A dot sitting right under the candle bodies signals a mature, accelerated trend where any pause will trigger a reversal.
- Flips. A flip is the only discrete event the tool produces. It is simultaneously an exit for the old direction and, in Wilder's design, an entry for the new one.
What the indicator does not tell you is trend strength, momentum, or whether a market is trending at all. Parabolic SAR always has an opinion, even in a flat range where no trend exists. Interpreting that forced opinion as information is the single most common error.
How traders use it
1. As a trailing stop on an existing position. This is the use closest to Wilder's intent and the most defensible one. You take an entry from your own method, then let the SAR dot define where the trade is wrong as it progresses. Works when a trend runs for many bars without deep pullbacks. Fails when the asset trends in sharp steps with 10–15% retracements — in crypto that is normal, and an accelerated SAR will cut the position at the bottom of a routine pullback.
2. As a directional filter for another signal. Only take long setups while dots are below price, only shorts while they are above. The SAR becomes a regime switch rather than a trigger. Works in sustained directional markets and on higher timeframes where flips are rare. Fails in ranges, where the filter alternates every few bars and permits trades in both directions within a day.
3. As a stop-and-reverse system, as published. Always in the market, flipping at each dot penetration. Works only when a market trends persistently and the trader can absorb clustered losses. Fails badly in congestion — and on leveraged perpetual futures, repeatedly reversing position size multiplies fees, funding and liquidation exposure. Most traders who test this honestly end up using the flip as an exit only.
4. As a trend-maturity gauge. Watch how long a trend has held one side and how tight the dots have become. A SAR that has ridden under price for forty bars with AF at the cap tells you the trail is now hair-trigger — useful context for scaling out or tightening your own risk, independent of whether you trade the flip. Works as a qualitative read; fails if used as a timing signal, because "mature" trends can extend far longer than the indicator implies.
Example on a real SOL chart
The window is SOL/USDT perpetual on Binance, 4-hour candles, 30 September 2026 to 29 October 2026, with default settings (AF start 0.02, step 0.02, max 0.2). The last close in the window was 95.62. Over roughly a month the indicator produced 15 flips — about one every twelve bars, or one every two days.
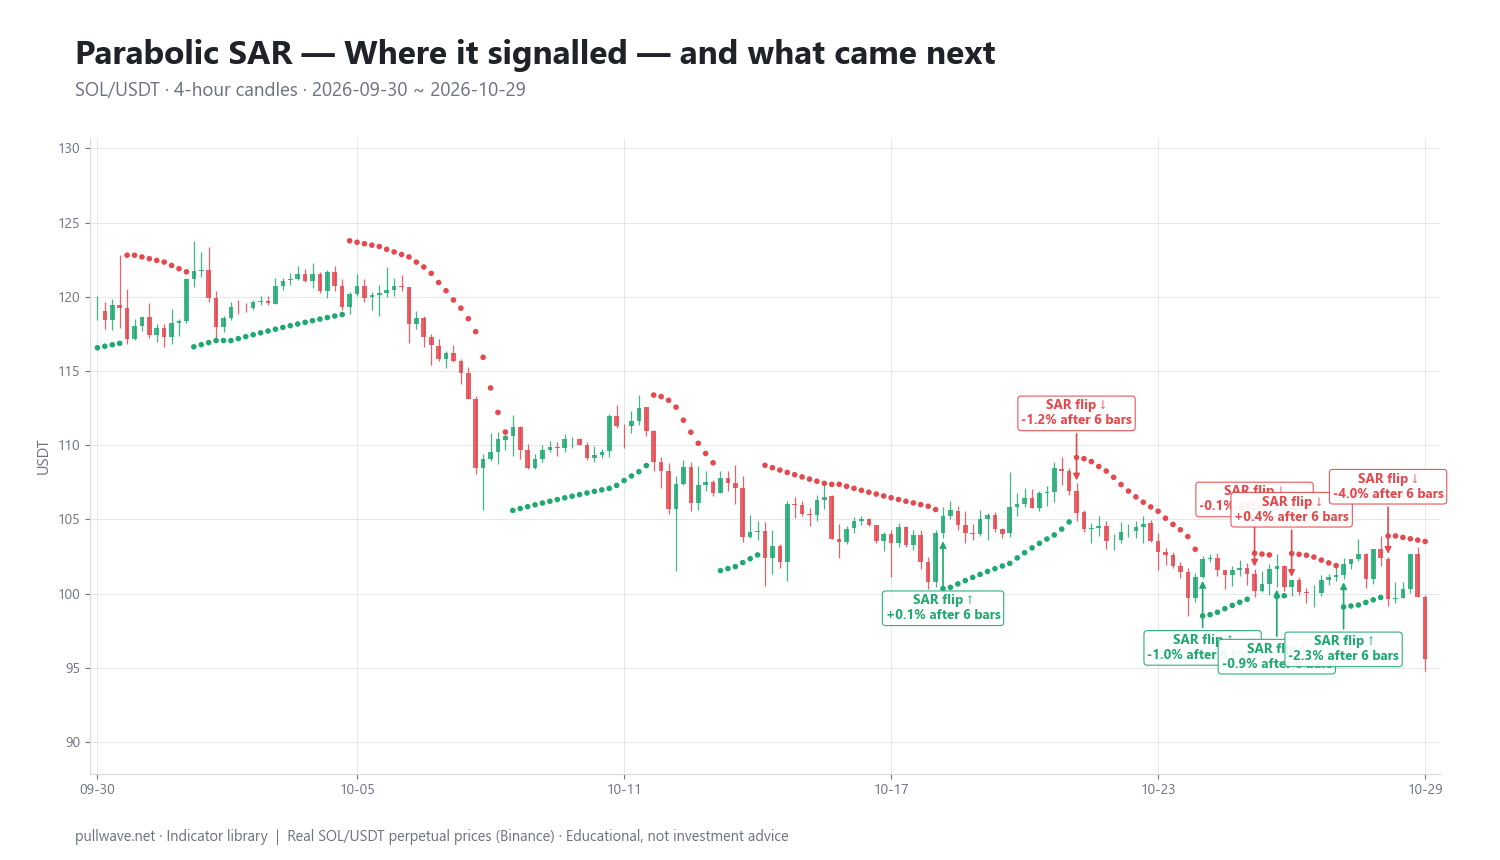
Figure 2 marks each flip and the percentage move after 6 bars (one day) and after 18 bars (three days). Here are ten of the fifteen:
| Date (UTC) | Signal | Price | After 6 bars | After 18 bars |
|---|---|---|---|---|
| 2026-10-14 00:00 | flip ↑ | 107.78 | −4.97% | −2.65% |
| 2026-10-15 00:00 | flip ↓ | 102.42 | +2.79% | +2.00% |
| 2026-10-19 00:00 | flip ↑ | 105.22 | +0.06% | +0.24% |
| 2026-10-22 00:00 | flip ↓ | 105.47 | −1.21% | −2.92% |
| 2026-10-24 20:00 | flip ↑ | 102.33 | −0.97% | −1.02% |
| 2026-10-26 00:00 | flip ↓ | 100.18 | −0.05% | −0.54% |
| 2026-10-26 12:00 | flip ↑ | 101.86 | −0.92% | +0.79% |
| 2026-10-26 20:00 | flip ↓ | 100.91 | +0.38% | −5.24% |
| 2026-10-28 00:00 | flip ↑ | 101.99 | −2.30% | −6.25% |
| 2026-10-29 00:00 | flip ↓ | 99.64 | −4.03% | −4.03% |
Across all fifteen flips in the window, 5 of 15 were followed by a move in the signal's direction over the measurement horizon. That is a weak read, and it is roughly what the indicator's design predicts in this kind of tape: SOL drifted from the 107s down to 95.62 in a choppy, overlapping manner rather than in a clean trend, and the accelerating stop kept getting touched by noise.
Two details are worth studying. First, the cluster on 26 October: three flips inside a single day, at 00:00, 12:00 and 20:00 UTC, priced at 100.18, 101.86 and 100.91. Three reversals within twenty hours, inside a price band less than two points wide — a textbook congestion whipsaw, where each stop was hit by ordinary oscillation rather than by a change in trend.
Second, the asymmetry between the two directions in the final week. The short flips did line up with the drift: 26 October 00:00 at 100.18 was marginally lower after both horizons (−0.05% and −0.54%), 26 October 20:00 at 100.91 was roughly flat after 6 bars (+0.38%) but −5.24% after 18, and the last flip of the window, 29 October 00:00 at 99.64, was −4.03% at both horizons — it was the final signal in the sample, so no contrary flip followed it inside the window. The long flips, by contrast, were repeatedly punished: 24 October at 102.33 (−0.97% / −1.02%), 26 October 12:00 at 101.86 (−0.92% / +0.79%) and 28 October at 101.99 (−2.30% / −6.25%). The system kept re-entering long into a market that was grinding lower, and the gains available on the short side were interrupted by those long flips in between.
This is one indicator, one market, one month of 4-hour data. It is an illustration of behavior, not evidence about expected performance. A trending month on the same chart would produce a very different-looking table — which is the point: Parabolic SAR results are regime-dependent, and any single window flatters or damns it by accident.
Common mistakes
- Trading every flip. The system is always in the market by design. In a range, that means being wrong in both directions in sequence. Filter the regime before you act on flips.
- Ignoring the touch-versus-close question. On a 24/7 crypto market, a single thin-liquidity wick at 04:00 UTC can touch the dot and flip the indicator while the close stays firmly on the original side. Know which rule your platform applies.
- Using it as a reversal signal. A flip says the trail was hit, not that a new trend has begun. Most flips in choppy conditions are followed by a re-flip within a few bars.
- Assuming the stop distance is risk-appropriate. Right after a flip, the dot can be far from price — sometimes several percent on a 4-hour crypto chart. On leveraged perpetuals, that distance must be reconciled with position size and liquidation price before the trade, not after.
- Over-tuning the acceleration factor. Raising the step until historical flips look better is curve-fitting to one window. The parameter changes behavior; it does not change the fact that the tool needs a trend.
- Using it on timeframes below your noise floor. On 1-minute or 5-minute crypto charts the flip count explodes and fees and funding dominate any edge.
Combining it with other tools
Wilder's own suggestion was to pair the Parabolic system with the Directional Movement Index from the same book. ADX below roughly 20–25 indicates a non-trending market where SAR flips are least reliable; above that, the trail has something to trail. That single filter removes a large share of congestion whipsaws.
Other pairings that follow the same logic:
- Higher-timeframe trend context. Apply the SAR to a daily chart to define direction, and trade only in that direction on 4-hour or 1-hour charts. This reduces the alternating-filter problem.
- ATR for sizing. Because SAR has no volatility normalization, measuring the distance to the dot in ATR multiples tells you whether the implied stop is unusually wide or dangerously tight for current conditions.
- Moving averages or market structure. A simple structural filter — higher highs and higher lows, or price above a long moving average — identifies whether the regime suits a trailing system at all.
- Volume or momentum confirmation. Flips that coincide with a break of a recent swing and expanding volume behave differently from flips that occur inside a tight range on thin activity.
What does not help is stacking several trend-following tools that all measure the same thing. SAR, a fast moving average cross and a momentum oscillator in trend mode will usually agree, and will usually be wrong together in a range.
Frequently asked questions
Q. What are the best Parabolic SAR settings for crypto?
There is no setting that fixes the indicator's core limitation, but the published defaults — 0.02 start, 0.02 step, 0.20 maximum — remain the most widely used and the most comparable baseline. On volatile crypto charts many traders slow it down to 0.01/0.10 to avoid being stopped out by ordinary pullbacks. Faster settings such as 0.03 or higher tighten the trail and sharply increase the number of flips, which is generally counterproductive outside strong trends.
Q. Does Parabolic SAR repaint?
On closed bars, no — once a bar has closed, its SAR value is fixed and will not change. However, the current forming bar can flip the indicator intrabar and then un-flip before the close on platforms that trigger on price penetration, which looks like repainting to newer users. If that bothers you, evaluate signals only on closed candles.
Q. What is the difference between Parabolic SAR and a moving average?
A moving average is an average of past prices and can move in either direction. The SAR is a ratcheting stop level that only moves toward price, never away, and accelerates as the trend makes new extremes. They answer different questions: the moving average describes the average price level, the SAR describes where a trend-following exit would sit.
Q. Can you use Parabolic SAR on its own?
Wilder designed it as a complete stop-and-reverse system, but he also warned that it works in trending markets and loses money in congestion, and recommended filtering it. In practice, most traders use it as an exit or trailing stop alongside a separate method for deciding when to be in the market at all. Standalone use on a sideways crypto chart typically produces a cluster of small losses, as the 5-of-15 result in the SOL example illustrates.
Q. Which timeframe works best for Parabolic SAR?
Higher timeframes — 4-hour and daily — generally produce fewer flips and a better ratio of trend-capture to whipsaw, because the trail is less affected by intrabar noise. Below roughly one hour on crypto pairs, flip frequency rises quickly and trading costs plus funding can overwhelm the signal. The honest answer is that the timeframe matters less than the regime: the tool needs a trend on whatever chart you use it.
Q. Is Parabolic SAR good as a trailing stop?
It is one of the few indicators explicitly built for that job, and its acceleration rule gives trends room early and less room later, which many traders find intuitive. The trade-off is that it tightens on calendar time as well as price, so a trend that pauses gets stopped even if the pause is normal. Comparing the SAR distance against an ATR-based stop on the same chart is a useful sanity check.
Key takeaways
- Parabolic SAR comes from J. Welles Wilder's 1978 book New Concepts in Technical Trading Systems and is a stop-and-reverse trailing system, not a momentum or strength indicator.
- The stop advances by AF × (EP − SAR) each bar, with AF starting at 0.02, stepping 0.02 at every new extreme and capping at 0.20, and is clamped outside the last two bars' range.
- Dots below price mean an assumed uptrend, dots above an assumed downtrend; the only event the tool produces is the flip, which is best treated as an exit rather than an entry.
- Regime decides everything: in sustained trends the trail captures most of the move, while in ranges it whipsaws — in the SOL/USDT 4h window it flipped 15 times in a month and only 5 of 15 signals moved in the signal's direction.
- Pairing it with a trend-strength filter such as ADX, a higher-timeframe direction read, or ATR-based position sizing addresses its blind spots without pretending the limitation has been removed.
Educational material. Charts use real SOL/USDT perpetual prices; past behaviour does not predict future results. Not investment advice.