Indicator & technique library · Indicator library
Keltner Channels Explained: Formula, Settings and Uses
At a glance
- Keltner Channels are a volatility envelope: a moving average with bands placed a multiple of Average True Range above and below it.
- The modern default is a 20-period EMA with bands at ±2×ATR(10), though 10, 1.5 and 2.5 multipliers are all in common use.
- Because the bands use ATR rather than standard deviation, they are smoother than Bollinger Bands and tend to follow trend better than range noise.
- In a 4h SOL/USDT sample from autumn 2026, five closes below the lower band produced mixed follow-through — a reminder that band touches are context, not conclusions.
Keltner Channels are a volatility envelope drawn around price: a moving average in the middle, and an upper and lower band placed a fixed multiple of Average True Range (ATR) away from it. When volatility expands the bands widen, when it contracts they squeeze together. The channel therefore answers a simple question on every bar — is this move large relative to how much this market has been moving lately?
Traders care because that question underlies most discretionary decisions. A close outside the band can mean a genuine breakout or an exhausted spike, depending entirely on whether the market is trending or ranging. Keltner Channels do not resolve that ambiguity for you, but they measure it consistently, which is more than price alone can do.
What are Keltner Channels?
A Keltner Channel has three lines. The middle line is a moving average of price — in the modern version, a 20-period exponential moving average (EMA) of the close. The upper and lower bands sit at a multiple of the Average True Range above and below that middle line, typically two ATRs.
The result is a band that expands and contracts with realized volatility but keeps a constant statistical width in ATR terms. If the upper band is two ATRs above the EMA, then by construction price has to travel an unusual distance in a short time to close above it. That is the entire logic of the tool.
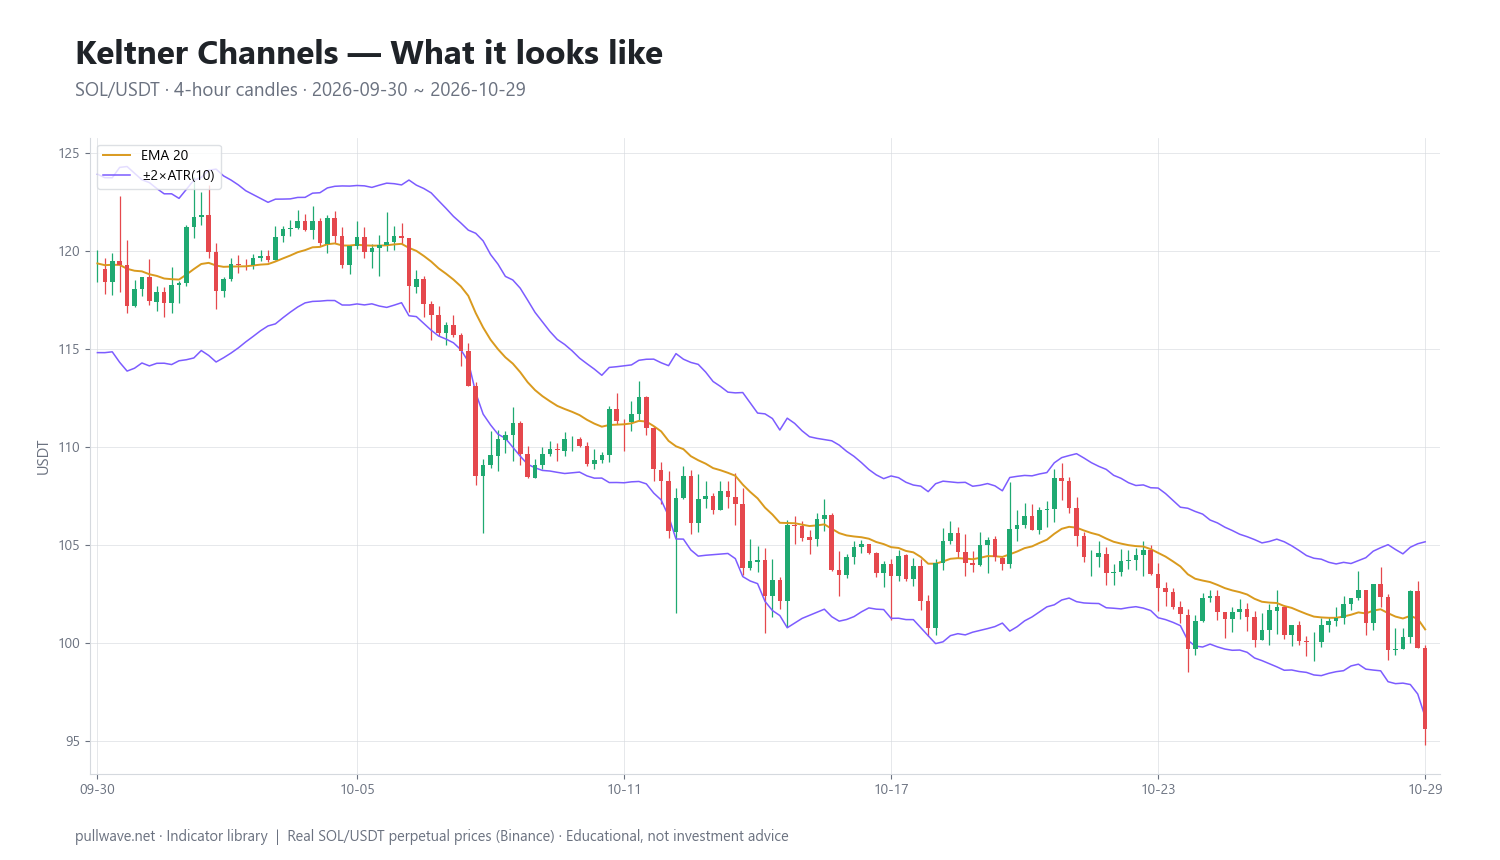
Figure 1 shows the channel on 4-hour SOL/USDT candles: the EMA threading through the middle of the move, and the two bands tracing an envelope that widens sharply during the fast October decline and narrows again when the market steadies. Notice how the bands tilt — unlike horizontal support and resistance, a Keltner Channel is a moving reference that follows the trend.
The idea behind it (theory and history)
The original construction comes from Chester W. Keltner, an American grain trader and market analyst, who described it in his 1960 book How to Make Money in Commodities. He did not call it a channel; he called it the "ten-day moving average trading rule." His middle line was a 10-day simple moving average of the typical price — (high + low + close) ÷ 3 — and his bands were that average plus and minus a 10-day simple moving average of the daily range (high minus low).
Keltner's reasoning was straightforward and still holds. The typical price is a better summary of where business was done than the close alone, and the average daily range is a natural yardstick for "how far is far" in a given market. A move beyond one average day's range from the mean was, in his framework, evidence that something had changed.
The version almost every charting platform ships today is a later modification, widely credited to trader Linda Bradford Raschke, who substituted an exponential moving average for the simple one and Wilder's Average True Range for the raw high-low range. ATR, introduced by J. Welles Wilder in New Concepts in Technical Trading Systems (1978), accounts for gaps by including the previous close in the range calculation — a meaningful improvement in markets that trade in sessions. The multiplier of two replaced Keltner's implicit multiplier of one, widening the channel so that band touches became less frequent and more informative.
So the tool has two lineages: a 1960 commodity-trading rule and a late-20th-century volatility overlay. Both share the same premise — normalize price movement by recent volatility instead of judging it in raw dollars or percent.
How it is calculated
Step by step, for the standard EMA 20 ± 2×ATR(10) configuration:
- Compute the middle line. Take a 20-period exponential moving average of the closing price. The EMA weights recent closes more heavily, so the channel turns faster than a simple average would.
- Compute True Range for each bar. True Range is the largest of three distances: the current bar's high minus its low; the absolute distance from the current high to the previous close; and the absolute distance from the current low to the previous close. Including the previous close captures gaps.
- Average the True Ranges. Take a 10-period average of True Range. Most platforms use Wilder's smoothing (a 1/n-weighted running average, equivalent to an EMA with period 2n−1); some use a simple average or a standard EMA. The differences are small but not zero.
- Place the bands. Upper band = middle line + 2 × ATR. Lower band = middle line − 2 × ATR.
- Repeat on every bar. All three lines update with each new close, so the channel is dynamic, not a fixed level.
TR     = max(High − Low, |High − PrevClose|, |Low − PrevClose|)
ATR    = SmoothedAverage(TR, 10)
Middle = EMA(Close, 20)
Upper  = Middle + 2 × ATR
Lower  = Middle − 2 × ATR
One practical note: because ATR is built from an average, the bands lag real volatility shifts slightly. After a violent candle the channel widens on the next bar, not the one that caused it.
Default settings and variations
| Setting | Common values | What it changes |
|---|---|---|
| Middle line | EMA 20 (modern), SMA 10 or 20 (original) | Shorter = faster turns, more whipsaw; longer = smoother trend reference |
| ATR period | 10 (modern default), 14, 20 | Shorter ATR reacts faster to volatility bursts; longer ATR gives a steadier channel width |
| Multiplier | 2.0 standard; 1.5 or 1.0 for more touches; 2.5–3.0 for fewer | Directly controls how often price closes outside the band |
| Price input | Close (typical today), typical price (H+L+C)/3 (Keltner's original) | Typical price makes the middle line slightly less sensitive to closing-auction noise |
Why 20 for the EMA? It is roughly a month of daily bars in traditional markets and has become the de facto medium-term trend average across technical analysis. Why 10 for ATR? It is short enough to reflect the current volatility regime within a couple of weeks of data, which is the point — a channel calibrated to last quarter's volatility would be useless in a fast market. Why a multiplier of 2? It is a compromise: wide enough that closes outside the band are relatively rare, narrow enough that they still occur often enough to be tradeable.
For crypto, where volatility regimes change quickly, some traders shorten the ATR period to 7–10 and keep the multiplier at 2, or raise the multiplier to 2.5 on lower timeframes where microstructure noise produces frequent, meaningless band pokes. There is no universally correct combination; what matters is that you fix the parameters before you evaluate them, not after.
How to read it
Read the channel in three layers, in this order.
Slope of the middle line. This is the trend context and it dominates everything else. A rising EMA with price holding in the upper half of the channel describes an uptrend; a falling EMA with price pinned to the lower half describes a downtrend; a flat EMA with price oscillating across it describes a range.
Width of the bands. Narrow bands mean compressed volatility — ATR has fallen, and energy is being stored. Widening bands mean volatility is expanding, usually because a directional move is underway. Width tells you about the character of the market, not its direction.
Position of price relative to the bands. Closing outside a band means the bar traveled more than two average ranges from the mean. In a trend, repeated closes outside the band in the direction of the trend indicate strength. In a range, a close outside the band more often marks a stretch that gets pulled back. Same reading, opposite implications — which is why the first layer comes first.
How traders use it
1. Trend continuation on band breaks. A close above the upper band while the middle line is rising is treated as evidence of trend strength rather than overextension. This works when volatility is expanding out of a quiet base and fails badly in choppy, mean-reverting markets, where each band break is the local high or low of a swing. Checking whether the middle line has a clear slope is the cheapest filter available.
2. Pullback entries at the middle line. In an established trend, price repeatedly retraces toward the EMA and resumes. The middle line acts as a moving reference for where a pullback becomes "normal." This is the most robust use of the tool in strong trends, and it degrades the moment the trend flattens — in a range, the middle line is just the midpoint and offers no edge.
3. Squeeze and expansion. When the Keltner bands narrow to a historically tight width, traders watch for the subsequent expansion rather than predicting its direction. Some combine this with Bollinger Bands: when the Bollinger Bands contract inside the Keltner Channel, standard deviation has fallen below the ATR-based envelope, which is a recognized definition of a volatility squeeze. The weakness is timing — squeezes can persist far longer than expected, and the first expansion often reverses.
4. Volatility-scaled exits and stops. Because the band is expressed in ATR units, it is a natural trailing reference: a stop placed beyond the opposite band automatically widens in volatile markets and tightens in calm ones. This is arguably the least glamorous and most durable application. Its cost is that ATR-based stops in crypto can be very wide during a liquidation cascade, which has direct consequences for position sizing on leveraged perpetuals — a wide stop with the same notional size is a much larger risk per trade.
Example on a real SOL chart
The window below is SOL/USDT perpetual futures on Binance, 4-hour candles, from September 30 to October 29, 2026, with the standard EMA 20 ± 2×ATR(10) configuration. This is one market over one month. It illustrates how the signals look; it proves nothing about expectancy.
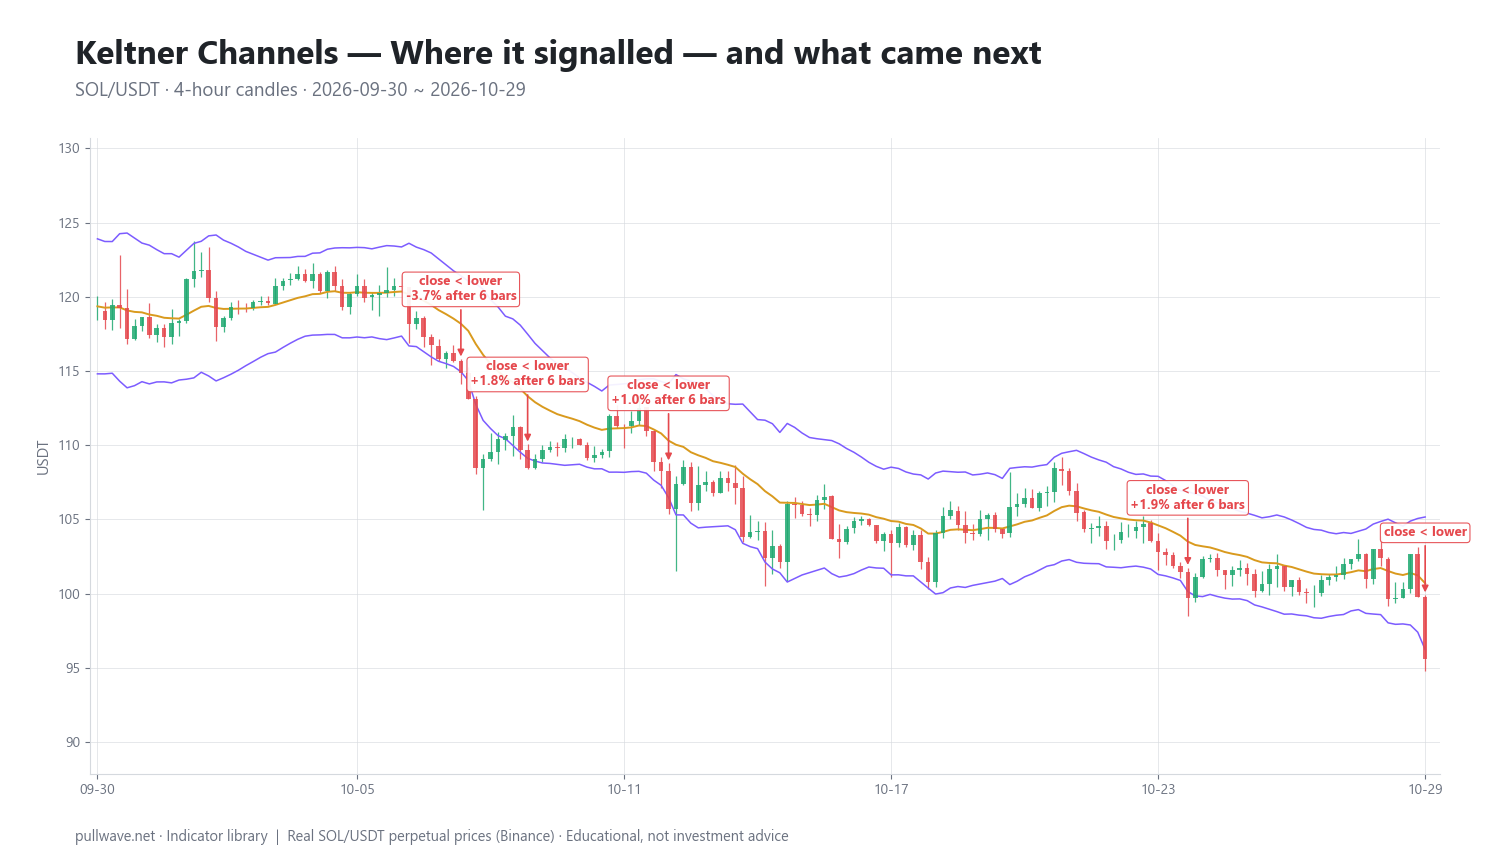
Over this window there were five closes below the lower band and none above the upper band — the signature of a sustained decline, with the middle line falling throughout. Figure 2 marks each of the five events and the percentage move 6 bars and 18 bars later.
- 2026-10-08 04:00 UTC, price 114.90 — −3.72% after 6 bars, −4.85% after 18 bars.
- 2026-10-09 16:00 UTC, price 108.45 — +1.82% after 6 bars, −0.18% after 18 bars.
- 2026-10-12 20:00 UTC, price 105.70 — +1.02% after 6 bars, −0.30% after 18 bars.
- 2026-10-24 12:00 UTC, price 99.72 — +1.88% after 6 bars, +1.20% after 18 bars.
- 2026-10-29 20:00 UTC, price 95.62 — the final close of the window, with no forward bars available to measure.
The results were mixed, and worth stating plainly. If a lower-band break is read as bearish continuation, only one of the four measurable events continued lower over the next 6 bars; the other three bounced between +1.0% and +1.9%. Stretch the horizon to 18 bars and three of four were lower, but two of those were essentially flat (−0.18% and −0.30%), which is noise on a 4-hour chart in an asset this volatile. Read the other way — as mean-reversion signals — the short-horizon bounces look better, but they were small relative to the ATR that produced the signal in the first place.
The larger point is visible in the price column: 114.90 → 108.45 → 105.70 → 99.72 → 95.62. Each band break occurred at a lower price than the last. Every bounce was a pause inside a decline, not a reversal of it. A trader using the lower band as a mean-reversion trigger in this window would have been fighting the slope of the middle line on every single signal, and the one event that did follow through (−4.85% after 18 bars) was the one at the start of the fastest leg down.
Common mistakes
Treating a band touch as a signal by itself. The band is a volatility threshold, not a verdict. Without the slope of the middle line and some sense of regime, a band break is close to a coin flip — as the SOL sample above shows.
Fading the band in a trend. The most expensive error. In a strong move, price can ride the outer band for many consecutive bars. "Overextended" is a statement about distance, not about time remaining.
Optimizing the multiplier until history looks good. If you have to search for a multiplier that produces clean signals on a specific past window, you have fitted the parameter to that window. Pick 2.0, or pick something defensible, and keep it.
Ignoring the lag in the bands. ATR averages past bars, so the channel widens after volatility arrives. On the bar that gaps or spikes, the band is still calibrated to the previous, calmer regime — which is exactly why violent candles close so far outside it.
Letting ATR-based stops dictate size. On leveraged perpetuals, a stop placed beyond the far band during a volatility expansion can be several percent away. Keeping the same notional size turns a routine stop into an outsized loss, and in extreme cases pushes the liquidation price inside the normal noise of the channel.
Combining it with other tools
Keltner Channels measure distance and volatility; they say nothing about participation or momentum. The natural complements fill those gaps.
- Bollinger Bands. Same envelope concept, different dispersion measure — standard deviation instead of ATR. Plotting both lets you see when the standard-deviation bands contract inside the ATR bands, the classic squeeze condition.
- ADX or a simple slope filter. A regime filter that distinguishes trending from ranging markets converts the ambiguous band break into two different, clearly defined situations.
- RSI or MACD. Momentum tools help separate a band break that comes with accelerating momentum from one that comes with divergence. Neither confirms the other mechanically, but the combination narrows the set of situations you act on.
- Volume and open interest. On perpetual futures, a lower-band break accompanied by a sharp drop in open interest often reflects forced liquidations rather than new directional positioning. That context is invisible on the channel itself.
- Higher-timeframe structure. Reading the daily channel before trading the 4-hour one is the simplest way to stop fading a trend you cannot see on your working chart.
Frequently asked questions
Q. What are the best Keltner Channel settings for crypto?
There is no single best setting, but EMA 20 with 2×ATR(10) is the standard starting point and works across most crypto timeframes. Traders working on 15-minute or 1-hour charts sometimes raise the multiplier to 2.5 to reduce meaningless band pokes caused by microstructure noise, while swing traders on daily charts often keep 2.0 and lengthen the ATR period to 14 or 20 for a steadier channel. Choose parameters before testing them, not after.
Q. What is the difference between Keltner Channels and Bollinger Bands?
Both draw bands around a moving average, but Bollinger Bands use standard deviation of closing prices while Keltner Channels use Average True Range. ATR includes each bar's high, low and the previous close, so Keltner bands are smoother and less reactive to single outlier closes, which makes them somewhat better suited to trend-following and Bollinger Bands somewhat better at flagging statistical extremes. Many traders plot both and watch the relationship between them.
Q. Does price always return to the middle line?
No. The middle line is an exponential moving average, and in a strong trend price can remain on one side of it for dozens of bars while the average itself travels toward price. Mean reversion to the EMA is a tendency in ranging markets, not a rule, and assuming it holds during a trend is one of the most common ways traders lose money with envelope indicators.
Q. Is a close outside the Keltner Channel a buy or sell signal?
On its own, no — it is a measurement that price moved more than two average true ranges from its mean. Whether that implies continuation or exhaustion depends on the regime: in trending conditions, closes outside the band in the trend direction usually indicate strength, while in ranges they more often mark the edges of the swing. The slope of the middle line is the first thing to check before interpreting any band break.
Q. What is a Keltner Channel squeeze?
A squeeze is a period when the channel narrows sharply because ATR has fallen, meaning the market is compressing. The best-known formulation compares the two envelopes: when Bollinger Bands contract entirely inside the Keltner Channel, volatility is unusually low and an expansion is considered likely at some point. The squeeze indicates that a move may be building, but gives no information about its direction or timing.
Q. Which timeframe works best for Keltner Channels?
The indicator is scale-free — it works the same way on any timeframe because ATR adapts to whatever volatility that timeframe produces. In practice, 4-hour and daily charts are popular in crypto because they filter out much of the 24/7 noise while still producing a usable number of signals; lower timeframes generate far more band touches, most of which have a poor signal-to-noise ratio.
Key takeaways
- Keltner Channels are a moving average with bands set a multiple of ATR away: standard configuration is EMA 20 ± 2×ATR(10).
- The construction dates to Chester Keltner's 1960 book using typical price and the average daily range; the EMA/ATR version in use today is a later modification widely credited to Linda Bradford Raschke.
- Read the slope of the middle line first, then the band width, then price position — a band break means the opposite thing in a trend versus a range.
- In the 4h SOL/USDT window from September 30 to October 29, 2026, all five band signals were lower-band closes at successively lower prices (114.90 down to 95.62), and follow-through was mixed: only one of four measurable events continued lower within 6 bars.
- The channel measures volatility and distance only; pair it with a regime filter, momentum, and position sizing that accounts for how wide ATR-based stops become on leveraged perpetuals.
Educational material. Charts use real SOL/USDT perpetual prices; past behaviour does not predict future results. Not investment advice.