Indicator & technique library · Indicator library
CCI Indicator Explained: Formula, Settings, Signals
At a glance
- The Commodity Channel Index measures how far price has moved from its own moving average, scaled by average deviation.
- Donald Lambert introduced it in Commodities magazine in 1980 to time commodity cycles; it is now used on all markets.
- Default CCI 20 reads near zero in balance, above +100 in strong up moves and below \u2212100 in strong down moves.
- It is unbounded, so in crypto trends it can stay far outside \u00b1100 for days, which breaks naive overbought/oversold use.
The Commodity Channel Index (CCI) is a momentum oscillator that answers one question: how unusual is today's price compared with its recent average? It subtracts a moving average of the typical price from the current typical price, then divides by the average deviation over the same lookback, so the result is expressed in "units of normal variation" rather than dollars.
Traders care about CCI because it adapts to volatility. A $3 move in SOL means something different in a quiet range than in a liquidation cascade, and CCI automatically rescales for that. It is also unbounded — unlike RSI or stochastics it has no ceiling at 100 — which makes it good at flagging genuine outliers but dangerous if you treat ±100 as a mechanical overbought/oversold switch.
What is CCI (Commodity Channel Index)?
CCI is a single line that oscillates around zero. A reading of zero means the typical price sits exactly on its moving average. A reading of +100 means price is roughly as far above its average as it "normally" gets; −300 means the move is an extreme outlier relative to the last 20 bars.
The name is historical. Lambert built it for commodity futures, but the math has nothing commodity-specific in it, so it is applied to equities, FX and crypto today. On a chart it is almost always plotted in a separate pane below price, with horizontal lines at +100, 0 and −100.
Two properties define its character. First, it is self-scaling: the denominator is a volatility measure, so a quiet market and a violent one both produce readings in a comparable range. Second, it has no bound: in a strong trend CCI can print +250, −300 or beyond, and those readings are information, not errors.
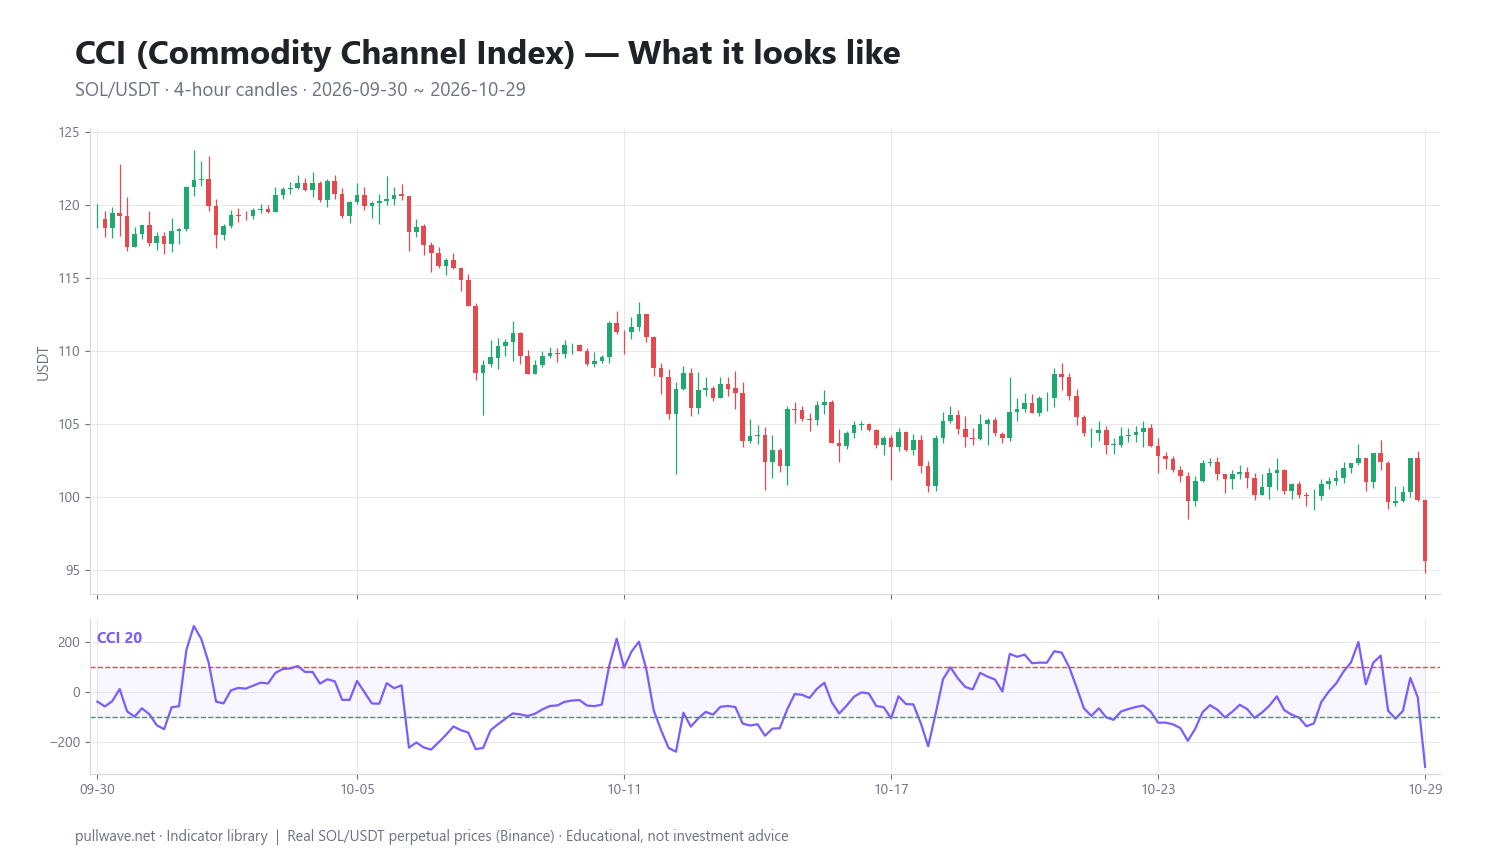
Figure 1 shows CCI 20 drawn under SOL/USDT perpetual 4-hour candles for the window used throughout this page. Notice how the line crosses the ±100 bands repeatedly, and how the deepest readings cluster where the candles themselves are largest.
The idea behind it (theory and history)
Donald R. Lambert introduced the Commodity Channel Index in Commodities magazine in 1980. His premise was that commodity prices move in cycles — seasonal and otherwise — and that a trader's job is to detect when a new cyclical move is starting rather than to guess tops and bottoms.
Lambert's statistical trick was to normalize the deviation of price from its mean by the mean absolute deviation over the same period. That converts a raw distance into a standardized score, so the same thresholds work across different contracts and different volatility regimes. He then chose a scaling constant so that most readings would sit inside a convenient band.
That constant is 0.015. It was selected so that roughly 70–80% of CCI values fall between −100 and +100, leaving the remaining 20–30% as the statistically unusual readings worth attention. In other words, ±100 was never meant to mean "overbought" or "oversold" — it was meant to mean "this is outside the normal range, a new move may be underway."
Lambert also suggested a lookback of roughly one-third of a complete cycle: if a market tended to cycle every 60 days, he would use about 20 periods. That is where the common default of 20 comes from. His original rules were breakout rules — treat a cross above +100 as the start of a strong up move and exit when the line fell back under +100 — which is the opposite of how many traders use it today.
How it is calculated
Step by step, for a lookback of n bars:
- For each bar, compute the typical price: high plus low plus close, divided by three.
- Compute a simple moving average of the typical price over the last n bars.
- For each of those n bars, take the absolute difference between its typical price and that same moving average value, then average those absolute differences. This is the mean deviation (mean absolute deviation, not standard deviation).
- Subtract the moving average from the current typical price.
- Divide by 0.015 times the mean deviation.
TP  = (High + Low + Close) / 3
MA  = SMA(TP, n)                       # n = 20 by default
MD  = (1/n) * Σ |TP_i − MA|            # i over the last n bars
CCI = (TP − MA) / (0.015 × MD)
A worked intuition: if the typical price is 1.5 mean deviations above its 20-bar average, CCI = 1.5 / 0.015 = 100. Three mean deviations gives 200. That is all the +100 line represents — a fixed multiple of recent average dispersion.
Two implementation details matter. The mean deviation uses the current moving average value compared against each of the last n typical prices, which is how Lambert defined it; some platforms differ slightly. And if a market is perfectly flat, mean deviation goes to zero and the formula divides by zero — most software returns zero or a null in that case.
Default settings and variations
| Setting | Typical use | Behavior |
|---|---|---|
| CCI 14 | Faster, popular on intraday charts | More ±100 crosses, more noise |
| CCI 20 | Lambert-style default | Balanced; the setting used in the example below |
| CCI 30–50 | Swing and position work | Fewer, slower signals; smoother line |
| Bands ±100 | Lambert's original | ~70–80% of readings inside, by construction |
| Bands ±200 | Trend filtering | Flags only genuine outliers |
The 20-period default follows Lambert's "one-third of a cycle" rule of thumb. On a 4-hour crypto chart, 20 bars is a little over three days — long enough to span a typical swing, short enough to react within a day.
Shortening the period makes CCI more sensitive: the moving average tracks price more closely, the mean deviation shrinks, and crosses multiply. Lengthening it does the reverse. If you widen the bands to ±200 instead of shortening the period, you keep the same line but demand a larger outlier before acting.
A common variation is to smooth the CCI line itself with a short moving average, or to plot two CCIs (for example 20 and 50) and use the longer one as a regime filter. Some platforms offer a "Woodies CCI" variant with additional pattern rules layered on the standard calculation; the underlying formula is unchanged.
How to read it
Start with the zero line. CCI above zero means the typical price is above its n-bar average — a simple statement about the short-term balance of supply and demand. Below zero is the mirror image. Many traders use zero as the trend filter and the bands for timing.
The ±100 bands mark the edge of normal variation. A first cross above +100 says momentum has accelerated beyond its recent range. Whether that means "too far, expect a snapback" or "a new leg is starting" depends entirely on regime, which is the central difficulty with this indicator.
Readings beyond ±200 or ±300 are statistical outliers. In crypto they usually mark news-driven impulses, funding squeezes or liquidation cascades rather than orderly trends, and they often — but not always — precede at least a pause.
The shape of the line matters as much as its level. A CCI that pushes to +180, pulls back to +60, then makes a higher high describes a healthy trend. A CCI that makes a lower high while price makes a higher high describes weakening momentum, which is the divergence case.
How traders use it
1. Breakout/continuation (Lambert's original approach). Treat the first cross above +100 as evidence a new up-move has begun and stay with it while the line holds above the band. This works in trending regimes — when a market is grinding directionally and each pullback holds, CCI tends to reset toward zero and push out again. It fails badly in ranges, where every ±100 cross is a false start and the line whipsaws across the bands.
2. Mean reversion at extremes. Watch for readings beyond ±200 or ±300 and look for the line to turn back toward the band as a sign the impulse is exhausting. This can work in established ranges and in the late stages of a blow-off. It fails in the first days of a real trend, where CCI simply stays extreme — that is exactly what a trend looks like through this lens, and "oversold" can get far more oversold.
3. Zero-line as a trend filter. Use a long-period CCI (40–50) to define direction and a short one (14–20) for timing, acting only on short-CCI signals that agree with the long-CCI sign. This filters out a large share of counter-trend noise. It lags at turning points, so the first leg of a reversal will usually be missed entirely.
4. Divergence. Compare swing highs in price with swing highs in CCI (and lows with lows). A price high unconfirmed by CCI shows the move is covering less distance relative to recent volatility than before. Divergence is most informative after an extended run into an obvious level; it is close to useless in choppy conditions, where divergences form and dissolve every few bars, and a single divergence can persist through several further legs in a strong trend.
Example on a real SOL chart
The window below is SOL/USDT perpetual on Binance, 4-hour candles, from 2026-09-30 to 2026-10-29, with CCI set to 20. This is one market over one month — an illustration of how the readings behave, not evidence that the tool works. Treat it that way.
Over this window CCI generated 21 band crossings (new moves outside +100 or below −100), and the indicator spent 37.2% of all bars outside the ±100 bands. That is well above the 20–30% Lambert's 0.015 constant implies for a statistically "normal" market, and it is a useful reminder that crypto spends a lot of time in outlier territory.
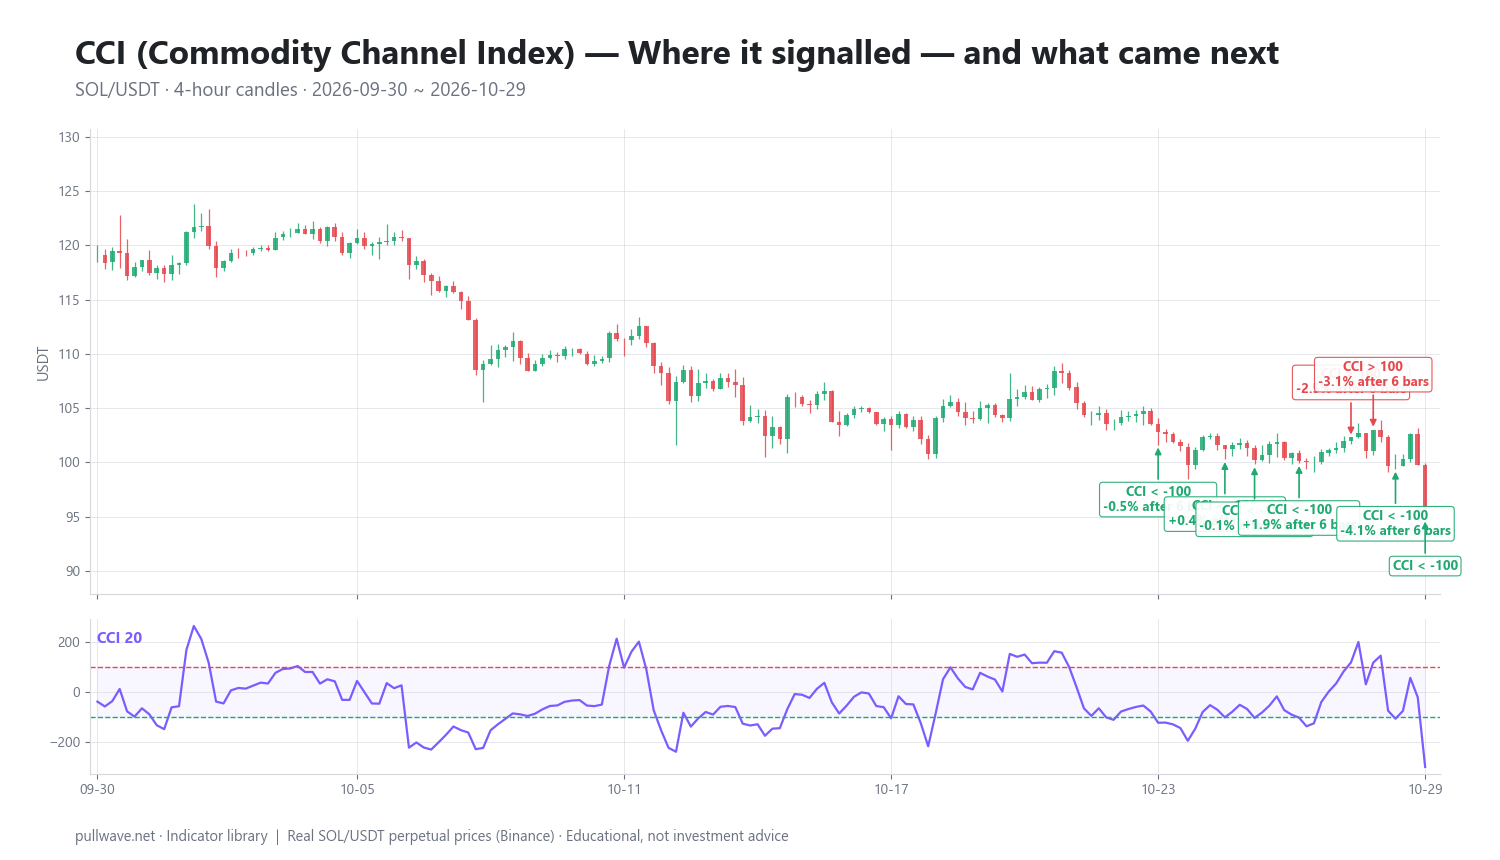
Figure 2 marks each signal on the same chart with the percentage price change after 6 bars (one day) and after 18 bars (three days). Here are the last ten events of the window:
| Date (UTC) | Signal | Price | After 6 bars | After 18 bars |
|---|---|---|---|---|
| 2026-10-20 12:00 | CCI > 100 | 105.81 | +2.49% | −1.02% |
| 2026-10-22 16:00 | CCI < −100 | 103.58 | −0.06% | −1.76% |
| 2026-10-23 20:00 | CCI < −100 | 102.79 | −0.45% | −1.83% |
| 2026-10-25 08:00 | CCI < −100 | 101.25 | +0.41% | +1.44% |
| 2026-10-26 00:00 | CCI < −100 | 100.18 | −0.05% | −0.54% |
| 2026-10-27 00:00 | CCI < −100 | 100.13 | +1.86% | −4.50% |
| 2026-10-28 04:00 | CCI > 100 | 102.31 | −2.54% | −6.54% |
| 2026-10-28 16:00 | CCI > 100 | 103.02 | −3.15% | −7.18% |
| 2026-10-29 04:00 | CCI < −100 | 99.71 | −4.10% | −4.10% |
| 2026-10-29 20:00 | CCI < −100 | 95.62 | — | — |
Counting every signal that had a complete six-bar forward window — 20 of the 21 — price moved in the direction the signal implied (higher after a +100 cross, lower after a −100 cross) in 13 cases. That sounds respectable until you look at magnitudes: several of the "correct" outcomes were moves of 0.05% to 0.45%, which is noise at 4-hour resolution and would not survive fees and spread.
The last nine signals are more honest about the difficulty. Only five of the nine continued in the signal direction after six bars. The two +100 crosses on 2026-10-28, at 102.31 and 103.02, were followed by declines of 2.54% and 3.15% within a day and 6.54% and 7.18% within three days — textbook false breakouts into a market that was rolling over. Meanwhile the −100 cross on 2026-10-27 at 100.13 bounced 1.86% in a day before giving back 4.50% over three.
The close of the window makes the unbounded nature of CCI concrete. On the final bar, price was 95.62 and CCI 20 read −299.76 — roughly 4.5 mean deviations below the 20-bar average. Anyone who had faded the six −100 crosses listed above at 103.58, 102.79, 101.25, 100.18, 100.13 and 99.71 as "oversold" would have been adding into a market that kept falling. Mixed results, with the clearest lesson being that the band crossings clustered during a decline rather than marking its end.
Common mistakes
- Treating ±100 as overbought/oversold. Lambert designed those lines to mark the start of unusual moves. In the example above, the −100 crosses chained together all the way down to −299.76.
- Ignoring regime. The same signal has opposite meaning in a trend and a range. Decide what the market is doing — using price structure, a long moving average or ADX — before deciding how to interpret the line.
- Trading every cross. Twenty-one signals in a single month on one 4-hour chart is a signal every day and a half. Fee drag alone destroys an edge that averages a few tenths of a percent.
- Shortening the period to get more signals. Faster CCI does not mean better CCI; it means a smaller mean deviation, more crosses and a lower share of them that matter.
- Reading divergence in chop. Divergences only carry information when there are clean, comparable swings to compare.
- Forgetting leverage math. On perpetual futures, a −100 reading that resolves with a 7% adverse move over three days is routine. At 10x that is most of the margin, and liquidation does not care that the signal was eventually right.
Combining it with other tools
CCI is a momentum measure, so pair it with something that measures a different dimension. A structural trend filter — a 200-period moving average, higher-timeframe market structure, or the slope of a longer CCI — tells you whether to read band crosses as continuation or exhaustion.
Volatility tools complement it well. Because CCI's denominator is average deviation, it often reaches extremes at the same time Bollinger Bands expand or ATR spikes. When both agree that the move is an outlier, the reading is at least internally consistent; when CCI is extreme but ATR is flat, the "extreme" may just be a quiet-market artifact of a tiny denominator.
Level-based context matters more than any second oscillator. A −300 CCI reading into a well-tested support band is a different situation from the same reading in mid-air. Volume profile, prior swing highs and lows, and visible liquidity clusters all give the oscillator somewhere to mean-revert to.
Avoid stacking CCI with RSI, stochastics and Williams %R at once. They are highly correlated by construction, and four versions of the same information create the illusion of confirmation.
Frequently asked questions
Q. What is the best CCI setting for crypto?
There is no universally best setting. CCI 20 on 4-hour or daily candles is a reasonable starting point because it follows Lambert's one-third-of-a-cycle logic and gives a workable signal rate; faster settings like CCI 14 suit intraday work at the cost of more false crosses. Test any setting across both trending and ranging windows before relying on it, since crypto's 24/7 schedule and volatility clustering change signal frequency dramatically between regimes.
Q. Is CCI above 100 overbought?
Not in the way most people mean. Lambert chose the 0.015 constant so that roughly 70–80% of readings fall inside ±100, which makes +100 the edge of normal variation and, in his original method, a signal that a new up move may be starting. In a strong trend CCI can hold above +100 for many bars, so a reading above the band on its own says the move is unusual, not that it is finished.
Q. What is the difference between CCI and RSI?
RSI is bounded between 0 and 100 and compares average gains with average losses, while CCI is unbounded and measures distance from a moving average scaled by average deviation. That makes RSI better behaved for fixed thresholds and CCI better at flagging genuine volatility outliers. They often move together, so using both adds less independent information than most traders assume.
Q. Why does CCI use 0.015 and the typical price?
The typical price — (high + low + close) / 3 — includes the whole bar's range rather than just the close, which Lambert considered a fairer representation of where trading occurred. The 0.015 constant is a scaling factor chosen so that the majority of readings land inside the ±100 band, turning an abstract deviation ratio into numbers that are easy to interpret at a glance.
Q. Does CCI work on all timeframes?
The formula works on any timeframe, but signal quality varies. On very low timeframes in crypto, the mean deviation is small and dominated by microstructure noise, so band crosses multiply without carrying much information; on daily and weekly charts, signals are rarer and tend to align better with real swings. Match the lookback to the swing length you actually trade.
Q. What does a CCI reading of −300 mean?
It means the typical price sits roughly 4.5 mean deviations below its 20-bar average — a statistical outlier. That can mark capitulation near the end of a move or simply describe the middle of a fast decline, as it did on the final bar of the SOL example, where CCI read −299.76 at a price of 95.62 after a string of earlier −100 crosses had already failed to mark a bottom.
Key takeaways
- CCI measures how far the typical price has strayed from its own moving average, divided by average deviation and scaled by 0.015 so that ±100 marks the edge of normal variation.
- Donald Lambert published it in Commodities magazine in 1980 as a cycle-timing tool, and his original rules treated a cross above +100 as the beginning of a move, not an overbought warning.
- Because the indicator is unbounded, extreme readings can get far more extreme — the SOL window ended at −299.76 after six earlier −100 crosses on the way down, within 21 band crossings in a single month.
- Regime decides interpretation: band crosses are continuation signals in trends and whipsaws in ranges, so pair CCI with a structural trend filter and real price levels.
- In the example, 13 of 20 completed signals moved in the implied direction after six bars, but many of those moves were a fraction of a percent — one month on one market, and not evidence of an edge.
Educational material. Charts use real SOL/USDT perpetual prices; past behaviour does not predict future results. Not investment advice.