Indicator & technique library · Indicator library
ADX Indicator Explained: DMI, Formula and Trend Strength
At a glance
- ADX measures how strongly a market is trending, not whether it is going up or down; direction comes from the +DI and -DI lines.
- J. Welles Wilder Jr. published the Directional Movement system, including ADX, in New Concepts in Technical Trading Systems (1978).
- The standard setting is 14 periods with a 20-25 threshold separating a trending regime from a choppy one.
- ADX is a smoothed, lagging measure: it confirms a trend that already exists and says nothing about where price is headed next.
ADX (Average Directional Index) answers one question that most indicators ignore: is this market trending at all? It does not tell you whether price is going up or down. It tells you whether the current move has enough directional persistence to be called a trend, or whether buyers and sellers are simply trading the same range back and forth.
ADX never travels alone. It is the summary line of a three-line system called DMI (Directional Movement Index), where +DI tracks upward pressure and -DI tracks downward pressure. Traders care about it because most strategies are regime-dependent: trend-following tools bleed money in ranges, and mean-reversion tools get run over in trends. ADX is one of the few classic indicators built specifically to label the regime.
What is ADX and DMI (trend strength)?
DMI is a set of two lines derived from how far each bar extends beyond the previous bar's range. The Plus Directional Indicator (+DI) measures the average size of upward range expansion; the Minus Directional Indicator (-DI) measures the average size of downward range expansion. Both are normalized by the Average True Range, so they are comparable across assets and volatility levels.
ADX is built on top of those two lines. It takes the spread between +DI and -DI, expresses it as a percentage of their sum, and smooths the result. When one side dominates for a sustained period, the spread stays wide and ADX rises. When the two sides keep swapping leadership, the spread collapses and ADX falls.
The critical consequence: ADX is non-directional. An ADX of 40 can describe a violent rally or a waterfall decline. You read direction from which DI line is on top, never from ADX itself.
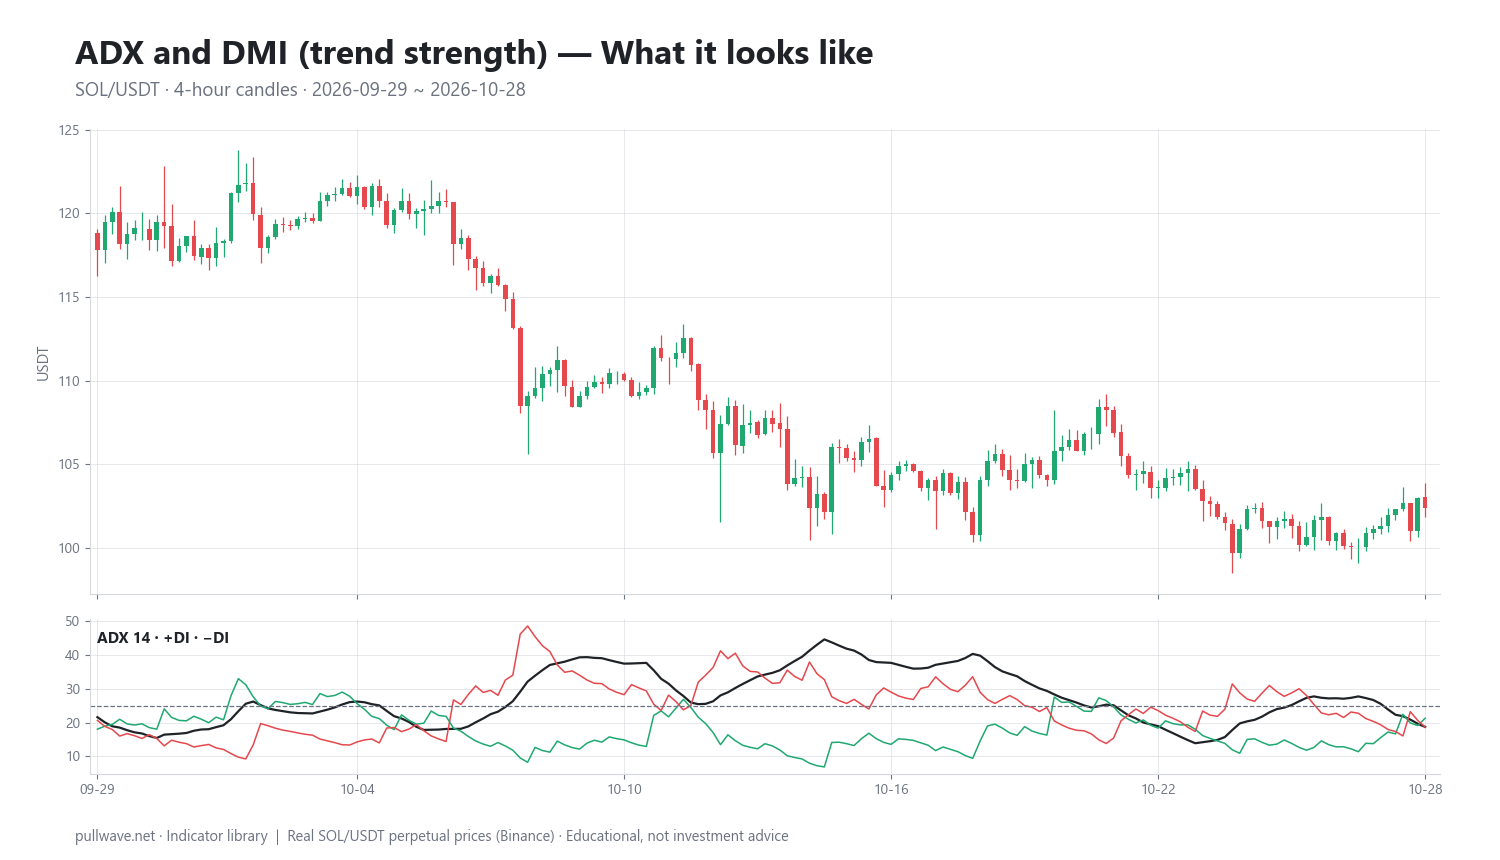
Figure 1 shows the indicator drawn under real SOL/USDT 4-hour candles: the +DI and -DI lines crossing and separating in the lower panel, with the smoother ADX line rising when one of them pulls clearly away from the other and sagging when they converge.
The idea behind it (theory and history)
The Directional Movement system was created by J. Welles Wilder Jr., a mechanical engineer turned trader, and published in his 1978 book New Concepts in Technical Trading Systems. The same book introduced RSI, Average True Range, and the Parabolic SAR — an unusually productive 130 pages that still shape default indicator menus almost fifty years later.
Wilder's underlying idea is mechanical rather than psychological. He defined "directional movement" as the part of today's range that lies outside yesterday's range. If today's high exceeds yesterday's high by more than today's low undercuts yesterday's low, the bar contributed upward directional movement, and vice versa. Range expansion in one direction, repeated over many bars, is his operational definition of a trend.
Normalizing by True Range was the second key choice. Raw point moves mean nothing across different instruments or volatility regimes — a 2-point move is enormous in one market and noise in another. By dividing directional movement by true range, Wilder produced bounded 0-100 lines that behave similarly on a quiet forex pair and on a 24/7 crypto perpetual.
ADX itself came last: a measure of how one-sided the directional movement has been, smoothed twice so that it responds to regime change rather than to individual bars. The double smoothing is why ADX is slow — that is a design feature, not a flaw.
How it is calculated
Step by step, for each bar:
- Measure raw directional movement. UpMove = current high − previous high. DownMove = previous low − current low.
- Keep only the dominant side. If UpMove > DownMove and UpMove > 0, then +DM = UpMove, otherwise +DM = 0. If DownMove > UpMove and DownMove > 0, then -DM = DownMove, otherwise -DM = 0. An inside bar produces zero on both sides.
- Compute True Range. TR = the largest of (high − low), |high − previous close|, |low − previous close|.
- Smooth all three series over 14 periods using Wilder's smoothing (a running total, not a simple average): new = prior − (prior / 14) + current. The first value is the sum of the first 14 readings.
- Build the DI lines. +DI = 100 × (smoothed +DM / smoothed TR). -DI = 100 × (smoothed -DM / smoothed TR).
- Compute the directional index. DX = 100 × |+DI − -DI| / (+DI + -DI).
- Smooth DX into ADX. The first ADX is the simple average of the first 14 DX values; afterwards ADX = ((prior ADX × 13) + current DX) / 14.
``` +DM = High - High[1] if > (Low[1]-Low) and > 0, else 0 -DM = Low[1] - Low if > (High-High[1]) and > 0, else 0 TR = max(High-Low, |High-Close[1]|, |Low-Close[1]|)
+DI14 = 100 * Wilder(+DM,14) / Wilder(TR,14) -DI14 = 100 * Wilder(-DM,14) / Wilder(TR,14)
DX = 100 * |+DI14 - -DI14| / (+DI14 + -DI14) ADX = Wilder(DX, 14) // first value = SMA of first 14 DX ```
Because of the two smoothing stages, ADX needs roughly 2 × 14 ≈ 28 bars before it is meaningful, and often more before it stabilizes. On a fresh chart or a newly listed token, the first ADX values are an artifact of the warm-up, not a signal.
Default settings and variations
| Setting | Typical value | Why |
|---|---|---|
| Period | 14 | Wilder's standard length across RSI, ATR and DMI; roughly half a natural monthly cycle on daily data |
| Trend threshold | 20 or 25 | Below it, the DI spread is too narrow to call a trend |
| Strong trend | 40-50 | Rarely sustained; often marks maturity, not the start |
| Smoothing | Wilder (RMA) | Equivalent to an EMA with alpha = 1/14 |
Wilder used 14 periods throughout his work because, on the daily charts he traded, it approximated half of a typical market cycle — long enough to average out single-bar noise, short enough to react within a swing. There is nothing magic about it, and he said as much; it is a round, workable compromise.
Common variations: shortening to 7-10 for faster regime detection (more whipsaw, more false trend calls), lengthening to 20-28 for position trading (fewer signals, later), or decoupling the DI length from the ADX smoothing length, which some platforms expose as two separate inputs. Some traders replace the fixed 25 threshold with a rolling percentile of ADX over the last few hundred bars, which adapts to assets that structurally run hotter or colder.
For crypto specifically: the 4-hour and daily charts are where ADX behaves most like it does in Wilder's original markets. On 1-minute and 5-minute crypto charts, microstructure noise and liquidation cascades push ADX around so fast that the threshold loses meaning.
How to read it
Read the chart in two passes. First, look only at ADX: rising means the current directional pressure is strengthening; falling means it is dissipating, regardless of which way price is moving. A falling ADX during a rally does not predict a reversal — it says the rally is becoming less one-sided.
Second, look at the DI lines for direction. +DI above -DI means upward range expansion has dominated the last 14 bars; -DI above +DI means the opposite. The gap between them is what feeds ADX, so wide separation plus rising ADX is the classic trending configuration.
Rough interpretation bands, which should be treated as conventions rather than laws:
- Below 20: range, consolidation, no usable trend.
- 20-25: transition zone; a trend may be forming or decaying.
- 25-40: a healthy trend is present.
- Above 40-50: a strong, often late-stage trend.
- Above 60: rare, usually unsustainable, frequently followed by consolidation.
How traders use it
1. As a regime filter. The most defensible use. Only allow trend-following entries (breakouts, moving-average pullbacks) when ADX is above the threshold and rising; only allow range tactics (fading the edges of a box, mean reversion) when ADX is below 20. Works when the asset alternates between clearly defined regimes. Fails in markets that trend gently without ever lifting ADX above 25, and during sharp one-bar spikes that resolve immediately.
2. DI crossovers for direction. A +DI cross above -DI is read as upward pressure taking over, confirmed when ADX is above the threshold. Works at the start of extended swings. Fails badly in chop, where DI lines cross repeatedly; the crossover on its own is one of the noisiest signals in the Wilder toolkit, which is why the ADX confirmation exists.
3. ADX crossing above the threshold as a trend-start alert. Treated as "a trend may now be underway, check direction with the DI lines." Works when it coincides with a structural breakout. Fails when the threshold cross happens after most of the move is finished — ADX is doubly smoothed and therefore late by construction.
4. Peaking ADX as an exhaustion warning. When ADX turns down from above 40, trend-followers often tighten stops or reduce size rather than reverse. Works as a position-management input. Fails as a reversal signal: trends routinely pause, ADX falls, and the trend resumes.
In crypto perpetuals, the regime-filter use matters more than elsewhere. Leverage amplifies the cost of being in a trend-following position during a range: funding payments accumulate, stops get hunted in both directions, and liquidation risk rises because the stop that respects a range is usually tighter than the volatility the market delivers.
Example on a real SOL chart
The window below is SOL/USDT perpetual on Binance, 4-hour candles, from 2026-09-29 to 2026-10-28, using ADX 14 with +DI/-DI and a threshold of 25. This is one market over one month — an illustration of how the readings looked, not evidence that the indicator works.
Over that window, ADX spent 56.7% of the time above 25, which marks it as a fairly directional month by ADX standards. The last close was 102.38, with ADX finishing at 18.7 — back below the threshold, i.e. the system ended the window saying "no strong trend right now."
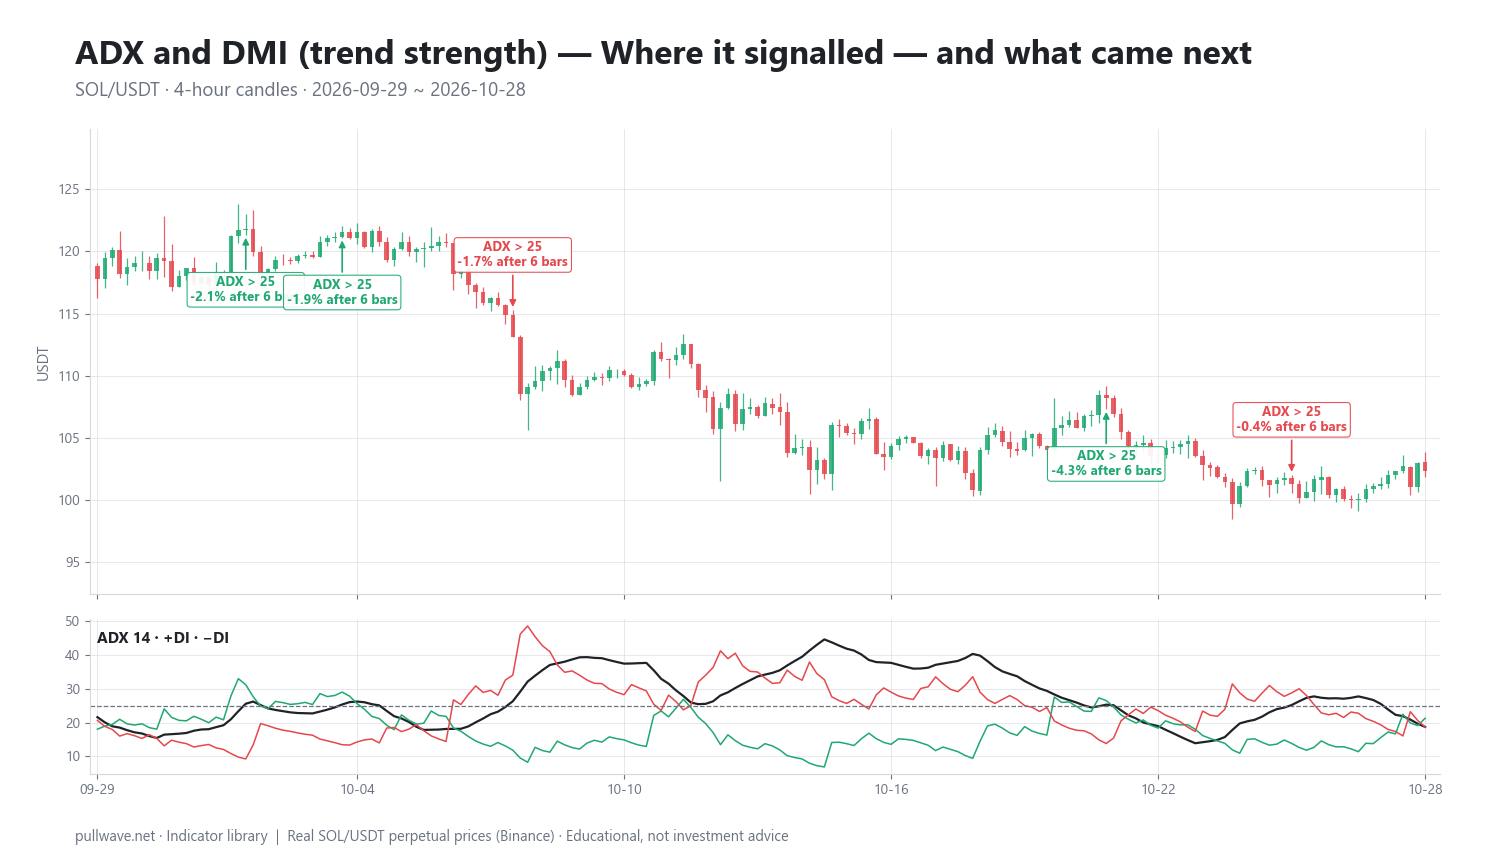
There were 5 bars where ADX crossed above 25. Measured 6 bars and 18 bars later:
| Date (UTC) | Price at signal | After 6 bars | After 18 bars |
|---|---|---|---|
| 2026-10-02 08:00 | 121.80 | -2.09% | -0.86% |
| 2026-10-04 12:00 | 121.53 | -1.85% | -3.96% |
| 2026-10-08 08:00 | 113.13 | -1.69% | -3.15% |
| 2026-10-21 16:00 | 108.25 | -4.31% | -6.60% |
| 2026-10-25 20:00 | 101.34 | -0.42% | +1.03% |
Figure 2 marks each of these five bars on the same chart with the subsequent move attached. Judged against the direction the DI lines indicated at each cross, only 2 of the 5 signals moved in the signalled direction over the measured horizons — a mixed result, and worth stating plainly.
Two honest observations. First, price drifted from roughly 121.80 down to 102.38 across the window, so a down-biased market produced consistently negative forward returns; an indicator that happened to be bearish would look good here for reasons that have nothing to do with its logic. Second, five signals is far too small a sample to conclude anything. A month of 4-hour data on a single asset can only show you what the readings looked like, not whether the tool has an edge.
Common mistakes
- Reading ADX as directional. A high ADX in a downtrend is not bullish strength. Direction comes only from +DI versus -DI.
- Expecting it to be early. Double smoothing guarantees lag. ADX crossing 25 confirms a move that is already visible on the price chart.
- Trading DI crossovers without the ADX filter. In a range, the DI lines cross constantly. That is the single most common way traders lose money with this indicator.
- Treating a falling ADX as a reversal signal. It signals weakening directional pressure, which is just as consistent with a sideways pause as with a turn.
- Using it on very low timeframes in crypto. Below roughly 15 minutes, noise dominates and the thresholds stop separating regimes.
- Ignoring the warm-up period. The first ~28 bars after a listing or a data gap are unreliable.
Combining it with other tools
ADX pairs naturally with anything that needs a regime label. A moving-average crossover system, for instance, produces most of its losses in ranges; requiring ADX above the threshold before acting on a crossover removes a portion of those, at the cost of missing the earliest part of some trends.
It also complements oscillators in the opposite direction. RSI or Stochastic overbought/oversold readings are far more meaningful when ADX is low, because that is when mean reversion dominates. When ADX is high, the same overbought reading usually just means the trend is working, and fading it is how traders get hurt.
Structure-based tools fit well too: horizontal support and resistance, trendlines, or volume profile define where, while ADX comments on whether the market is in the mood to follow through. Volatility measures such as ATR or Bollinger Band width answer a related but separate question — ATR measures how far price moves, ADX measures how consistently it moves one way. A market can be highly volatile with a low ADX (wide, choppy swings) or quietly persistent with a high one.
Whatever the combination, avoid stacking tools that measure the same thing. ADX, DMI and a directional moving-average slope are largely redundant; adding all three creates the illusion of confirmation rather than real independent information.
Frequently asked questions
Q. What does the ADX indicator actually measure?
ADX measures trend strength — how consistently one side of the market has dominated range expansion over the lookback period — on a scale of roughly 0 to 100. It does not indicate direction. Direction is read from the two accompanying DMI lines, +DI and -DI, where the line on top shows which side is currently dominant.
Q. What is a good ADX level for a trend?
The conventional threshold is 25, with some traders using 20 for a slightly earlier signal. Readings below 20 are generally treated as range conditions, 25-40 as a usable trend, and above 40 as a strong but often late-stage trend. These are conventions from Wilder's era, not statistical constants, and are worth checking against the specific market and timeframe you trade.
Q. What is the best ADX setting for crypto?
Most crypto traders keep Wilder's 14-period default and apply it to 4-hour or daily charts, where the smoothing has enough bars to be meaningful. Shorter periods like 7-10 react faster but generate many more false trend calls in a 24/7 market that never gaps out of chop. There is no setting that works across all assets and regimes, so treat any choice as a trade-off between speed and reliability.
Q. Is ADX a leading or lagging indicator?
ADX is firmly lagging. It applies Wilder smoothing twice — once to the directional movement and true range series, once to the DX values — so it confirms trends that are already underway rather than anticipating them. Its value is in classifying the current regime, not in forecasting the next move.
Q. What is the difference between ADX and DMI?
DMI is the full system of two directional lines, +DI and -DI, that show upward and downward pressure. ADX is a single derived line that measures how far apart those two lines are, smoothed over time. In practice they are plotted together in one panel, and ADX is meaningless without the DI lines to supply direction.
Q. Can ADX be used on its own as a trading system?
Not realistically. ADX provides no entry level, no stop placement and no direction by itself, and its signals lag price. It is best used as a filter on top of a method that already defines where to act — a breakout level, a moving-average system, or a support/resistance structure — and alongside explicit risk limits, which matter more on leveraged perpetuals than any indicator setting.
Key takeaways
- ADX quantifies trend strength only; +DI and -DI supply direction, and confusing the two is the most common error with this indicator.
- Wilder published the Directional Movement system in New Concepts in Technical Trading Systems (1978); the 14-period default and the 20-25 threshold are conventions from that work, not optimized constants.
- Because DX is smoothed on top of already-smoothed DI lines, ADX is structurally late — useful for labelling a regime, unreliable as a timing trigger.
- In the SOL/USDT 4-hour window shown, ADX was above 25 for 56.7% of the time, produced 5 threshold crosses, and only 2 of 5 moved in the signalled direction over the measured horizons — a mixed, very small sample on a declining market.
- Its best use is as a filter: enable trend-following logic when ADX is elevated and rising, favor range logic when it is flat and below 20, and let price structure and risk management make the actual decisions.
Educational material. Charts use real SOL/USDT perpetual prices; past behaviour does not predict future results. Not investment advice.