Indicator & technique library · Indicator library
Fibonacci Retracement Explained: Levels, Math and Uses
At a glance
- Fibonacci retracement is a grid of horizontal levels placed between a swing high and a swing low to mark where a pullback may pause.
- The ratios 0.236, 0.382, 0.618 and 0.786 come from the Fibonacci sequence; 0.5 is added by convention and is not a Fibonacci ratio.
- It is a drawing tool, not a signal generator: the levels depend entirely on which swing you anchor it to.
- Levels tend to be most useful inside a clear trend and least useful in choppy, newsy, range-bound conditions.
Fibonacci retracement is a drawing tool, not a calculated indicator. You pick one price swing — a move from a low to a high, or from a high to a low — and the tool divides that range with horizontal lines at fixed percentages: 23.6%, 38.2%, 50%, 61.8% and 78.6%. Those lines are candidate areas where a pullback against the move might stall.
Traders care about it because pullbacks are where most of the practical decisions happen. A trend rarely moves in a straight line, and the hard question is always "how deep is this pullback allowed to go before the move is in trouble?" Fibonacci retracement gives you a shared, reproducible map for answering that question — shared being the operative word, because a large number of market participants look at the same levels on the same obvious swings.
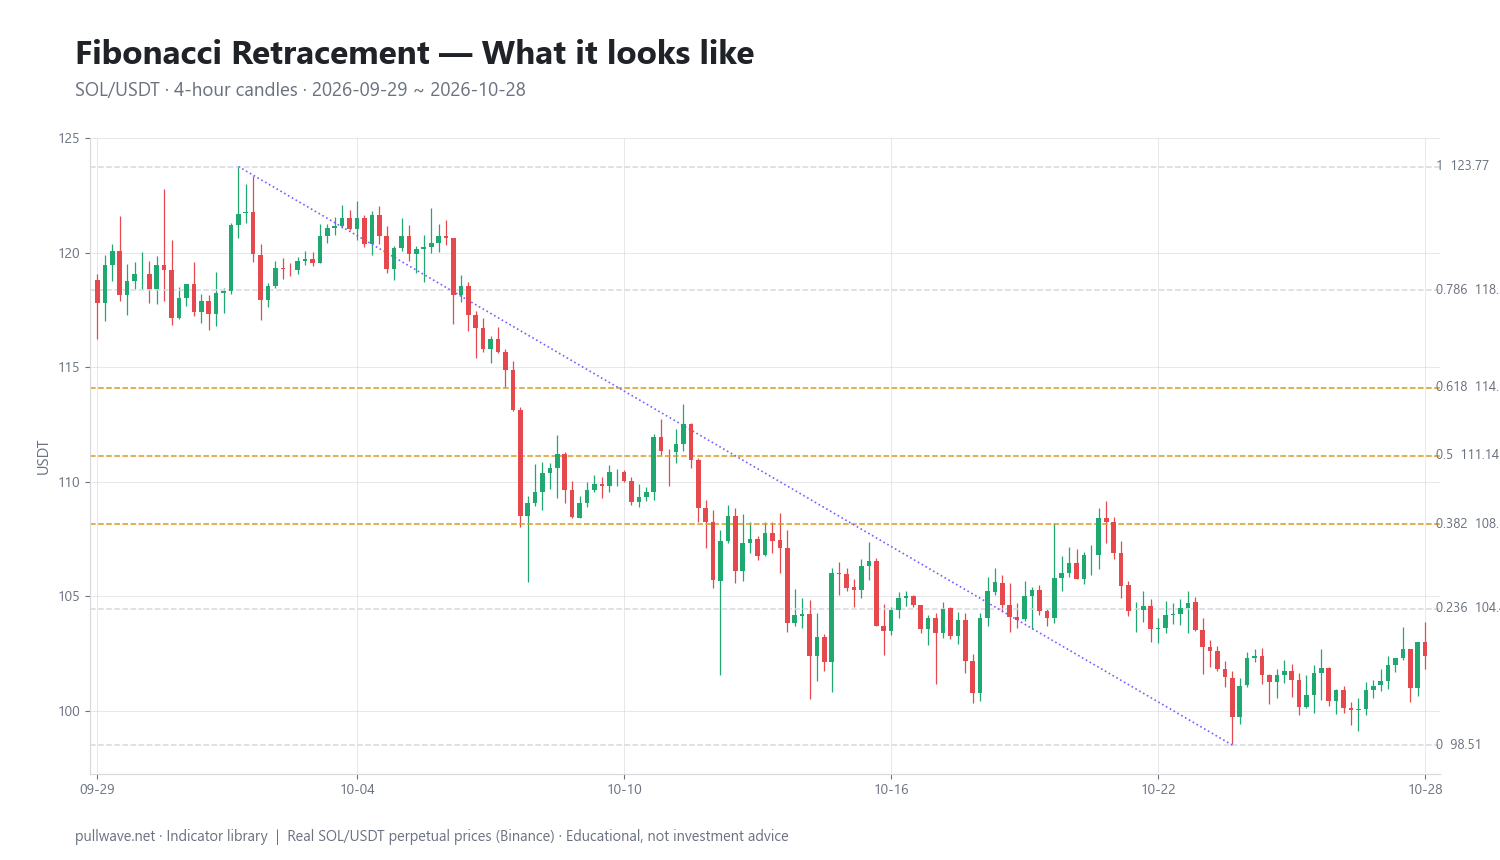
Figure 1 shows the tool drawn on real SOL/USDT perpetual candles on the 4-hour chart, anchored to the swing high and swing low of the window. The horizontal bands are the retracement levels; the candles show where price actually interacted with them.
What is Fibonacci Retracement?
Fibonacci retracement is a set of horizontal reference levels drawn between two chosen price points — normally a significant swing high and a significant swing low. Each level sits at a fixed proportion of the distance between those two anchors.
The tool measures how much of a prior move has been given back. If a coin rallies from 100 to 200 and then falls to 150, it has retraced 50% of the advance. Fibonacci retracement just pre-draws those percentage marks so you can see them before price gets there.
Two things follow from that definition, and both matter more than any single level:
- The output is entirely determined by your two anchor points. Different swing selection, different levels. There is no "correct" answer computed from data the way an RSI value is.
- It is a context tool. It tells you where you are inside a move. It does not tell you whether the move will continue.
The idea behind it (theory and history)
The number sequence is genuinely old. Leonardo of Pisa, known as Fibonacci, presented it to European readers in Liber Abaci (1202), using the famous rabbit-population problem. The sequence — 1, 1, 2, 3, 5, 8, 13, 21, 34, 55, 89… — has each term equal to the sum of the two before it. Versions of the sequence appear earlier in Indian mathematics (Pingala, Virahanka, Hemachandra), so Fibonacci popularized rather than invented it.
The interesting property for traders is the ratios between terms. Divide any term by the next one and the result converges on 0.6180…, the inverse of the golden ratio φ (1.6180…). Skip one term and you converge on 0.382. Skip two and you get 0.236.
The bridge into markets runs mainly through Ralph Nelson Elliott. Elliott developed his wave theory in the 1930s and, in Nature's Law — The Secret of the Universe (1946), tied the proportions of his waves to the Fibonacci sequence. Elliott's work was later systematized and popularized by A.J. Frost and Robert Prechter in Elliott Wave Principle (1978), which is where many modern traders first met retracement ratios. Separately, W.D. Gann worked with proportional retracements of a range, though Gann's divisions were eighths (12.5%, 25%, 37.5%, 50%…), not Fibonacci ratios — the two traditions are often blurred together, and they shouldn't be.
The honest version of the theory is modest. There is no robust evidence that markets obey the golden ratio as a law of nature. What is defensible is simpler: markets move in impulses and corrections; corrections tend to retrace a meaningful but partial fraction of the impulse; a small set of round-ish fractions (roughly a quarter, a third-plus, a half, two-thirds) covers most of that behavior; and because the tool is standard on every charting platform, a lot of orders cluster at the same marks. That last point — reflexivity — probably does more work than the mathematics.
How it is calculated
The arithmetic is trivial; the judgment is in the anchors.
Step by step:
- Identify the swing you want to measure — a clear impulsive move with an obvious start and end.
- Record the swing high and the swing low of that move.
- Subtract to get the range:
range = high − low. - Multiply the range by each ratio.
- Measure from the end of the move back toward its start. For an up swing, subtract from the high. For a down swing, add to the low.
``` range = swing_high − swing_low
Up swing (low → high): level = swing_high − range × ratio Down swing (high → low): level = swing_low + range × ratio
ratios = 0.236, 0.382, 0.5, 0.618, 0.786 ```
By convention the 0% line sits at the end of the move (the most recent extreme) and the 100% line at its start. A "61.8% retracement" therefore means price has given back 61.8% of the move and only 38.2% of it remains intact.
Where the ratios come from:
| Level | Derivation | Note |
|---|---|---|
| 0.236 | Fₙ / Fₙ₊₃ ≈ 0.618³ | Shallow pullback, strong trends |
| 0.382 | Fₙ / Fₙ₊₂ ≈ 0.618² | Common in healthy trends |
| 0.500 | Half the range | Not a Fibonacci ratio |
| 0.618 | Fₙ / Fₙ₊₁ (golden ratio inverse) | The most watched level |
| 0.786 | √0.618 | Deep retracement, last stand |
Default settings and variations
There is only one real "setting": which swing you anchor to. Everything else is which lines you choose to display.
- The standard set — 0.236, 0.382, 0.5, 0.618, 0.786, plus 0 and 1. This is the default on most platforms.
- 0.5 is included because traders use it, not because it is Fibonacci. Half of a move is a natural psychological division and it has been part of retracement analysis since long before Elliott.
- 0.886 (√0.786) is added by harmonic-pattern traders, a framework formalized by Scott Carney in The Harmonic Trader (1998).
- 0.618 and 0.65–0.66 are sometimes used interchangeably; the difference is usually smaller than normal spread and slippage, which is a hint about how precise this tool really is.
- Extensions (1.272, 1.414, 1.618, 2.618) use the same anchors but project beyond the move for targets rather than pullbacks.
A practical rule: fewer lines is better. If you display eight levels across a range, price will touch something no matter what it does, and you will have told yourself nothing. Many experienced users keep only 0.382, 0.5 and 0.618 — the "golden pocket" between 0.618 and 0.65 is a common shorthand for the deep end of that zone.
Timeframe matters more than level selection. A retracement grid drawn on a 1-minute chart in crypto describes noise. Daily and 4-hour swings in crypto, and weekly swings for position work, produce anchors that more participants can actually see.
How to read it
Read the grid as a depth gauge for the correction, not as a set of walls.
- Shallow (0–0.382): the dominant move is being defended aggressively. Pullbacks that stall near 0.236 or 0.382 are typical of strong, one-directional phases.
- Middle (0.382–0.618): the normal, healthy correction zone. Most continuation setups that people talk about live here.
- Deep (0.618–0.786): the move is being seriously questioned. It can still resume, but the risk that the prior swing was the end of the trend rises materially.
- Beyond 0.786 / through 1.0: the swing has effectively been invalidated as an impulse. A full retracement means the original move is now just a range boundary.
What you want to see at a level is reaction, not arrival. Price touching 0.618 proves nothing. Price touching 0.618, rejecting with a long wick on rising volume, and then forming a higher low above it is information.
How traders use it
1. Locating pullback entries inside a trend. The most common use. In an established uptrend, traders watch the 0.382–0.618 band for signs that the correction is ending. Works when the trend structure is clean and the swing is unambiguous. Fails in ranges, where price oscillates through every level without respecting any of them, and in violent news-driven moves that ignore structure entirely.
2. Placing invalidation levels. If a setup depends on the prior swing remaining intact, the swing extreme (the 1.0 line) or the 0.786 line is a logical place for the idea to be wrong. Works because it is structural rather than arbitrary. Fails when the resulting stop distance is so large that correct position sizing makes the trade pointless — a real problem on leveraged perpetuals.
3. Confluence mapping. Drawing retracements from two or three different swings (for example, the daily impulse and the 4-hour sub-wave) and looking for places where levels cluster, ideally with a prior support/resistance shelf, a moving average or a volume node. Works because it filters out the many levels that nothing else confirms. Fails when it becomes curve-fitting: with enough swings you can manufacture confluence anywhere.
4. Measuring trend health over time. Tracking how deep successive corrections go. A sequence of 0.236 and 0.382 pullbacks that suddenly becomes a 0.786 pullback is a change in character worth noting, regardless of whether you trade it. Works as a slow regime signal. Fails as a timing tool — character changes are visible mostly in hindsight.
Example on a real SOL chart
The window is 29 September to 28 October 2026 on SOL/USDT perpetual (Binance), 4-hour candles. Over this stretch the dominant swing was down: a high of 123.77 on 2 October and a low of 98.51 on 24 October, a range of 25.26.
Anchoring the tool to that down swing — 0% at the low, 100% at the high — produces this grid:
| Level | Price |
|---|---|
| 0 (swing low) | 98.51 |
| 0.236 | 104.47 |
| 0.382 | 108.16 |
| 0.5 | 111.14 |
| 0.618 | 114.12 |
| 0.786 | 118.36 |
| 1.0 (swing high) | 123.77 |
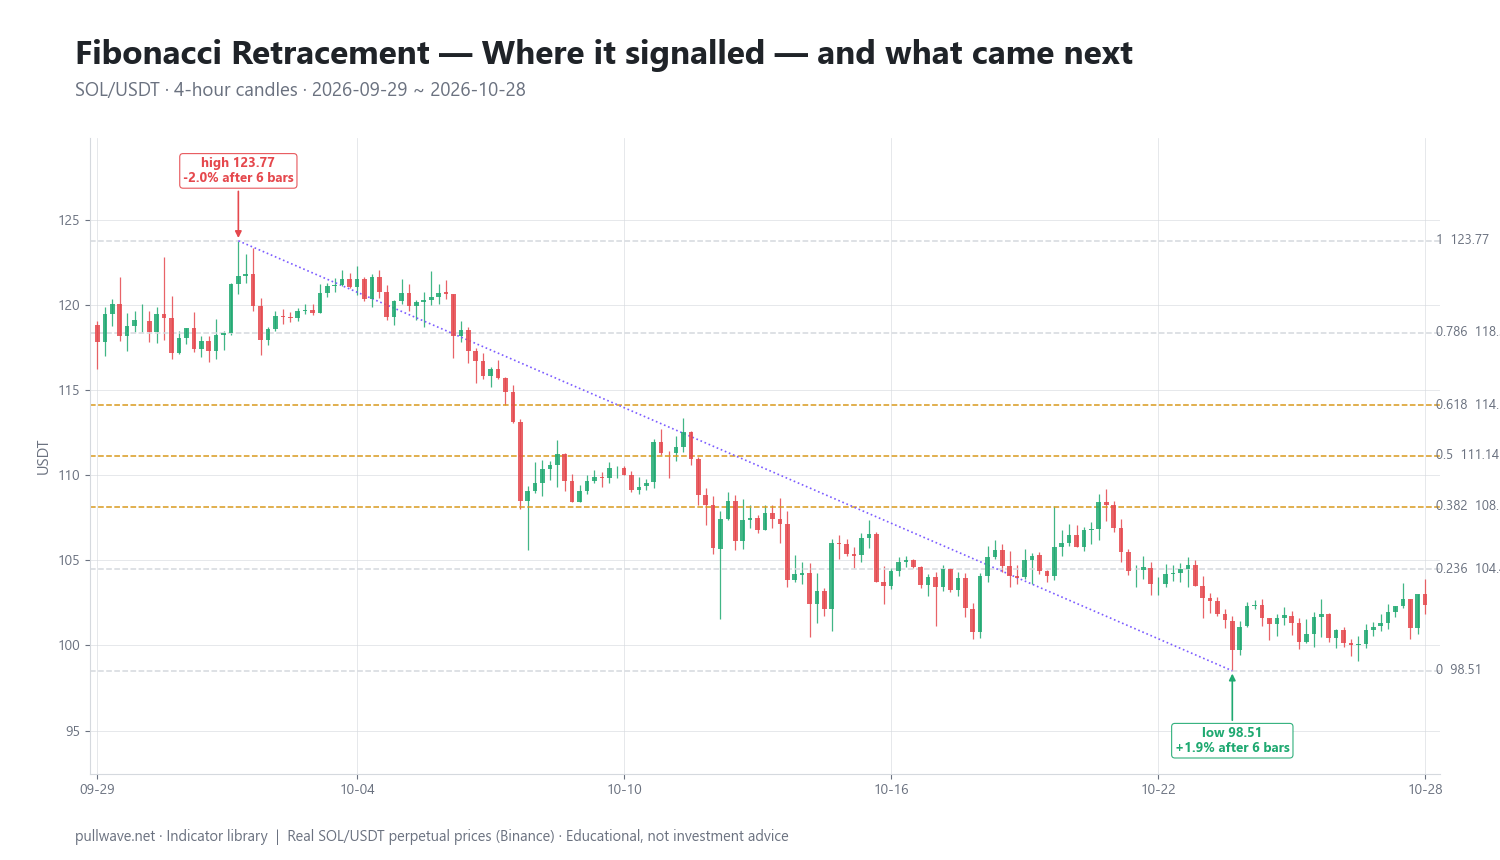
Figure 2 marks the two swing anchors and the percentage move that followed each one over the two horizons used here: 6 bars (one day on a 4-hour chart) and 18 bars (three days).
The first marked point is the high region on 2 October 2026, 04:00 UTC, with the candle reference price at 121.71 and the swing extreme at 123.77. Over the next 6 bars price was −2.0%; over 18 bars it was −0.05% — essentially flat. So the turn from the high did produce immediate downside, but the follow-through stalled within three days. A trader who treated the swing high as the start of a clean, sustained decline would have been right for about a day and then sat in noise.
The second marked point is the low region on 24 October 2026, 12:00 UTC, reference price 99.72, swing extreme 98.51. Over the next 6 bars price was +1.88%, and over 18 bars +1.2%. Again: a real bounce, then fading momentum.
By the end of the window the last close was 102.38. That is above the swing low but still below the shallowest retracement level at 104.47 — the bounce had not yet reached even the 23.6% mark. That is the most useful observation in the whole example, and it has nothing to do with a level being "hit." It says the counter-move was weak relative to the decline that preceded it, which is exactly the kind of read the grid is designed to support.
Two events, one market, one month, two horizons, with both post-event moves going in the direction of the swing turn (2/2). That is an illustration, not evidence. Two observations cannot distinguish a useful tool from a coin flip, and both moves were small — around 1–2% — which on a leveraged perpetual is well inside the range where funding, fees and a single liquidation cascade dominate the outcome. Treat the chart as a demonstration of how to read the tool, nothing more.
Common mistakes
- Fitting the anchors to the conclusion you already have. If you have to try four swings to find levels that support your idea, the levels are decoration.
- Using wicks or bodies inconsistently. Pick one convention (most people use the absolute extreme wick) and keep it. Crypto wicks can be enormous, and switching conventions changes every level.
- Treating a level as a line rather than a zone. In a 24/7 market with no opening auction, expect overshoots. A level is a neighborhood, typically widened by recent average true range.
- Drawing on micro swings. Retracements of a 0.4% move on a 5-minute chart are inside the noise floor.
- Ignoring the regime. In a sideways market, every level gets hit from both directions. The tool assumes there was an impulse worth retracing.
- Confusing a touch with a reaction. No confirmation, no information.
- Over-leveraging because the level "gives a tight stop." Tight invalidation is only an advantage if position size stays sane. On perpetuals, a stop a few percent away plus high leverage puts your liquidation price inside normal volatility.
Combining it with other tools
Fibonacci retracement produces locations. It produces no timing and no momentum information, so it pairs naturally with tools that do.
- Market structure and prior swing levels. A retracement level that lands on an old high, an old low or a clear consolidation shelf is worth far more than one floating in empty space.
- Volume profile. A high-volume node overlapping the 0.5–0.618 band marks a price where real business was done, which is a better reason for a reaction than a ratio.
- Moving averages. A 50- or 200-period moving average drifting into the same zone as a retracement level is a common confluence setup, particularly on daily crypto charts.
- Momentum oscillators (RSI, MACD). Use them for confirmation of the reaction, not the location — for example, bullish divergence forming while price tests the deep end of the grid.
- Fibonacci extensions and prior range boundaries. For the other half of the problem: where the continuation might run out of fuel.
- Funding rates and open interest on perpetuals. Crypto-specific context. A deep retracement reached while funding is extremely positive and open interest is at highs often resolves differently than the same level reached after a flush.
The principle is independence. Three tools that all measure trend direction are one tool with extra steps. Location, participation and momentum are three different questions.
Frequently asked questions
Q. Which Fibonacci retracement levels are most important?
The 0.618 level (the golden ratio inverse) and the 0.5 level attract the most attention, with 0.382 close behind in strong trends. In practice the 0.5–0.618 band is treated as a single zone rather than two precise lines. The remaining levels, 0.236 and 0.786, mark the extremes: very shallow pullbacks in powerful trends, and last-chance retracements before a swing is considered broken.
Q. Is 50% a Fibonacci level?
No. Fifty percent is simply half the range and does not appear as a ratio anywhere in the Fibonacci sequence. It is included in the default set because traders have used half-of-a-move as a reference point for well over a century — W.D. Gann's division of ranges into eighths includes it — and because it sits conveniently between 0.382 and 0.618. It is a psychological level, not a mathematical one.
Q. How do you draw Fibonacci retracement correctly?
Anchor it to a single, unambiguous impulsive swing: from the low to the high for an up move, or from the high to the low for a down move, using the extreme wicks. The swing should be visible on the timeframe you are trading and ideally obvious to anyone looking at the chart. If you cannot identify the swing within a few seconds, the market is probably not in a condition where the tool helps.
Q. Does Fibonacci retracement work in crypto?
It behaves in crypto much as it does elsewhere — as a framework for organizing pullbacks, not as a predictive system. Crypto's 24/7 trading, thin weekend liquidity and frequent large wicks mean levels should be treated as zones with generous tolerance. There is no credible evidence that any specific ratio produces an edge on its own, in crypto or any other market.
Q. What timeframe is best for Fibonacci retracement?
Higher timeframes generally produce more meaningful anchors because more participants can see the same swing. For crypto swing trading, 4-hour and daily charts are the common choice; position traders use weekly. Intraday grids on 1- and 5-minute charts tend to measure noise, where spread, funding and slippage can exceed the distance between adjacent levels.
Q. What is the difference between Fibonacci retracement and extension?
Retracement divides the inside of a completed swing to map how far a correction might go. Extension projects the same ratios beyond the end of the swing — 1.272, 1.618 and 2.618 are typical — to estimate where a continuation might reach. Retracement is about pullback depth; extension is about target distance.
Key takeaways
- Fibonacci retracement divides a chosen price swing at 23.6%, 38.2%, 50%, 61.8% and 78.6%, measuring how much of a move has been given back.
- The ratios derive from the Fibonacci sequence and the golden ratio; 0.5 is added by convention. The historical bridge to markets runs mainly through R.N. Elliott's wave theory.
- Output depends entirely on your anchor points, so disciplined, consistent swing selection matters far more than which levels you display.
- Levels are zones, not walls — a touch is meaningless without a reaction, and confluence with structure, volume or momentum is what makes a level worth watching.
- In the SOL example, both swing anchors were followed by moves of only about 1–2% over 6 and 18 bars, and the rebound never reached even the 23.6% level by the end of the window: a reminder that this is a mapping tool, not a forecast.
Educational material. Charts use real SOL/USDT perpetual prices; past behaviour does not predict future results. Not investment advice.