Indicator & technique library · Indicator library
Ichimoku Cloud Explained: Formula, Settings, How to Use
At a glance
- The Ichimoku Cloud is a five-line Japanese trend system created by Goichi Hosoda and published in 1969 under the name Ichimoku Kinko Hyo.
- Its lines are midpoints of recent highs and lows, not averages of closes, which makes them react to range extremes rather than every candle.
- Default settings 9/26/52 with a 26-bar forward shift come from the old six-day Japanese trading week; crypto traders often double or tune them for 24/7 markets.
- In the SOL/USDT 4h example, 9 cloud crosses produced 4 favorable follow-throughs — a clear reminder that the tool is a context filter, not a signal generator.
The Ichimoku Cloud is a complete trend-following chart system built from five lines, one of which is projected forward in time to form a shaded band — the "cloud." Instead of adding a single oscillator to a price chart, it tries to answer several questions at once: what is the trend, where is equilibrium, where is support or resistance, and is momentum confirming the move.
Traders care about it because it is one of the few tools that gives structure without requiring constant interpretation. Price above the cloud, below the cloud, or inside it is a simple three-state trend filter, and the same chart also supplies dynamic levels you can use for stops and invalidation. The cost is visual clutter and a lagging base line, which is exactly where most beginners get into trouble.
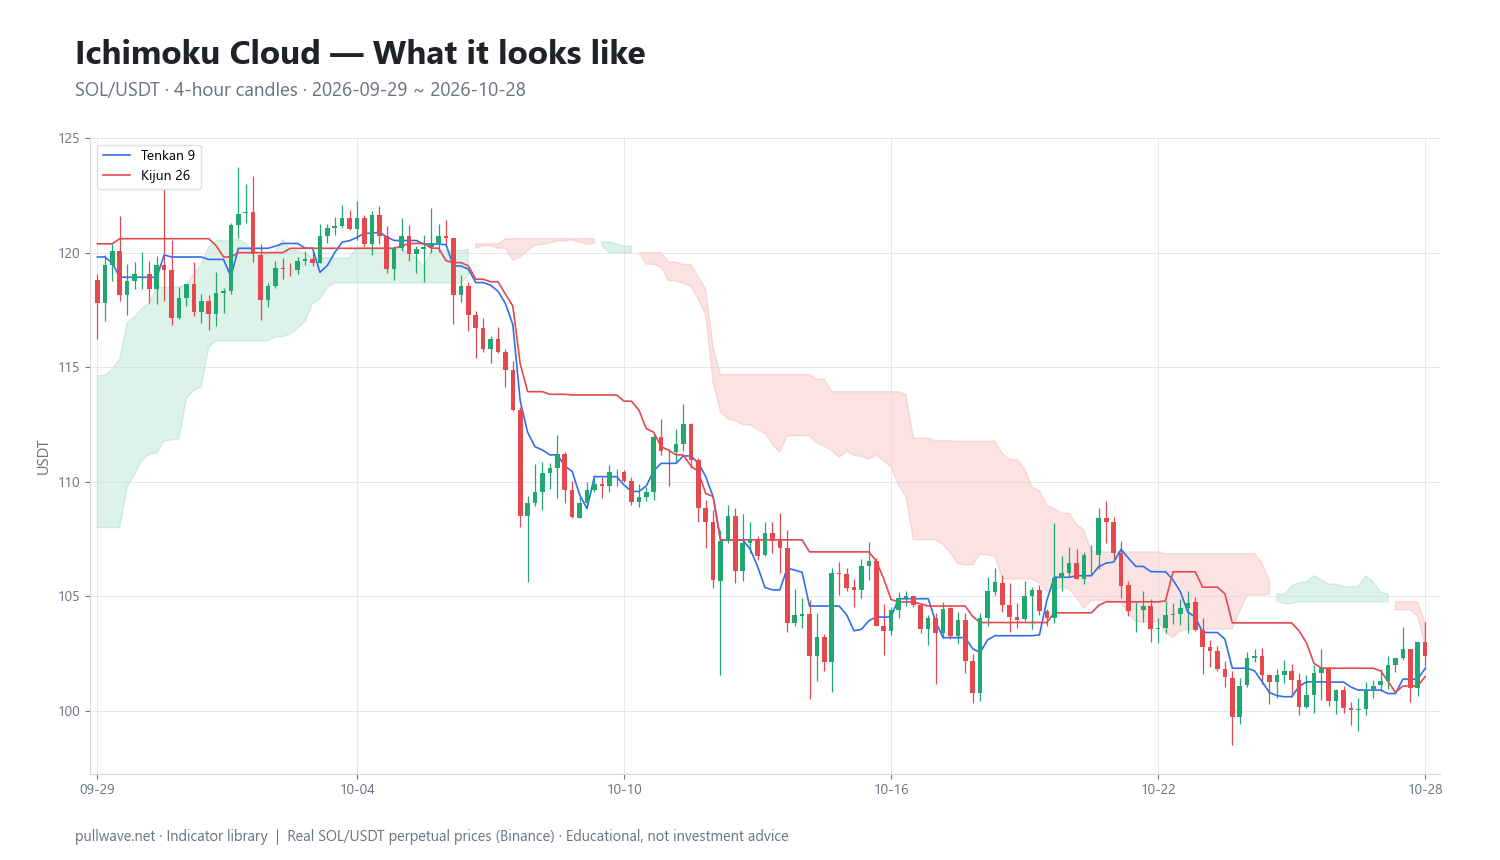
Figure 1 shows the full Ichimoku set drawn on SOL/USDT 4h candles for the window used later in this page: the fast Tenkan-sen, the slower Kijun-sen, the shaded cloud projected 26 bars ahead of price, and the lagging Chikou Span trailing 26 bars behind.
What is Ichimoku Cloud?
Ichimoku Kinko Hyo translates roughly as "one-glance equilibrium chart." It is a trend and support/resistance framework, not an oscillator: nothing is bounded between 0 and 100, and there are no fixed overbought levels.
The system has five components:
- Tenkan-sen (conversion line) — midpoint of the highest high and lowest low of the last 9 bars. The fast line.
- Kijun-sen (base line) — same midpoint calculation over 26 bars. The slower "equilibrium" line.
- Senkou Span A (leading span A) — the average of Tenkan and Kijun, plotted 26 bars into the future. One edge of the cloud.
- Senkou Span B (leading span B) — midpoint of the 52-bar high and low, also plotted 26 bars into the future. The other edge.
- Chikou Span (lagging span) — the current close plotted 26 bars into the past.
The area between Span A and Span B is the Kumo, or cloud. Because both spans are shifted forward, the cloud always extends 26 bars beyond the last candle, which is why Ichimoku charts have empty space on the right.
The idea behind it (theory and history)
The system was developed by Goichi Hosoda, a Japanese newspaper writer who published under the pen name Ichimoku Sanjin. He and a team of assistants reportedly spent decades testing variations by hand before the method was published in book form in 1969. It became widely known in Japan long before Western platforms added it in the 1990s and 2000s.
The theoretical core is equilibrium. Hosoda's lines are not moving averages of closing prices; they are midpoints of ranges. The midpoint of the last 26 bars' high and low is the price at which buyers and sellers of that period are, in a crude sense, balanced. Price above it means the period's buyers are in control; below it, sellers.
The second idea is time. Hosoda treated time as a first-class variable, not just price. Shifting the cloud forward projects the recent equilibrium zone into the future so you can see where support or resistance will sit before price arrives there. Shifting the close backward lets you compare today's price directly against the price action of a month ago, without eyeballing.
The third idea is thickness. When the 9/26 average and the 52-bar midpoint diverge, the cloud becomes thick — recent ranges have been wide and disagreement is large, so the zone is harder to cut through. A thin cloud means recent equilibrium levels have converged and price can pass through easily.
How it is calculated
Every line uses the same building block: (highest high + lowest low) / 2 over a lookback. Step by step:
- Tenkan-sen: take the highest high and lowest low of the last 9 bars, average them.
- Kijun-sen: take the highest high and lowest low of the last 26 bars, average them.
- Senkou Span A: average Tenkan-sen and Kijun-sen, then plot that value 26 bars to the right of the current bar.
- Senkou Span B: take the highest high and lowest low of the last 52 bars, average them, then plot 26 bars to the right.
- Chikou Span: take the current close and plot it 26 bars to the left.
- Cloud: shade the area between Span A and Span B. By convention it is colored one way when Span A is above Span B (bullish) and another when Span A is below (bearish).
Tenkan-sen  = (HH(9)  + LL(9))  / 2
Kijun-sen   = (HH(26) + LL(26)) / 2
Senkou A    = (Tenkan + Kijun) / 2        shifted +26 bars
Senkou B    = (HH(52) + LL(52)) / 2       shifted +26 bars
Chikou      = Close                        shifted -26 bars
Cloud       = area between Senkou A and Senkou B
Note the consequence of using range midpoints: the lines go flat whenever the highest high and lowest low of the lookback stop changing. A flat Kijun-sen or flat Senkou B is not a bug — it marks a price level the market has been revolving around, and those flat segments often act as magnets and as support/resistance.
Default settings and variations
| Parameter | Default | What it represents |
|---|---|---|
| Tenkan | 9 | About a week and a half of trading |
| Kijun | 26 | About one month of trading |
| Senkou B | 52 | About two months |
| Forward shift | 26 | One month projected ahead |
| Chikou shift | -26 | One month back |
The commonly cited rationale is the pre-1980s Japanese trading week of six days: 26 trading days was roughly a month, 52 roughly two months, and 9 about a week and a half. Markets no longer trade Saturdays, so the numbers no longer map to calendar months — they survive because they are the settings everyone watches, which gives them a degree of self-fulfilling relevance.
Common variations:
- Doubled settings (20/60/120 or 18/52/104): used by traders who argue that 24-hour markets pack more activity into each calendar day. Slower, fewer signals, smoother cloud.
- Faster settings (7/22/44 or 8/22/44): used on lower timeframes to reduce lag. More whipsaw.
- Chikou shift decoupled: some platforms let you set the lagging span and the cloud displacement independently; purists keep both equal to the Kijun period.
There is no settings value that is correct in an absolute sense. Changing the numbers changes which swing highs and lows define the lines, and therefore which levels the market appears to respect. If you optimize them on past data, expect the result to degrade going forward.
How to read it
Read it in layers, from slowest to fastest.
1. Price versus the cloud — the trend filter. Closes above the cloud mean the market is trading above its one- to two-month equilibrium zone. Below the cloud is the opposite. Inside the cloud means no trend: the market is inside its own recent range and directional signals have a poor base rate there.
2. Cloud color and twists. When Senkou A is above Senkou B, the cloud is "bullish"; when they cross (a "twist" or kumo change), the projected cloud flips color 26 bars ahead of the current candle. Twists mark potential regime change points in the future, and they are visible in advance.
3. Cloud thickness. A thick cloud is a wide zone of disagreement — treat it as a heavy barrier. A thin cloud offers almost no resistance, and many false breakouts happen through thin segments.
4. Tenkan/Kijun cross — the fast signal. Tenkan crossing above Kijun is a bullish momentum shift; below is bearish. Its quality depends entirely on where it happens: above the cloud, inside it, or below it.
5. Chikou Span — the confirmation. If the lagging line (today's close, plotted 26 bars back) is above the candles it sits next to, the market is higher than it was a month ago with no overhead supply in between. If it is tangled inside old candles, the signal is contested.
How traders use it
As a regime filter. The most common use is also the most defensible: only consider long setups when closes are above the cloud and short setups when below, and stand aside when price is inside it. This works well in sustained trends, where the cloud stays beneath price for weeks. It fails in wide, choppy ranges, where price repeatedly cuts through a thin cloud and the filter flips every few days.
Kijun-sen as a dynamic level. In an established trend, pullbacks often stall at the base line, and the flat segments of the Kijun act as clear reference levels. Traders use it for invalidation: a trend-following position is questioned once price closes decisively on the other side. The weakness is lag — the Kijun is a 26-bar midpoint, so in a fast crypto drawdown it sits far above price and gives back a large chunk of the move.
Tenkan/Kijun crosses filtered by the cloud. A bullish cross occurring above the cloud is usually treated as a continuation signal; the same cross below the cloud is a counter-trend signal with a much lower hit rate. This is a useful hierarchy, but on 24/7 crypto charts the fast line reacts to every overnight wick, so cross counts are high and many are noise.
Cloud breakouts and "edge-to-edge" moves. Some traders trade the break of the cloud itself, or the move from one cloud edge to the other once price closes inside. These setups need a thin cloud and a market that is expanding out of consolidation. In a range-bound market they produce exactly the behavior the example below shows: repeated crosses that reverse within a day.
Example on a real SOL chart
The window below is SOL/USDT perpetual on Binance, 4h candles, from 2026-09-29 to 2026-10-28, with standard 9/26/52 settings and the cloud shifted 26 bars forward. The last close in the window was 102.38.
The regime was clearly bearish: only 17.2% of closes in the window were above the cloud, while 63.9% were below it. The remainder were inside the cloud — the no-man's-land state.
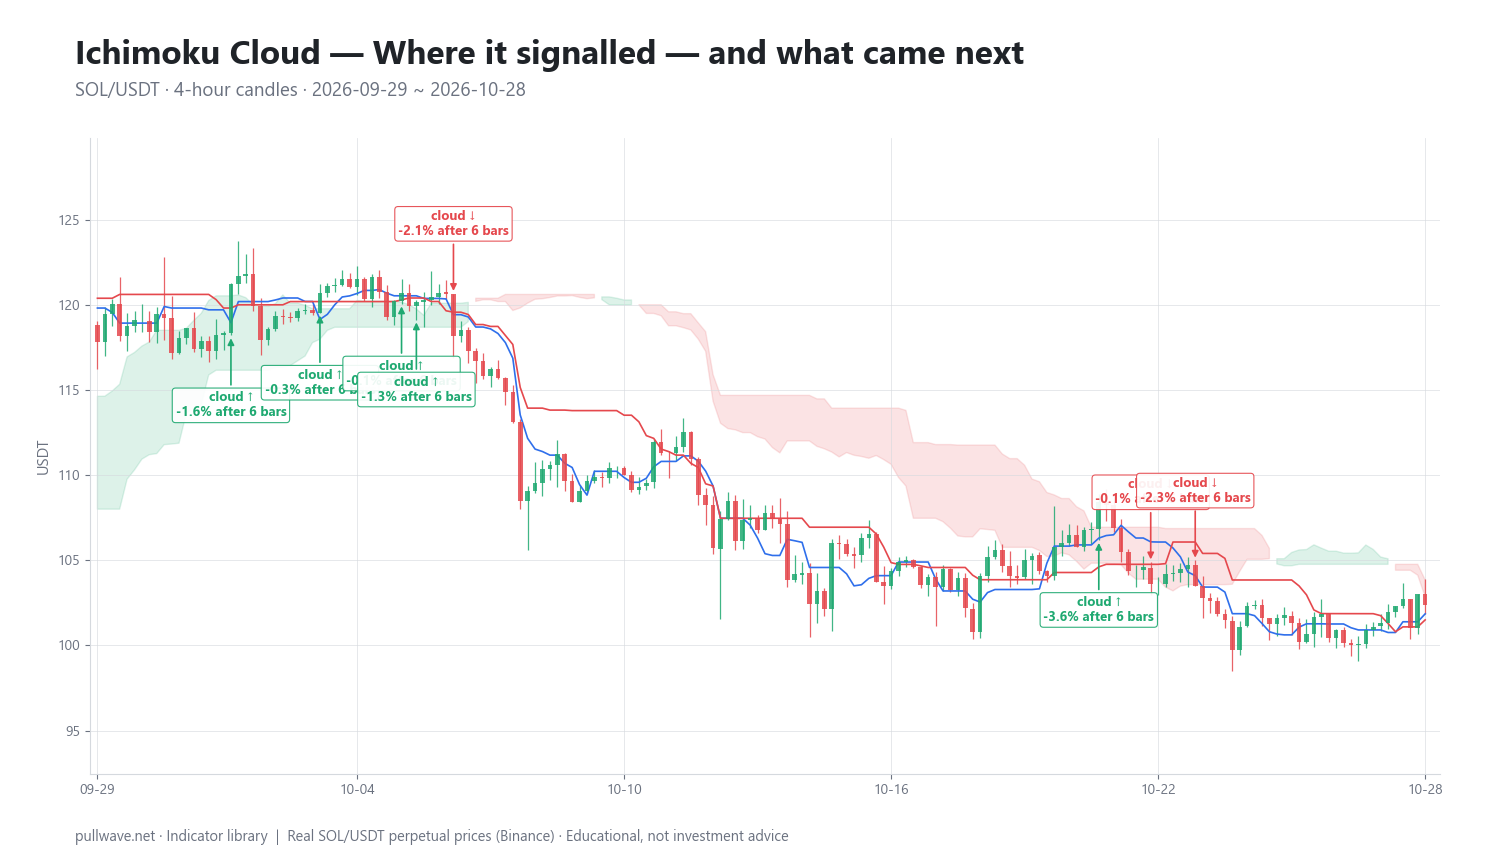
Figure 2 marks each cloud cross in the window and the percentage move 6 bars (one day) and 18 bars (three days) later. There were 9 crosses in total.
| Date (UTC) | Signal | Price | After 6 bars | After 18 bars |
|---|---|---|---|---|
| 2026-10-01 00:00 | cloud ↑ | 118.64 | +2.17% | +1.75% |
| 2026-10-02 00:00 | cloud ↑ | 121.22 | −1.56% | −0.69% |
| 2026-10-04 00:00 | cloud ↑ | 120.72 | −0.28% | −2.10% |
| 2026-10-05 20:00 | cloud ↑ | 120.72 | −0.06% | −9.24% |
| 2026-10-06 04:00 | cloud ↑ | 120.15 | −1.34% | −7.93% |
| 2026-10-07 00:00 | cloud ↓ | 118.18 | −2.11% | −7.22% |
| 2026-10-21 12:00 | cloud ↑ | 108.44 | −3.56% | −8.04% |
| 2026-10-22 16:00 | cloud ↓ | 103.58 | −0.06% | −1.76% |
| 2026-10-23 16:00 | cloud ↓ | 103.52 | −2.33% | −2.98% |
Counting a signal as "favorable" when price moved in the signaled direction over the measured horizons, 4 of 9 worked. The split is the interesting part. Of the six bullish cloud crosses, only the first (1 October, from 118.64) was followed by a gain; the rest were absorbed within hours, and the 5 October and 6 October crosses were followed by roughly −9% and −8% over three days. All three bearish crosses — 7 October, 22 October and 23 October — were followed by lower prices.
In other words, in a month where two-thirds of closes sat below the cloud, signals aligned with the dominant direction followed through and counter-trend signals mostly did not. That is consistent with how trend tools are supposed to behave, but it is one indicator on one market over one month. Nine events is far too small a sample to conclude anything about expectancy, and a different window — especially a trending-up one — would produce a different mix. Treat the table as an illustration of the mechanics and of how often whipsaws occur, not as evidence of an edge.
Common mistakes
- Trading the Tenkan/Kijun cross in isolation. Without the cloud context and the Chikou check, the cross is just a fast/slow midpoint cross. In chop it fires constantly.
- Ignoring where price is relative to the cloud. Most of the failed signals in the example above were bullish crosses in a market that was structurally below its cloud.
- Reading an intrabar cross as confirmed. The Tenkan, Kijun and cloud all update live. A cross that exists at the middle of a 4h candle may be gone at the close. Many traders require a candle close beyond the cloud.
- Forgetting the Chikou is drawn 26 bars back. Its most recent 26 bars of "signal" don't exist yet; you are comparing today's close to old candles, not predicting anything.
- Over-optimizing the periods. Tuning 9/26/52 until last quarter looks clean is curve fitting. If you change them, change them for a structural reason and keep them fixed.
- Using it on illiquid or very low timeframes. On a 5-minute altcoin chart, the 52-bar high/low is dominated by single wicks and funding-driven spikes.
Combining it with other tools
Ichimoku already contains trend, momentum and support/resistance, so the useful additions are things it does not measure.
- Volume or open interest. A cloud breakout on rising volume and expanding open interest in perpetual futures is a different event from one that occurs on a thin weekend tape. Ichimoku is blind to participation.
- A volatility measure such as ATR. Position sizing and stop distance should scale with volatility; the Kijun alone tells you where, not how far. In crypto this matters enormously, because the same percentage stop behaves differently in a 2% day and a 12% day.
- Higher-timeframe alignment. A common practice is to take the cloud state from the daily chart as the regime, then look for Tenkan/Kijun events on the 4h. This reduces counter-trend entries at the cost of fewer opportunities.
- An oscillator for exhaustion. RSI or a similar momentum tool can flag when a trend above the cloud is stretched, which Ichimoku will not tell you — its lines have no upper bound.
Avoid stacking tools that measure the same thing. Adding two moving averages to an Ichimoku chart adds clutter, not information, because the Tenkan and Kijun already serve that role.
Frequently asked questions
Q. What are the best Ichimoku settings for crypto?
There is no single best setting. The 9/26/52 defaults remain the most widely used, including in crypto, partly because so many traders watch the same levels. Some traders double them to 20/60/120 on the grounds that crypto trades 24/7 with no weekend gaps, which produces a smoother, slower cloud with fewer false breakouts and more lag.
Q. Is the Ichimoku Cloud a leading or lagging indicator?
It is both, by design. The Tenkan and Kijun are lagging, since they are midpoints of past ranges, while the cloud is projected 26 bars into the future so you can see upcoming support and resistance zones before price gets there. The projected cloud is not a forecast of price — it is a forward plot of past equilibrium values.
Q. What does it mean when price is above the cloud?
It means the market is trading above its one- to two-month equilibrium zone, which most users read as a bullish regime. It does not mean price will keep rising; it means trend-following long setups have a more favorable context, and that the cloud below can act as support if price retraces. Thin clouds provide weak support, thick ones stronger.
Q. What is the difference between Senkou Span A and Senkou Span B?
Span A is the average of the Tenkan and Kijun lines, so it moves faster; Span B is the midpoint of the 52-bar high and low, so it is slower and often flat for long stretches. When A is above B the cloud is conventionally bullish, and when they cross — a "twist" — the cloud changes color 26 bars ahead of the current candle.
Q. Does Ichimoku work on low timeframes like 5 or 15 minutes?
It can be plotted on any timeframe, but the lower you go the more the 9, 26 and 52-bar extremes are driven by single wicks, liquidation cascades and thin-book noise. Most traders who use it intraday still check the daily or 4h cloud for regime and accept that low-timeframe crosses whipsaw frequently.
Q. Can the Ichimoku Cloud be used on its own?
It was designed as a standalone system, and the five components cover trend, momentum and support/resistance. In practice most traders still add a volatility measure for position sizing and some read of volume or open interest, because Ichimoku says nothing about participation or risk per trade.
Key takeaways
- Ichimoku Kinko Hyo was created by Goichi Hosoda (pen name Ichimoku Sanjin) and published in 1969; all five lines are built from range midpoints, not from averages of closes.
- The defaults 9/26/52 with a 26-bar shift trace back to the old six-day Japanese trading week; they persist mainly because they are the settings most traders watch.
- Its strongest and most defensible use is as a three-state regime filter — above, below, or inside the cloud — rather than as a source of entry signals.
- In the SOL/USDT 4h window from 29 September to 28 October 2026, only 17.2% of closes were above the cloud and 63.9% below; of 9 cloud crosses, 4 followed through, with nearly all the bullish crosses failing inside a bearish regime.
- Cloud thickness, flat Kijun segments and the Chikou Span add context that a single moving average cannot, but none of them remove the need for position sizing, stop placement and awareness of leverage risk in perpetual futures.
Educational material. Charts use real SOL/USDT perpetual prices; past behaviour does not predict future results. Not investment advice.