Indicator & technique library · Indicator library
VWAP Indicator Explained: Formula, Settings and Uses
At a glance
- VWAP is the average price of every unit traded since an anchor, weighted by volume, and it resets at the start of each new session.
- It began as an institutional execution benchmark, not as a signal generator, and that origin still shapes how it should be read.
- Session VWAP, weekly/monthly VWAP, anchored VWAP and rolling VWAP answer different questions about the same data.
- In the 1h SOL/USDT sample below, price closed above VWAP exactly 50% of the time and only 7 of 13 crossovers continued in the signal direction.
VWAP stands for Volume-Weighted Average Price: the average price at which every unit of an asset changed hands during a defined period, with each trade weighted by its size. A 50,000-unit trade at $102 moves VWAP far more than a 50-unit trade at $98, which is exactly what makes it different from a simple moving average of closing prices.
Traders care about VWAP because it is a reference point rather than a forecast. It tells you whether buyers who entered during the current session are, on average, in profit or underwater — and in short-term crypto trading, that single piece of information often organizes a messy intraday chart better than a stack of oscillators.
What is VWAP (Volume-Weighted Average Price)?
VWAP is a cumulative statistic. From the moment a session begins, it adds up the value of everything traded (price × volume) and divides by the total volume traded so far. The result is plotted as a single line that updates with every new bar.
Because it is cumulative, VWAP behaves differently from a moving average. Early in a session it is jumpy and sensitive; late in a session it becomes heavy and slow, because each new bar is a small fraction of the accumulated volume. At the next session reset, it starts fresh.
It is also a true "fair value of the session" measure in a narrow, mechanical sense: if you had bought the entire session's volume evenly, VWAP is the price you would have paid. That is why institutions use it as an execution benchmark, and why price trading above or below it carries an intuitive meaning.
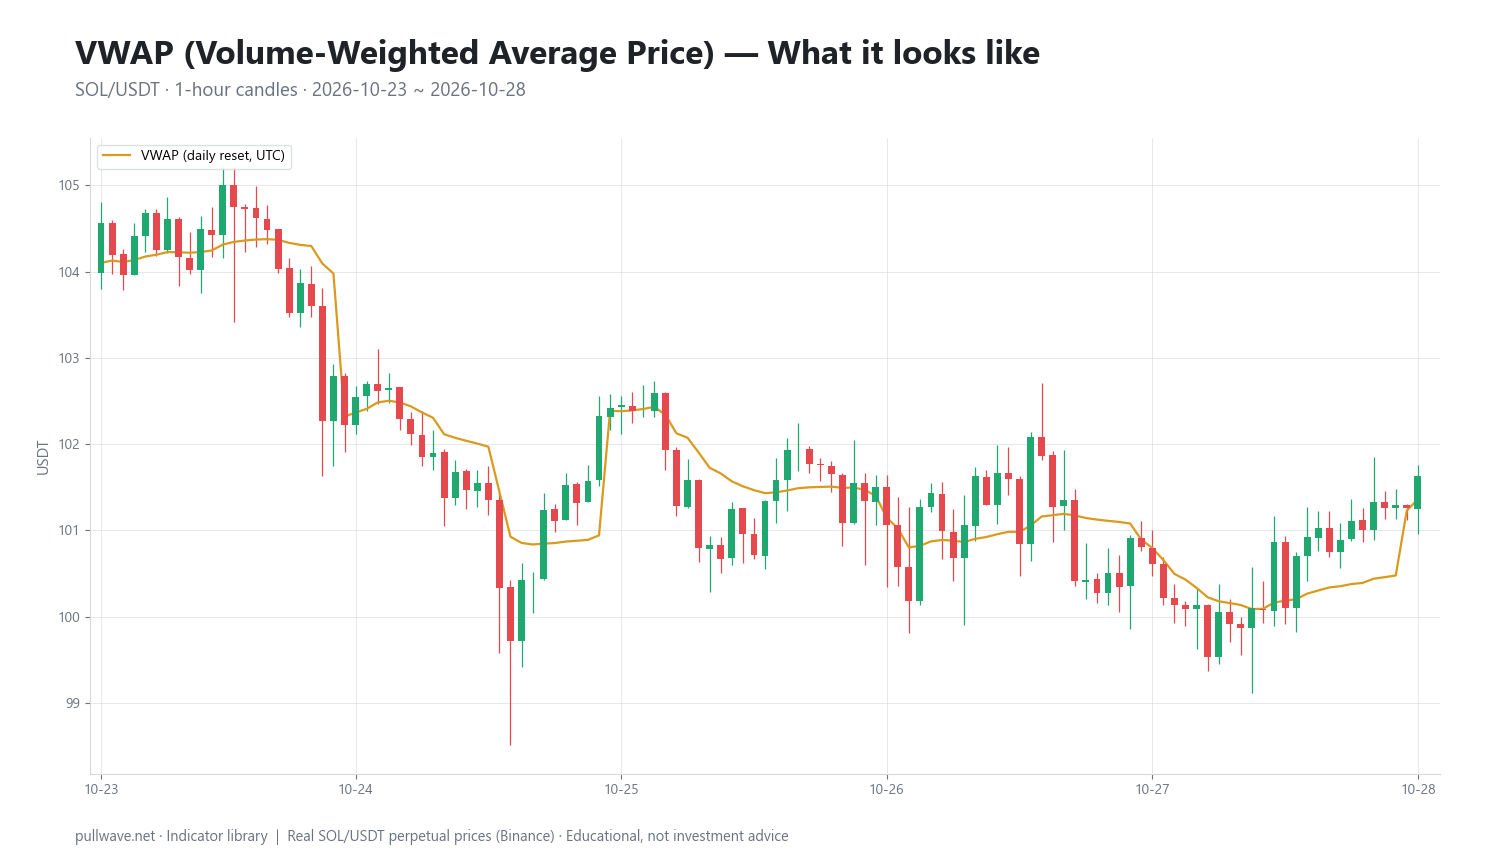
Figure 1 shows session VWAP drawn on real SOL/USDT 1h candles. Notice how the line resets each day at 00:00 UTC, how it starts the day close to price and then tightens as volume accumulates, and how price oscillates around it rather than respecting it as a hard barrier.
The idea behind it (theory and history)
VWAP did not come from technical analysis. It emerged in institutional equity trading as a way to measure execution quality: if a fund had to buy a large block over a day, the natural question was whether its average fill beat the day's volume-weighted average price. An early academic use of this benchmark appears in work on NYSE transaction costs by Berkowitz, Logue and Noser published in The Journal of Finance in 1988, and the measure became standard in brokerage execution reporting through the 1990s.
The theory is simple and honest: a trade's price should be judged against where the market actually traded, weighted by how much traded there. A price touched for thirty seconds on thin volume is less representative than a price where millions of dollars changed hands. VWAP encodes that weighting directly.
Retail charting platforms adopted VWAP later, first for intraday stock trading and then everywhere, including 24/7 crypto markets. The anchored variation — starting the calculation from a chosen bar rather than a session open — was popularized by trader and author Brian Shannon, who built much of his published work around it.
The practical consequence of this history is worth keeping in mind. VWAP was designed to answer "did I get a good price?", not "should I enter now?". Everything traders do with it as a signal is a reinterpretation of a benchmark, and that reinterpretation is where most of the mistakes happen.
How it is calculated
Step by step, for each bar in the session:
- Compute the bar's typical price: (high + low + close) ÷ 3. Some platforms use the close instead; the difference is usually small.
- Multiply the typical price by that bar's volume. This is the bar's traded value.
- Add that value to a running total of traded value since the session began.
- Add the bar's volume to a running total of volume since the session began.
- Divide the cumulative traded value by the cumulative volume. That is VWAP at that bar.
- At the next session boundary, reset both running totals to zero and start again.
``` TP_i = (High_i + Low_i + Close_i) / 3 VWAP_t = Σ(TP_i × Volume_i) / Σ(Volume_i) for i = session start … t
Optional standard-deviation bands: σ_t = sqrt( Σ[ Volume_i × (TP_i − VWAP_t)² ] / Σ(Volume_i) ) Upper = VWAP_t + k × σ_t Lower = VWAP_t − k × σ_t (k = 1, 2, 3) ```
The band calculation is a volume-weighted standard deviation of price around VWAP. The first band captures the bulk of session trading; the second and third mark progressively stretched conditions. Bands are optional and not part of the original benchmark.
Two properties follow directly from the formula. VWAP can never be dragged far by a single low-volume wick, and it cannot be computed without volume data — which means it is only as reliable as the volume feed of the venue you are charting.
Default settings and variations
VWAP has no "period" in the way RSI has 14 or MACD has 12/26/9. Its only real setting is the anchor: where the cumulative sum starts. In equities the anchor is obvious, because the exchange opens and closes. Crypto has no close, so the anchor is a convention.
| Variation | Anchor / reset | Typical use |
|---|---|---|
| Session VWAP | Daily, usually 00:00 UTC | Intraday trading on 5m–1h charts |
| Weekly VWAP | Monday 00:00 UTC | Swing context on 1h–4h charts |
| Monthly / quarterly VWAP | First bar of the period | Positional and macro context |
| Anchored VWAP | Any chosen bar (swing high, swing low, listing, news event) | Average entry price of a specific move |
| Rolling VWAP | Last N bars, continuously | A VWAP-style line that never resets |
The 00:00 UTC reset is a convention, not a law. Some traders anchor crypto sessions to the US equity open or to the daily candle close used by their venue. What matters is consistency: if you switch anchors to find a nicer-looking line, you are curve-fitting your own chart.
Band multipliers default to 1, 2 and 3 standard deviations because that is the familiar statistical scaling, not because price is normally distributed. Crypto returns have fat tails, so two-sigma excursions happen more often than textbook statistics suggest.
Do not confuse VWAP with VWMA (volume-weighted moving average). VWMA weights a fixed lookback of N bars by volume and rolls forward; VWAP accumulates from an anchor and resets. They look similar on a chart and answer different questions.
How to read it
Start with position: price above VWAP means the average participant since the anchor is in profit on long exposure; price below means the opposite. That is the entire base reading, and it is more useful than it sounds.
Then read slope. A rising VWAP means recent volume is transacting above the session average — demand is lifting the benchmark. A flat VWAP, especially one that price crosses repeatedly, is the signature of a balanced, rotational market with no accepted direction.
Third, read distance. Price far above VWAP in the second or third band is stretched relative to where the session's volume actually traded; that is a statement about extension, not about reversal timing. Price hugging VWAP is a statement about agreement.
Finally, read the reset. The first hours after an anchor reset are noisy because few bars carry the calculation. Many traders deliberately ignore VWAP signals in the first few bars of a new session for exactly that reason.
How traders use it
1. Trend filter. Only consider long setups while price holds above a rising session or weekly VWAP, and short setups below a falling one. Works when a directional move is underway and VWAP slopes cleanly away from the open. Fails in balanced markets, where price crosses the line repeatedly and the filter flips sides every few bars — exactly what happens in the sample below.
2. Mean-reversion reference. Fade excursions to the second or third standard-deviation band back toward VWAP. Works in range-bound, rotational conditions where VWAP is flat and volume is distributed around it. Fails badly during trend days and news-driven expansions, when price rides the outer band for hours and the "stretched" reading keeps getting more stretched.
3. Execution and retest reference. Use VWAP as the level to work orders around, or wait for a first retest of VWAP after a breakout rather than chasing. This is closest to the tool's original purpose: improving the quality of a fill relative to the session average. Works when liquidity is normal. Fails in thin books or during liquidation cascades, when price gaps through the level without offering a retest.
4. Anchored VWAP from a significant bar. Anchor to a major swing high, a capitulation low, a listing, or a large liquidation event to see the average price paid since that moment. Traders watch whether price reclaims or rejects that line. Works when the anchor is genuinely meaningful and widely observed. Fails when the anchor is arbitrary — you can always find an anchor that produces a line touching three nice lows.
Example on a real SOL chart
The sample is the SOL/USDT perpetual contract on the 1-hour timeframe, from 23 October 2026 to 28 October 2026, using session VWAP with typical price and a 00:00 UTC reset. The last close in the window was 101.63.
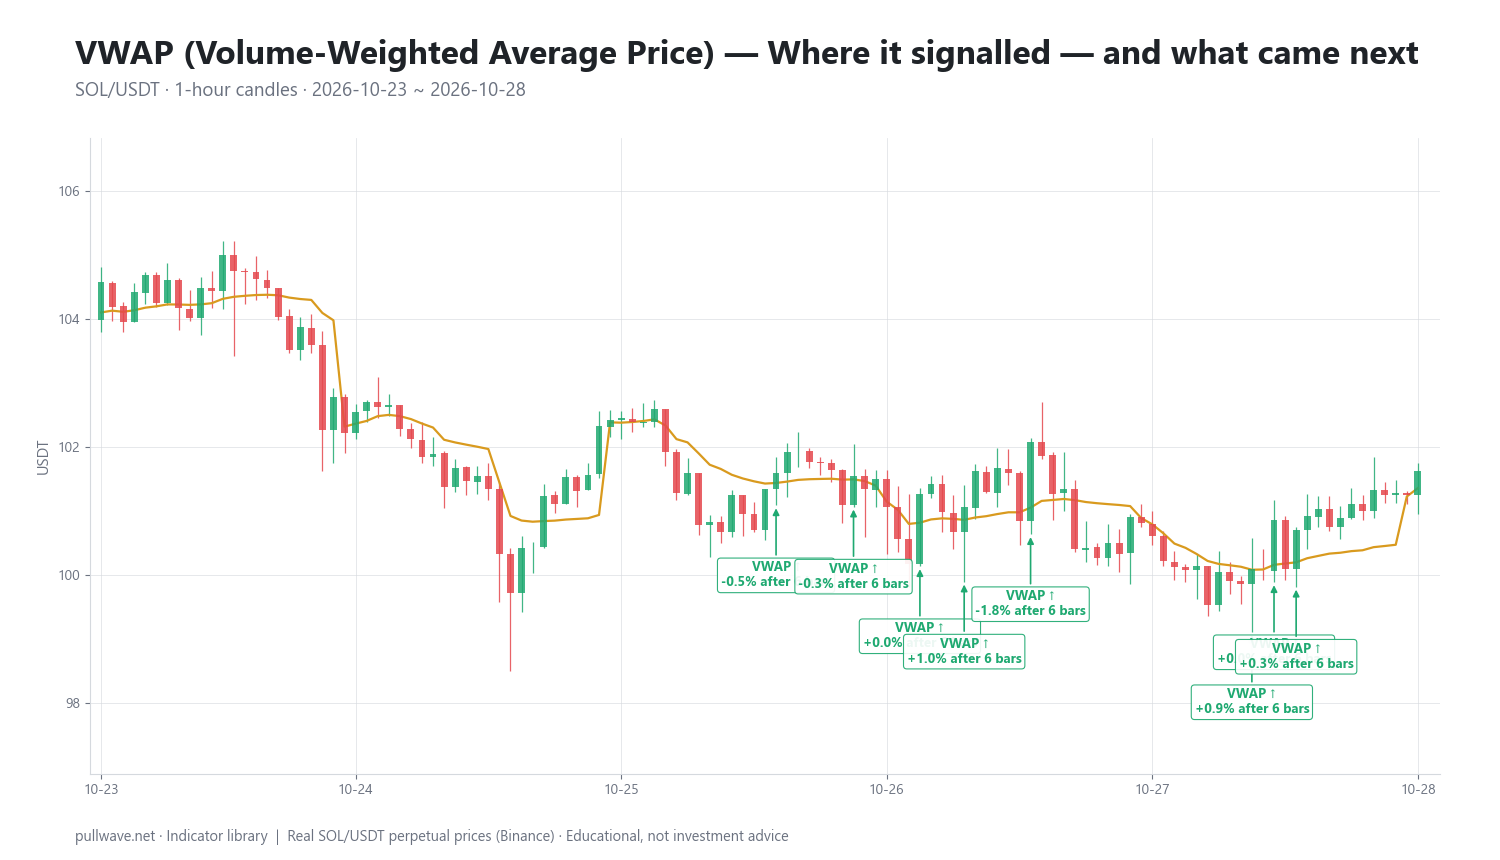
Figure 2 marks each crossover event and the percentage move 6 and 18 bars later. Over the whole window, price closed above VWAP exactly 50.0% of the time — a textbook description of a market in balance rather than in trend.
There were 13 crossover events in roughly five days. The ten upward crosses recorded are: 24 Oct 18:00 at 101.24, 25 Oct 04:00 at 102.59, 25 Oct 15:00 at 101.59, 25 Oct 22:00 at 101.55, 26 Oct 04:00 at 101.27, 26 Oct 08:00 at 101.06, 26 Oct 14:00 at 102.08, 27 Oct 10:00 at 100.10, 27 Oct 12:00 at 100.87 and 27 Oct 14:00 at 100.70. The entire cluster sits inside a band roughly 2.5% wide.
The six-bar outcomes were mixed: +1.17%, −1.87%, −0.49%, −0.28%, +0.03%, +1.01%, −1.77%, +0.93%, +0.02% and +0.30%. The eighteen-bar outcomes were −0.28%, −1.01%, +0.04%, −0.28%, −0.92%, −0.83%, −2.13%, +1.53%, +0.75% and +0.92%. Across all 13 events, 7 of 13 moved in the signal direction after the measured bars.
Seven out of thirteen is a coin flip. That is the honest reading, and it is the most instructive thing in this example: in a flat, rotational week, VWAP crossovers generate frequent signals with no edge in either direction, and the transaction costs and funding of a perpetual position would erode even the small winners. Note too that the two crosses that occurred highest in the range fared worst — 25 Oct 04:00 at 102.59 produced −1.87% after six bars and −1.01% after eighteen, and 26 Oct 14:00 at 102.08 produced −1.77% and −2.13% — while the crosses near the lower end of the range on 27 October were the ones that followed through.
This is one indicator, on one market, over one five-day window. It is an illustration of behavior in a specific regime, not evidence about how VWAP performs generally. A trending week on the same chart would produce fewer crossovers and a very different-looking table, and that asymmetry is the real lesson.
Common mistakes
- Treating VWAP as support or resistance. It is an average, not a level where resting orders sit. Price passes through it constantly, as the 13 crosses above show.
- Trading every cross. In balanced markets crossovers are noise. Requiring a trend condition — slope, structure, higher-timeframe location — removes most of the worst signals.
- Ignoring the anchor. A session VWAP on a 4h chart is nearly meaningless; by the time you have six bars, the day is over. Match the anchor to the timeframe.
- Forgetting that VWAP depends on the venue. Volume on one exchange is not volume on another, so the same chart can show a different VWAP across platforms. Perpetual volume and spot volume also differ.
- Using it on illiquid pairs. If volume is dominated by a handful of prints, the weighting that gives VWAP its meaning breaks down.
- Assuming bands are probability bounds. Two-sigma excursions in crypto are routine, especially around funding resets, macro releases and liquidation cascades.
Combining it with other tools
VWAP pairs naturally with structure. Marking prior session highs and lows, or weekly ranges, tells you whether price is above VWAP and in a developing range — a far more specific condition than either reading alone.
It also pairs with volume profile, which is built from the same raw data but organized by price rather than by time. VWAP gives one number; the profile shows where volume clustered. Agreement between the point of control and VWAP is a strong description of balance.
Momentum tools add timing context. A move that is stretched into the upper VWAP band while momentum is diverging describes a different situation than one where both are expanding together. Neither confirms the other — they measure different things — but the combination narrows down the regime.
Finally, for perpetual futures, read VWAP alongside funding and open interest. Price sitting far above the session VWAP with heavily positive funding tells you the average long entered lower and that leverage is crowded on one side; that is a risk-management input, not a signal.
Frequently asked questions
Q. What is the best VWAP setting for crypto?
There is no period to optimize — the only choice is the anchor. Most intraday crypto traders use a session VWAP that resets at 00:00 UTC, while swing traders prefer weekly or monthly anchors. Match the anchor to your holding period: a daily reset is too short for a multi-day position, and a monthly anchor is too slow for scalping.
Q. Does VWAP work in 24/7 crypto markets?
It works mechanically, but its original meaning is weaker. In equities the session boundary is real — trading genuinely stops — while in crypto the 00:00 UTC reset is a convention that some participants observe and others ignore. VWAP still measures the volume-weighted average since the anchor, but you should not expect the same behavior around the reset that stock traders see at the opening bell.
Q. What is the difference between VWAP and a moving average?
A moving average averages a fixed number of recent closes, usually with equal or exponential weighting, and rolls forward continuously. VWAP accumulates every trade since an anchor, weights each bar by its volume, and resets. That makes VWAP slower and heavier late in a session, and it makes the line reflect where volume actually transacted rather than where price merely printed.
Q. What is anchored VWAP and when should I use it?
Anchored VWAP starts the calculation from a bar you choose — a major high, a capitulation low, a token listing, a large liquidation event — instead of a session open. It shows the average price paid by everyone who traded since that moment. It is most useful when the anchor is objectively significant; anchoring to arbitrary bars until the line looks good is just curve-fitting.
Q. Why does VWAP look different on different platforms?
Three reasons: the venue whose volume is used, the anchor time, and whether the calculation uses typical price ((high + low + close) ÷ 3) or the close. Spot and perpetual volume for the same asset differ substantially, so the same pair can show meaningfully different VWAP lines. Check these three settings before concluding that one chart is wrong.
Q. Can VWAP be used on daily or higher timeframes?
Yes, but you must change the anchor. A session VWAP on a daily chart produces a single point per session and is useless; monthly, quarterly, yearly or anchored VWAP is the correct choice for higher timeframes. Many longer-term traders use a yearly VWAP as a simple measure of whether the average buyer of the past year is in profit.
Key takeaways
- VWAP is the volume-weighted average price since an anchor, originally an institutional execution benchmark rather than a trading signal.
- The calculation is cumulative — typical price × volume summed and divided by summed volume — which makes it sensitive early in a session and heavy late in one.
- The anchor is the only real setting: daily, weekly, monthly, or manually placed on a significant bar.
- Regime decides everything. In the 1h SOL/USDT window examined, price spent exactly 50% of closes above VWAP and only 7 of 13 crossovers followed through, which is what a balanced market produces.
- Use it as context — position, slope, distance from the average — alongside structure, volume profile and, for perpetuals, funding and open interest.
Educational material. Charts use real SOL/USDT perpetual prices; past behaviour does not predict future results. Not investment advice.