Indicator & technique library · Indicator library
Volume & OBV Explained: Formula, Settings and How to Use
At a glance
- OBV is a running total of volume that adds the bar's volume on an up close and subtracts it on a down close.
- It was popularized by Joseph Granville in 1963 as a way to see whether volume is flowing into or out of an asset.
- OBV has no period setting — the only choices are which volume series you feed it and whether you smooth it with a moving average.
- Its main use is comparing the direction of OBV with the direction of price; confirmation and divergence are the two readings that matter.
Volume tells you how much was traded in a bar; On-Balance Volume (OBV) tells you where that volume was going. OBV is a single cumulative line that adds the whole bar's volume when price closes up and subtracts the whole bar's volume when price closes down. The level of the line is meaningless on its own — only its direction and its relationship to price carry information.
Traders care about OBV because price alone can hide the quality of a move. A rally on shrinking participation and a rally on expanding participation look identical on a bare candlestick chart; on an OBV panel they do not. In crypto, where a 24/7 tape, perpetual futures and leverage make volume spikes frequent and sometimes misleading, that extra dimension is useful — as long as you know exactly what the line is measuring and what it is not.
What is Volume and OBV (On-Balance Volume)?
Volume is the number of units (coins, contracts) traded during a bar. On most crypto charts it is drawn as a histogram under price. It is a measure of activity and, loosely, of conviction: more volume means more participants were willing to transact at those prices.
OBV turns that histogram into a trend line. Each new bar's volume is assigned a sign based on whether the close was higher or lower than the previous close, and then added to a running total. The result is a cumulative, unbounded series — it can run into the billions on a liquid pair — that rises when up-closes dominate on volume and falls when down-closes do.
OBV is classified as a volume-based momentum or "flow" indicator. It is not an oscillator: there is no overbought or oversold level, no upper or lower bound, and no meaningful absolute value. You read slope, structure (higher highs and higher lows versus lower highs and lower lows) and agreement or disagreement with price.
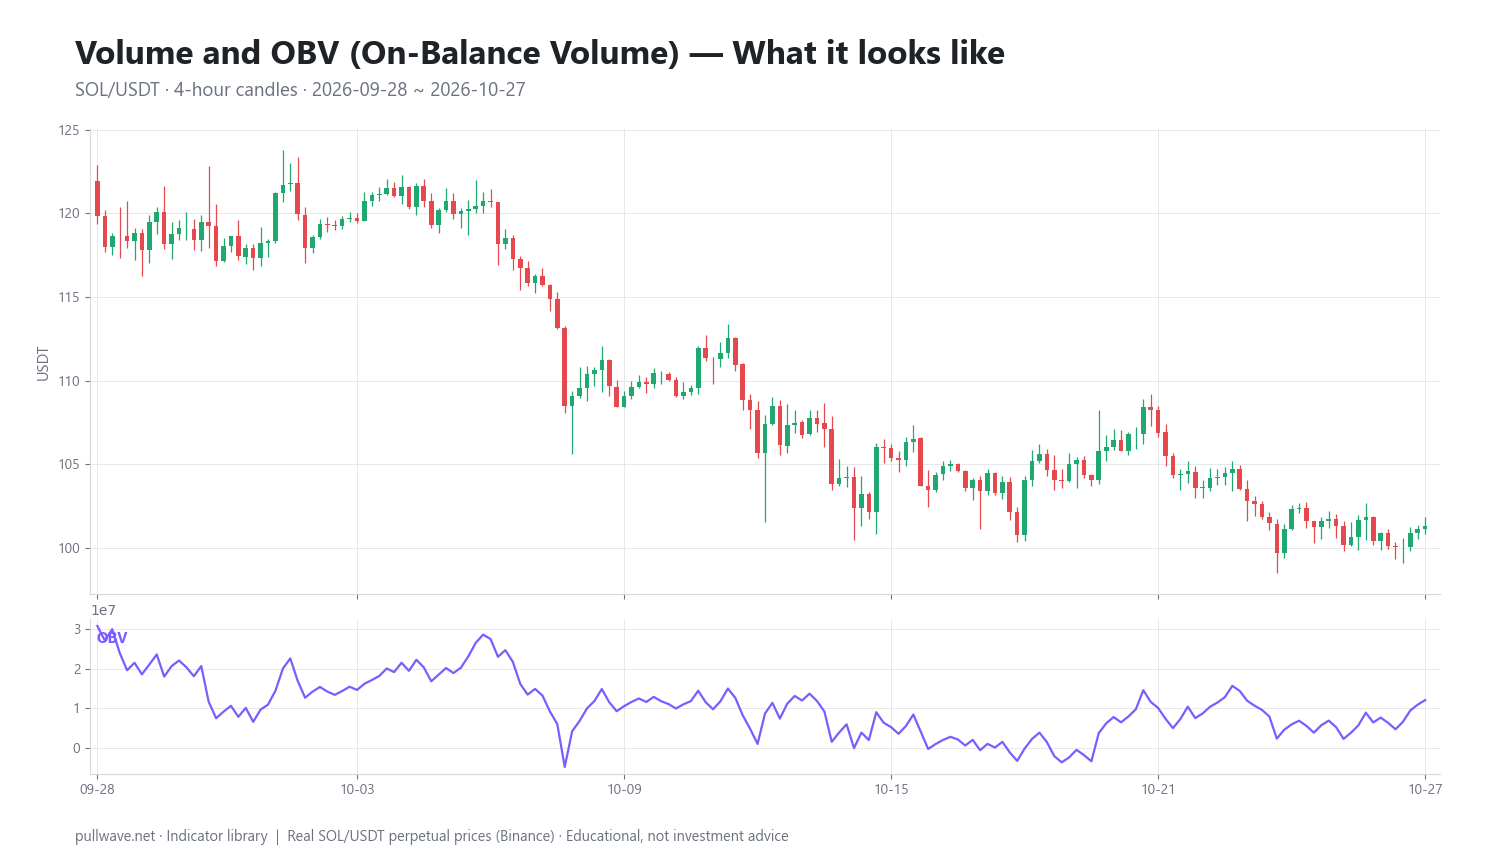
Figure 1 shows OBV plotted beneath SOL/USDT perpetual candles on the 4-hour chart. Notice that the OBV line has its own swing structure — tops, bottoms and trend segments — which you compare with the price structure directly above it.
The idea behind it (theory and history)
OBV was popularized by the American analyst Joseph E. Granville in his 1963 book Granville's New Key to Stock Market Profits. Granville's premise was blunt: volume precedes price. He argued that smart, informed money accumulates or distributes before a move becomes obvious in price, and that this accumulation leaves a footprint in the volume record.
The cumulative-volume idea was not entirely new in 1963 — similar running-total volume lines had been used by earlier analysts, and the concept sits in the same lineage as the volume analysis in Dow Theory and in Richard Wyckoff's work on effort versus result. Granville's contribution was the specific, simple rule set and the name, which is why OBV is almost always credited to him.
The theory in one sentence: if a bar closes up, the entire session's volume is treated as buying pressure; if it closes down, it is treated as selling pressure. That is obviously a crude assumption — within a single bar there is a buyer for every seller, and most volume is neither "smart" nor "dumb." But across many bars, the signed sum does capture whether advances or declines are the ones attracting participation.
The concept Granville emphasized most is divergence. If price makes a new high but OBV does not, the new high was made on comparatively thin or poorly distributed volume; the "effort" did not match the "result." He treated that as a warning that the move lacked support, not as a timing signal.
How it is calculated
The calculation is one of the simplest in technical analysis. For each bar, compare the close with the previous close, then adjust the running total:
- Start the series at an arbitrary value, almost always zero, on the first bar of the data window.
- If the current close is higher than the previous close, add the current bar's volume to the previous OBV value.
- If the current close is lower than the previous close, subtract the current bar's volume from the previous OBV value.
- If the current close is equal to the previous close, carry the previous OBV value forward unchanged.
- Repeat for every bar. The result is the OBV line.
``` if Close[t] > Close[t-1]: OBV[t] = OBV[t-1] + Volume[t] if Close[t] < Close[t-1]: OBV[t] = OBV[t-1] - Volume[t] if Close[t] = Close[t-1]: OBV[t] = OBV[t-1]
OBV[0] = 0 (arbitrary seed value) ```
Two consequences follow from the formula. First, the magnitude of the price change is irrelevant — a +0.01% close and a +9% close both add 100% of the bar's volume. Second, because the seed value is arbitrary and depends on where your data begins, the absolute number on the y-axis has no interpretation. Two charting platforms can show different OBV levels for the same pair and both be correct.
Default settings and variations
Classic OBV has no period input. There is nothing to optimize, which is part of its appeal and part of its limitation. The choices you actually make are these:
| Choice | Common default | Why it exists |
|---|---|---|
| Price input | Close | Granville's rule compares closes; the close is treated as the "decision" price of the bar |
| Volume series | Exchange base volume | On crypto perps, quote volume (USDT) is an alternative that normalizes across price levels |
| Smoothing | None, or a 20-period MA of OBV | A moving average on OBV gives a reference line for crossovers and filters out one-bar noise |
| Timeframe | 4h or 1D for swing work | Lower timeframes make OBV extremely noisy; higher timeframes make divergences slower but cleaner |
Related indicators solve OBV's main weakness — the all-or-nothing volume assignment:
- Accumulation/Distribution Line (Marc Chaikin) weights volume by where the close sits within the bar's range instead of by the direction of the close.
- Price Volume Trend (PVT) adds volume multiplied by the percentage price change, so a large move counts more than a tiny one.
- Chaikin Money Flow and the Money Flow Index turn similar ideas into bounded oscillators over a lookback period (commonly 20 and 14 bars respectively).
- Volume-weighted average price (VWAP) answers a different question — the average transacted price — but is often read alongside OBV.
If you want a smoothed version, a 20-period simple or exponential moving average applied to the OBV line is the usual choice; 20 is simply a convenient "about one month of daily bars" window inherited from equity practice, not a tested optimum.
How to read it
Read OBV in three steps, in this order:
Slope. Is the line rising, falling or flat over the last 20–50 bars? A rising OBV says up-closes are carrying more volume than down-closes. A flat OBV during a price move says the two are roughly balanced — the move is happening on indifferent participation.
Structure. Mark OBV's own swing highs and lows. In a healthy uptrend, OBV makes higher highs and higher lows along with price. Trendlines and horizontal levels can be drawn on the OBV line itself, which is often more readable than the raw histogram.
Agreement with price. This is the payoff. Confirmation means price and OBV make matching highs and lows. Divergence means they do not: price makes a higher high while OBV makes a lower high (bearish divergence), or price makes a lower low while OBV makes a higher low (bullish divergence).
A practical note on crypto: a single liquidation cascade can move OBV by more than a week of ordinary trading, because the formula adds the entire volume of that bar. Always check whether an OBV move is the result of sustained flow or one violent candle.
How traders use it
1. Trend confirmation. The most defensible use. In an established trend, you check that OBV is making the same structure as price before treating a breakout or pullback as part of that trend. Works in directional, trending regimes where participation builds. Fails in choppy ranges, where OBV oscillates with price and confirms nothing — and in low-liquidity periods where a handful of large bars dominate the total.
2. Divergence as a warning. When price pushes to a new extreme and OBV does not follow, the move is running on less volume support than the previous one. Experienced users treat this as a reason to tighten risk management or demand more evidence, not as a reversal signal by itself. Works best at the end of extended trends on 4h and daily charts. Fails badly in strong trends, where divergence can persist for weeks while price keeps going — divergence tells you about the character of a move, not its expiry date.
3. Breakout filtering. When price breaks a range boundary, you ask whether OBV broke its own corresponding level. An OBV that is already at new highs while price is still inside the range is the textbook "accumulation" picture Granville described. Works in liquid pairs with clean range structure. Fails on exchanges or sessions with thin, uneven volume, and on news-driven gaps where volume explodes in both directions.
4. Trendlines and crossovers on OBV itself. Some traders draw trendlines on the OBV line, or use a crossover of OBV above or below its 20-period moving average as a simple flow filter. Works as a slow regime filter. Fails as a standalone entry trigger — it lags, and on lower timeframes it whipsaws constantly.
Example on a real SOL chart
The window below is SOL/USDT perpetual on Binance, 4-hour bars, from 2026-09-28 to 2026-10-27. Over that window price fell 15.5% and ended at a last close of 101.29, while OBV declined by 18,630,199 — in other words, down-closes carried substantially more volume than up-closes across the month, which is the pattern you would expect in a confirmed downtrend.
One marked event sits inside the window: the price high of 121.71 printed on 2026-10-02 at 04:00 UTC. Measured from that bar, price was -2.0% after 6 bars (one day) and -0.05% after 18 bars (three days).
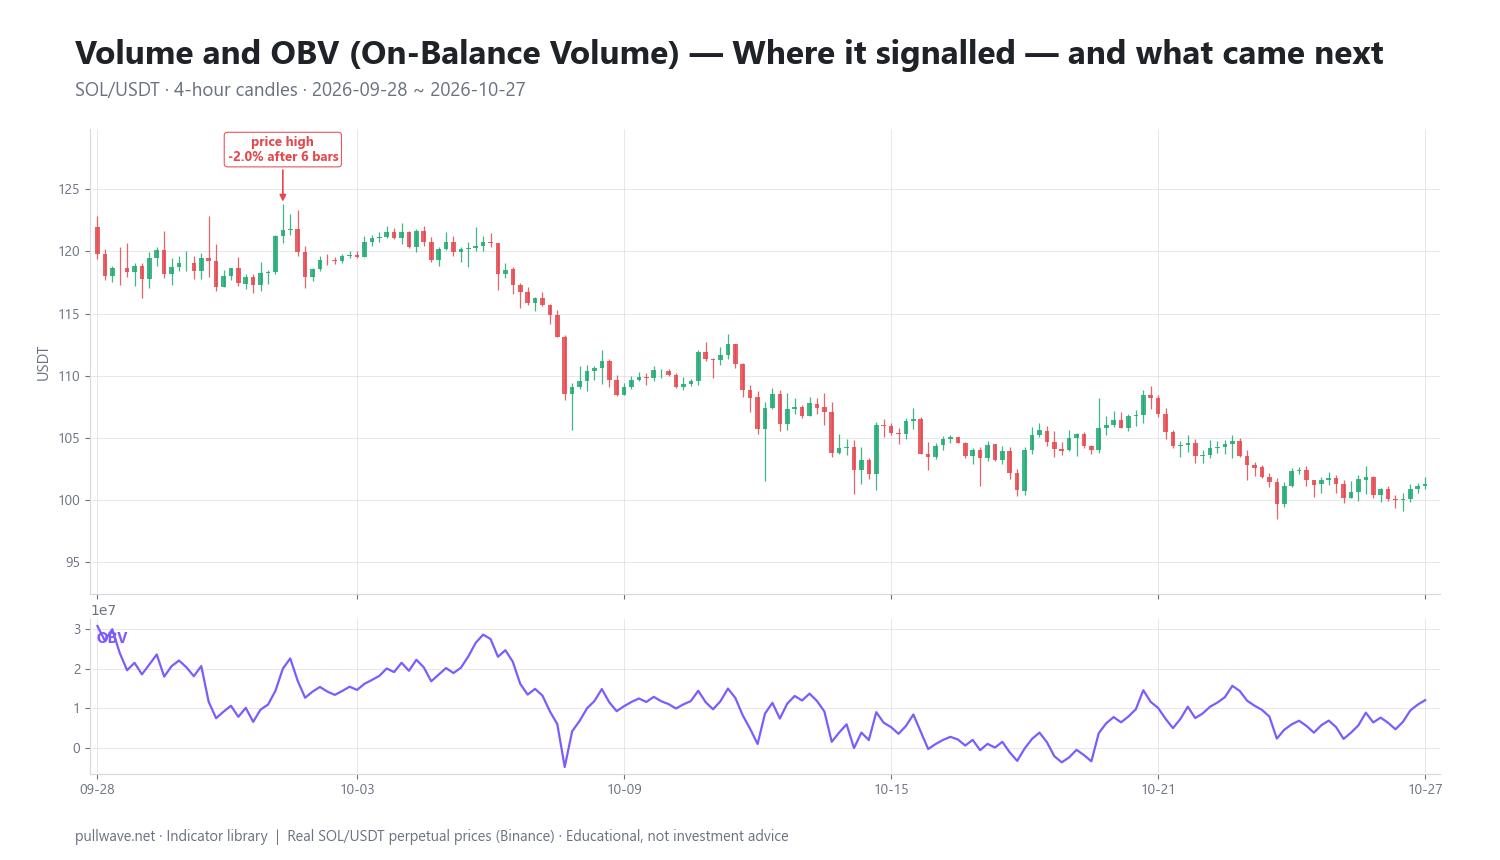
Figure 2 marks that high and labels the forward move after each of the two horizons. Read the result honestly: the short-horizon outcome was a modest decline, and the three-day outcome was essentially flat — price came back to almost exactly where it started. Over the full window the direction was clearly lower, but the path from that one marked bar was not a clean, immediate slide.
This is a single annotated point on a single pair in a single month. One observation cannot validate or invalidate an indicator, and nothing here implies the same sequence would repeat. The useful takeaway is structural rather than statistical: OBV's month-long decline of roughly 18.6 million units agreed with a 15.5% price decline, which is confirmation, not divergence. Confirmation is the common case; divergence is the exception you have to hunt for, and when you do find one, the lag between the warning and any price response can be long — as the near-flat 18-bar outcome here illustrates.
Common mistakes
- Reading the absolute level. The OBV number depends on the arbitrary start of your data. "OBV is at 48 million" means nothing without context.
- Trading divergence mechanically. Divergence is a condition, not a trigger. In strong crypto trends it can persist through multiple new highs.
- Ignoring where the volume came from. A single liquidation wick can dominate a month of OBV. Scroll back and check which bars produced the move in the line.
- Comparing OBV across exchanges. Crypto has no consolidated tape. OBV built from one venue's perpetual volume is a different series from one built on spot volume elsewhere, and reported volume quality varies by venue.
- Using it on very low timeframes. On 1m or 5m charts the sign of each bar is close to random, and OBV becomes noise.
- Forgetting that OBV ignores magnitude. A +0.02% close adds the same volume as a +12% close. If that bothers you, PVT or the Accumulation/Distribution Line is the better fit.
Combining it with other tools
OBV answers one question — is volume flowing with or against price — so pair it with tools that answer different questions.
- With trend tools (moving averages, higher-timeframe structure): use the trend tool to define the regime and OBV to grade the quality of moves inside it. OBV divergences carry more weight when the primary trend is already mature.
- With momentum oscillators (RSI, MACD): these measure the speed of price, OBV measures participation. When both disagree with price at the same extreme, the warning is better supported than either alone.
- With volatility tools (ATR, Bollinger Bands): volatility expansion plus rising OBV is a different picture from volatility expansion on flat OBV, which often marks exhaustion moves.
- With horizontal structure and volume profile: OBV says flow is building; volume profile and support/resistance say where. Together they are more actionable than either on its own.
- With funding and open interest in perpetuals: open interest tells you whether positions are being opened or closed, which OBV cannot distinguish. Rising OBV with rising open interest is a different story from rising OBV while open interest falls (short covering).
Frequently asked questions
Q. What is the best OBV setting for crypto?
Classic OBV has no period setting to tune — the formula uses only the close and the volume of each bar. The decisions that matter are timeframe (4h and daily are the usual choices for swing analysis, since lower timeframes produce near-random bar signs) and whether you overlay a moving average, commonly 20 periods, on the OBV line for a smoother reference.
Q. What does OBV divergence mean?
Divergence means price and OBV are making opposite structures: price prints a higher high while OBV prints a lower high, or price prints a lower low while OBV prints a higher low. It indicates that the latest price extreme was reached with less supporting volume flow than the previous one. It is a warning about the character of the move, not a timing signal, and it can persist for a long time before price responds — or never resolve at all.
Q. Is OBV a leading or lagging indicator?
Granville presented it as leading, on the theory that volume precedes price. In practice OBV is built entirely from completed bars, so it is contemporaneous at best and lagging when smoothed. It is more accurate to describe it as a confirmation tool that occasionally gives early warning through divergence.
Q. What is the difference between OBV and the Accumulation/Distribution Line?
OBV assigns the full bar volume a plus or minus sign based solely on whether the close was up or down from the previous close. The Accumulation/Distribution Line instead weights volume by where the close falls within the bar's high-low range, so a close in the middle of the range contributes little. A/D reacts to bar internals; OBV reacts only to close-to-close direction.
Q. Can OBV be used on perpetual futures?
Yes, and it is widely used there, but with caveats. Perpetual volume reflects leveraged position flow, including liquidations, so a single cascade bar can dominate the cumulative line. Perp volume also differs from spot volume on the same asset, so an OBV built on perps describes derivatives flow, not underlying ownership. Cross-checking with open interest helps separate new positioning from unwinding.
Q. Why does OBV look different on different charting platforms?
Because the starting value is arbitrary and depends on where the loaded data begins, the y-axis level will differ between platforms and between timeframes. The shape and slope should match if the volume source and timeframe are identical. Differences in exchange, in base versus quote volume, or in how equal closes are handled can also change the line.
Key takeaways
- OBV is a cumulative, signed volume total popularized by Joseph Granville in 1963; it adds full bar volume on up closes and subtracts it on down closes.
- Only slope, structure and agreement with price matter — the absolute level is arbitrary and should never be interpreted.
- Confirmation (OBV and price moving together) is the common and most reliable reading; divergence is a warning about move quality with no fixed time horizon.
- In the SOL/USDT 4h window shown, OBV fell by 18,630,199 while price fell 15.5% to a last close of 101.29 — clean confirmation — yet the single marked high at 121.71 was followed by only -2.0% after 6 bars and -0.05% after 18 bars. One illustration, not evidence.
- OBV's blind spots in crypto are liquidation-driven volume spikes, exchange-specific volume quality and its indifference to the size of a price change; pair it with trend, momentum and open-interest context rather than trading it alone.
Educational material. Charts use real SOL/USDT perpetual prices; past behaviour does not predict future results. Not investment advice.