Indicator & technique library · Indicator library
ATR Indicator Explained: Formula, Settings and Uses
At a glance
- ATR measures how much an asset typically moves per bar, not which way it is going.
- J. Welles Wilder Jr. introduced it in his 1978 book New Concepts in Technical Trading Systems.
- The default is 14 periods with Wilder's smoothing; ATR expressed as a percentage of price makes it comparable across assets and time.
- Traders mainly use it for stop distance, position sizing and spotting volatility expansion or contraction.
Average True Range (ATR) answers one narrow question: how far does this market typically travel in a single bar, including the part of the move that happens between bars? It is a volatility meter, nothing more. It has no bullish or bearish bias, it does not produce buy or sell signals on its own, and it will not tell you where a move ends.
That narrowness is exactly why it has survived since 1978. Almost every practical risk decision a trader makes — how wide a stop has to be to survive normal noise, how large a position can be before a routine wiggle becomes painful, whether a quiet market is coiling or a loud one is exhausted — depends on knowing the market's current "normal" movement. In crypto, where the same coin can swing 1% a day in one month and 8% a day in the next, that reference number matters more than in most markets.
What is ATR (Average True Range)?
ATR is a smoothed average of the "true range" of the last N bars, where true range is the largest of three distances: the current bar's high-to-low span, and the distance from the previous close to the current high or low. It is plotted as a single line in a separate pane below price, in the same units as price (dollars for SOL/USDT, not a 0–100 oscillator).
Because it is quoted in price units, a reading of 1.43 on SOL means "the typical 4-hour bar has covered about $1.43 of range recently." That number is only meaningful relative to price, which is why many traders convert it to a percentage: 1.43 on a close of 101.29 is roughly 1.41% per bar.
ATR rises when bars get longer or when prices jump between bars, and falls when bars get shorter. It rises in sharp sell-offs and in violent rallies equally — direction is invisible to it.
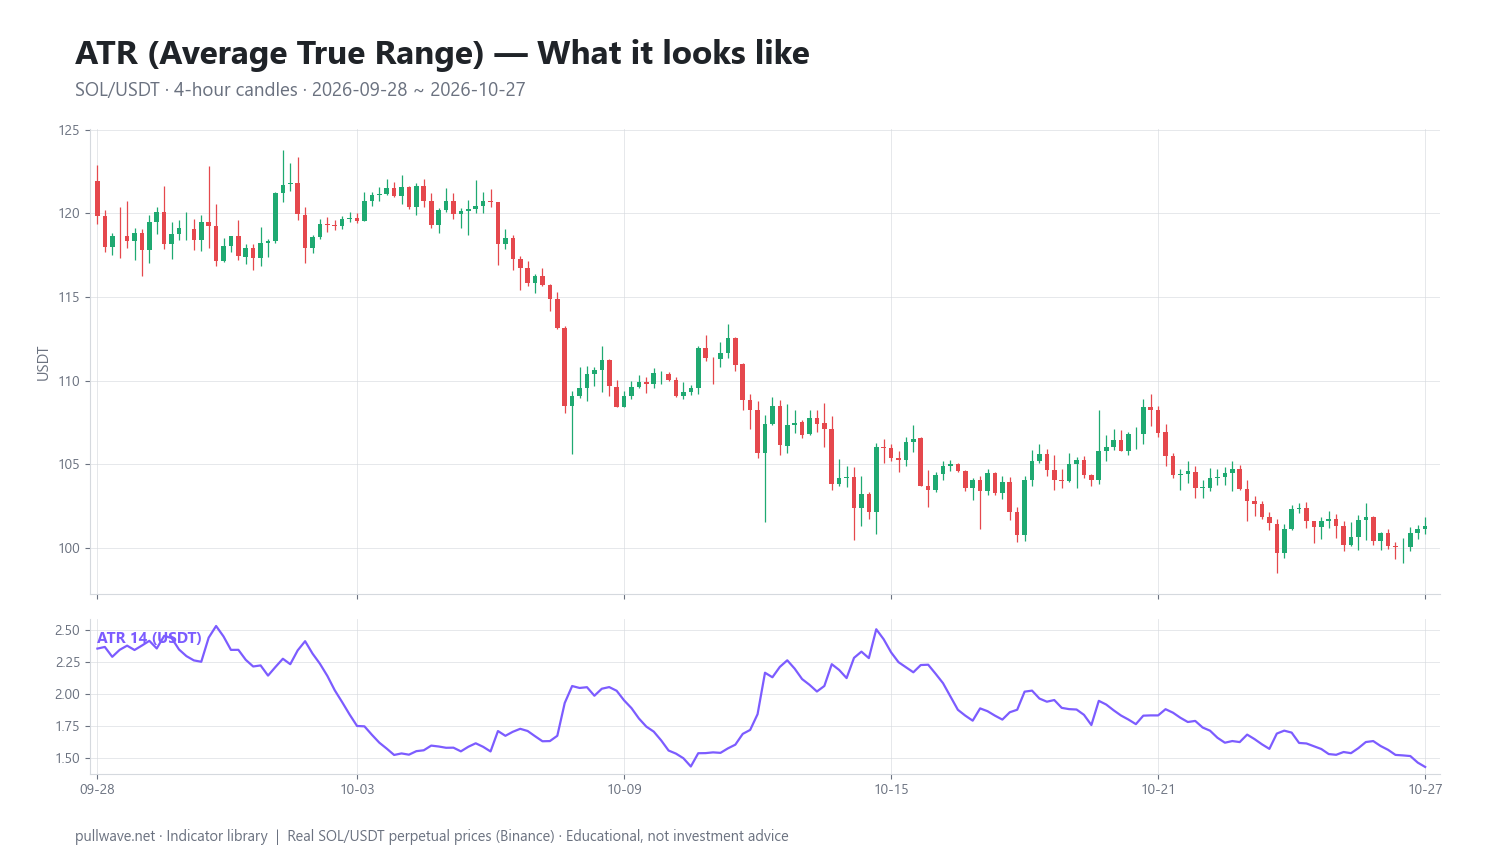
Figure 1 shows ATR(14) plotted under real SOL/USDT 4-hour candles for the window used later in this page. Notice how the line climbs as the candle bodies and wicks stretch out, and drifts lower through the calmer stretches, without ever indicating whether price is going up or down.
The idea behind it (theory and history)
ATR was introduced by J. Welles Wilder Jr. in his 1978 book New Concepts in Technical Trading Systems, the same book that presented RSI, the Directional Movement Index and ADX, and the Parabolic SAR. Wilder was designing systems for commodity futures, and he needed a volatility input for his trailing stop and trend-following rules.
The problem he was solving was specific to those markets. Commodity futures of that era traded limited sessions and frequently gapped — and in limit-move markets a contract could be locked up or down with a tiny high-to-low range despite an enormous price change. Measuring volatility with high minus low alone badly understated such days.
His fix was the true range: include the previous close in the measurement, so any gap between sessions is counted as part of the bar's movement. The concept is simple and it generalizes well beyond commodities.
The second idea is smoothing. A single bar's range is noisy; one fat candle tells you little. Averaging the last 14 true ranges gives a stable estimate of "current normal" that adapts over days rather than flipping bar to bar. Wilder used his own smoothing method (a running average that gives each new value a weight of 1/N), which reacts more slowly than a simple average of the same length.
How it is calculated
Step by step, for each bar:
- Compute the current bar's high minus low.
- Compute the absolute distance from the previous close to the current high.
- Compute the absolute distance from the previous close to the current low.
- True Range (TR) is the largest of those three numbers. It is always positive.
- The first ATR value is the simple average of the first 14 TR values.
- Every bar after that, update the running average using Wilder's smoothing.
``` TR(t) = max( High(t) - Low(t), abs(High(t) - Close(t-1)), abs(Low(t) - Close(t-1)) )
ATR(14) first value = ( TR(1) + TR(2) + ... + TR(14) ) / 14
ATR(14) at t = ( ATR(14) at t-1 * 13 + TR(t) ) / 14
ATR% = ATR / Close * 100 ```
Two details are worth internalizing. First, in a continuously traded market with no gaps, TR usually equals high minus low — the previous close sits inside the current bar's range. The second and third terms only bite after a gap or a violent opening move.
Second, Wilder's smoothing is equivalent to an exponential moving average with alpha = 1/14, which is roughly the same responsiveness as a 27-period EMA. Some platforms let you swap in a simple, exponential or weighted moving average of true range instead; values will differ slightly from Wilder's original, so compare like with like when reading other people's numbers.
Default settings and variations
| Setting | Typical value | Why / effect |
|---|---|---|
| Period | 14 | Wilder's default across his indicators; roughly two weeks of daily bars, long enough to smooth noise, short enough to adapt |
| Smoothing | Wilder (RMA) | Original method; slower and steadier than an EMA of the same length |
| Short period | 5–10 | Reacts faster to volatility bursts; noisier, useful for intraday scalping |
| Long period | 20–50 | Slower baseline; useful for position sizing on higher timeframes |
| Display | ATR, or ATR% of close | Percentage form makes readings comparable across price levels and assets |
| Stop multiple | 1.5× to 3× ATR | Common band for volatility stops; higher multiples survive more noise but cost more per trade |
There is nothing magic about 14. Wilder worked without computers and settled on a half-month cycle for his commodity work; the number stuck because his book became a standard reference. Shortening the period makes ATR respond faster to a volatility spike and decay faster afterward; lengthening it produces a calmer baseline that is better for sizing rules you want to keep stable.
The most useful variation is not the period at all — it is normalizing. ATR as a percentage of price (sometimes called ATRP) lets you say "SOL is moving 1.4% per 4-hour bar" instead of "$1.43," which stays meaningful when price doubles or halves.
How to read it
Read the ATR line in three ways: level, direction, and context.
- Level tells you current normal movement. Convert it to a percentage or to a multiple before judging whether it is high or low.
- Direction tells you whether volatility is expanding or contracting. Rising ATR means bars are getting bigger; falling ATR means the market is compressing.
- Context means comparing today's reading to its own recent range. In the SOL window used below, ATR% ranged from about 1.26% to 2.36% — so a reading near 1.3% is quiet for that market in that month, not quiet in any absolute sense.
A practical habit: never read ATR without asking "compared to what?" The same $1.50 ATR is a wide stop on a $400 asset and a suicide-tight stop on a $20 one.
Also remember the asymmetry of how volatility behaves. ATR tends to spike quickly and decay slowly, because one huge candle enters the average immediately but takes many bars to roll out of it. A high ATR reading often describes what just happened more than what is about to happen.
How traders use it
1. Setting stop distance. The most common use. Instead of a fixed percentage, the stop sits a multiple of ATR away from entry — commonly 1.5× to 3× — so it adapts automatically when the market gets louder or quieter. Works when you want a stop that survives routine noise and you are sizing to keep risk constant. Fails when liquidity is thin and a single wick blows through any sane multiple, or when a structural level (a prior swing low) is a better reference than a statistical one.
2. Position sizing. If stop distance is k × ATR and you cap loss per trade at a fixed amount, position size falls out directly:
Stop distance = k * ATR
Position size = (Capital at risk per trade) / (k * ATR)
This is where ATR earns its keep in leveraged crypto. When ATR% doubles, the same notional position has roughly double the chance of hitting your stop — and on perpetual futures, double the chance of touching a liquidation price. Sizing off ATR keeps dollar risk stable as the regime changes. It fails as a safety blanket if you ignore gap and slippage risk: a stop is not a guaranteed exit price during a cascade.
3. Reading volatility regimes and breakouts. A sustained ATR contraction means the market is coiling; expansion usually accompanies the resolution. Many breakout filters require that the breakout bar's range exceed some multiple of ATR, to reject feeble pokes through a level. Works in markets that alternate between compression and trend. Fails in choppy conditions where every expansion reverses, and it never tells you which direction resolves — pair it with structure.
4. Scaling targets and trailing stops. Profit targets expressed in ATR multiples (for example, a target at 2× the initial risk measured in ATR) keep expectations proportional to conditions. Trailing variants such as the Chandelier Exit trail a stop a fixed ATR multiple below the highest high since entry. Works in sustained trends. Fails in ranges, where an ATR trail gives back a large share of a short swing.
A fifth, quieter use: comparing assets. ATR% lets you see that one coin is moving 1.4% per bar while another is moving 4%, which is the honest way to compare risk between a large cap and a small cap.
Example on a real SOL chart
The window is SOL/USDT perpetual on Binance, 4-hour candles, 2026-09-28 through 2026-10-27, with ATR set to 14 periods using Wilder's smoothing. At the end of the window the last close was 101.29 and ATR read 1.43, which is 1.41% of price. Across the whole window ATR% moved between 1.26% and 2.36% — a fairly narrow band by crypto standards, meaning the market never went fully dormant and never went fully berserk.
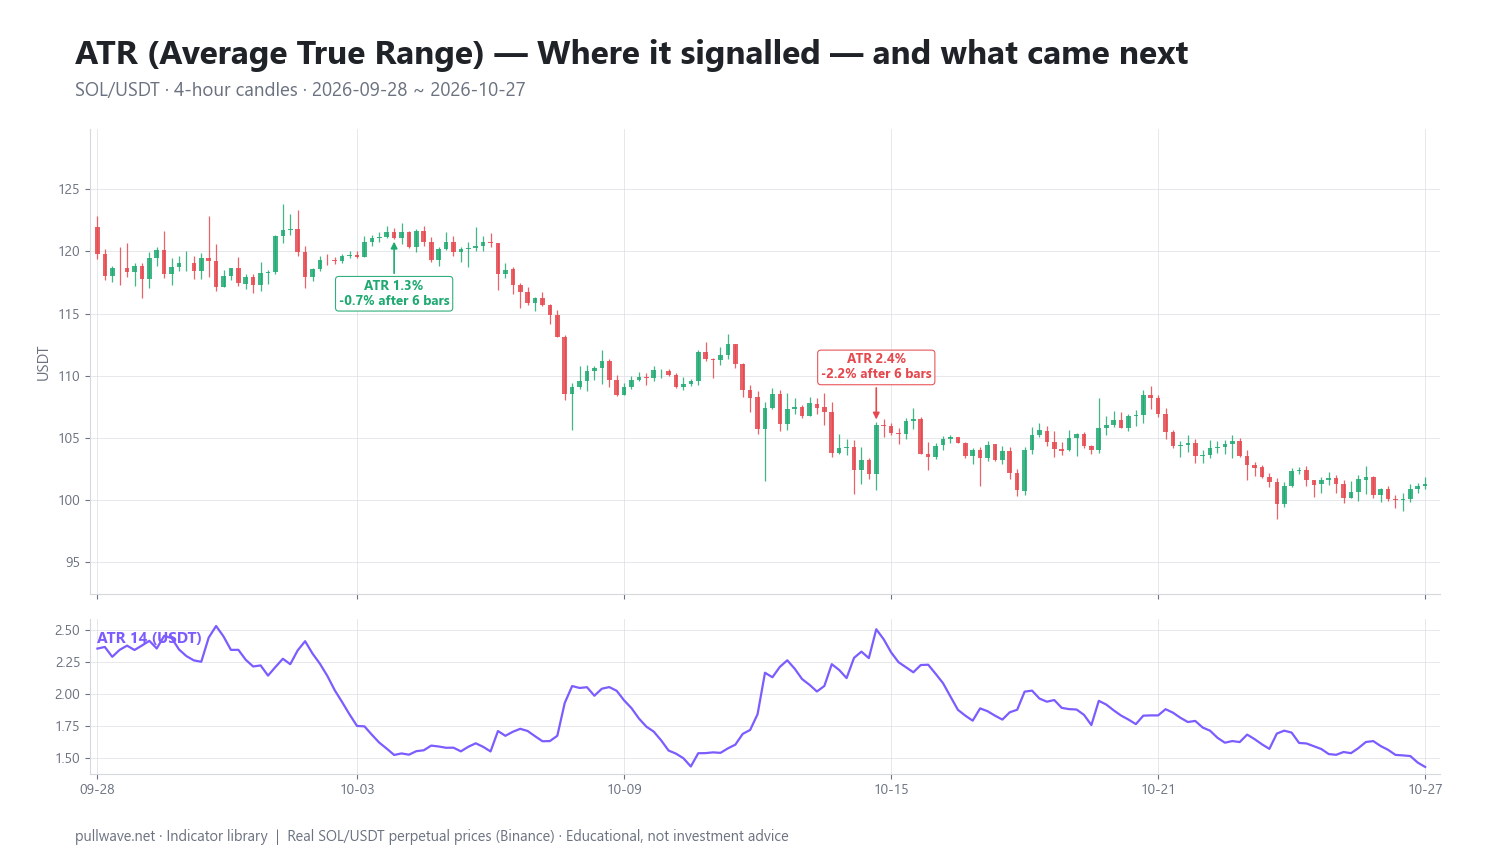
Figure 2 marks two reference bars on the same chart: one at the low end of the volatility band and one at the high end, with the percentage move measured 6 bars and 18 bars later (one day and three days on this timeframe).
- 2026-10-04 16:00 UTC — ATR 1.3%, price 121.05. Volatility near the quiet end of the range. Six bars later price was 0.69% lower; eighteen bars later it was 4.33% lower.
- 2026-10-15 12:00 UTC — ATR 2.4%, price 106.04. Volatility near the loud end of the range. Six bars later price was 2.19% lower; eighteen bars later it was 3.65% lower.
Two honest observations. First, both forward moves happened to be negative, but that is a property of this particular stretch of weakness — price went from 121.05 on 4 October to 101.29 at the end of the window — not something ATR predicted. ATR is directionless; with only two reference bars on one month of one market, nothing here is evidence about future direction.
Second, and more instructive: look at the raw dollar values implied by those readings. On the 4 October bar, ATR of about 1.3% at a price of 121.05 works out to roughly $1.57 in absolute terms. At the end of the window, ATR was $1.43 at a price of 101.29 — a lower dollar value but a higher percentage of price, 1.41%. A trader sizing positions off the raw number alone would have concluded volatility had fallen, when in percentage terms it had edged up. That is the single best argument for normalizing ATR before you use it in any rule.
Also note the practical consequence for stops in this window. With ATR% between 1.26% and 2.36% on 4-hour bars, a 2× ATR stop would have sat anywhere from about 2.5% to about 4.7% from entry depending on the day. A fixed 3% stop would have been generous in the quiet stretches and tight in the loud ones — exactly the problem ATR exists to solve.
Common mistakes
- Treating ATR as a directional signal. "ATR is rising, so the trend is strong" is wrong. ATR rises in crashes, in squeezes, and in liquidation cascades alike. Direction has to come from price structure or a trend tool.
- Comparing raw ATR across time or assets. As the SOL numbers above show, dollar ATR changes when price changes even if volatility does not. Normalize first.
- Using the wrong multiple for the timeframe. Volatility scales roughly with the square root of time, so a 4-hour ATR is far smaller than a daily ATR on the same market. Do not import a multiple that worked on daily charts into a 15-minute chart unchanged.
- Setting stops at exactly 1× ATR. By construction, the market covers about one ATR in a typical bar. A stop one ATR away is inside normal noise and will be hit often.
- Forgetting that ATR lags. It reacts to the bars already printed. After a single enormous candle, ATR stays elevated for many bars even if the market has gone quiet again — one reason some traders check both a fast and a slow ATR.
- Ignoring data quality. A single bad wick from a thin order book or an exchange anomaly inflates true range and distorts ATR for the next dozen bars. Cross-check against another venue if a reading looks absurd.
Combining it with other tools
ATR is a component, not a system. It pairs naturally with anything that supplies direction or location.
- With trend tools. Moving averages, market structure, or Wilder's own ADX give direction; ATR gives distance. A common structure is "enter on the trend condition, risk k × ATR, size accordingly."
- Inside volatility bands. Keltner Channels are built from a moving average plus and minus an ATR multiple. Supertrend and the Chandelier Exit are ATR-based trailing stops. If you use any of these you are already using ATR, whether or not the line is on your screen.
- Against standard-deviation volatility. Bollinger Bands measure dispersion of closes; ATR measures bar range including gaps. Comparing the two — for instance, narrow Bollinger width while ATR holds steady — can flag a market that is closing in a tight zone while still printing wide intrabar swings.
- With volume and open interest. On perpetual futures, an ATR spike alongside an open-interest drop usually describes forced liquidation rather than fresh positioning. Context changes how much weight you give the expansion.
- With funding and session context. Crypto trades 24/7, so true range rarely includes a classic gap — but weekend thinness, funding resets and macro releases still produce the kind of outsized bars ATR is designed to absorb.
Frequently asked questions
Q. What is the best ATR setting for crypto?
There is no single best setting; 14 periods with Wilder smoothing remains the sensible default and is what most charting platforms use. Shorter periods such as 7 or 10 react faster to volatility bursts, which some intraday traders prefer, while 20 or more gives a steadier baseline for position sizing. More important than the period is converting ATR to a percentage of price so readings stay comparable as the market moves.
Q. Does the ATR indicator show trend direction?
No. ATR only measures the size of recent price movement, never its sign, so it rises just as readily in a crash as in a rally. If you need direction, combine ATR with price structure, a moving average, or a directional indicator such as ADX/DMI.
Q. What ATR multiplier should I use for a stop loss?
Most traders work in the 1.5× to 3× ATR range. Below about 1.5×, the stop sits inside normal bar-to-bar noise and will be hit frequently; above about 3×, each trade costs more when wrong, so position size has to shrink accordingly. The right multiple depends on your timeframe, the market's character and how long you intend to hold, and it should be tested on your own data rather than adopted on faith.
Q. What is the difference between ATR and ATR percent?
ATR is quoted in the instrument's price units — for example, 1.43 dollars on SOL/USDT. ATR percent divides that by the current close, giving 1.41% in that example. The percentage form is what you need for comparing volatility across different assets or across periods when price has moved a lot, because the raw figure changes with price level alone.
Q. Is ATR the same thing as volatility?
It is one measure of volatility, not the only one. ATR captures average bar range including gaps, while standard-deviation measures like Bollinger Band width capture dispersion of closing prices, and implied volatility from options reflects expectations rather than history. They often move together but can diverge, particularly in markets that swing wildly intrabar yet close in a tight zone.
Q. Can ATR be used on any timeframe?
Yes, the calculation is identical on a 1-minute or a weekly chart, but the values are not interchangeable. Volatility scales roughly with the square root of time, so a 4-hour ATR is much smaller than a daily ATR on the same market, and any stop multiple or filter threshold has to be recalibrated when you change timeframe.
Key takeaways
- ATR, created by J. Welles Wilder Jr. in New Concepts in Technical Trading Systems (1978), measures the average true range of recent bars — how much a market moves, never which way.
- True range takes the largest of the bar's high-low span and the two distances from the previous close, so gaps and jumps are counted; Wilder's 14-period smoothing turns that into a stable estimate.
- Normalize to a percentage of price before judging a reading: in the SOL 4-hour window shown here, ATR of $1.43 was 1.41% of a 101.29 close, inside a band that ran from 1.26% to 2.36%.
- Its highest-value applications are stop distance and position sizing, especially on leveraged perpetual futures where volatility changes directly affect liquidation risk.
- ATR lags and never predicts direction, so it belongs alongside structure or trend tools rather than as a standalone signal; the two-event SOL illustration above is one window on one market and proves nothing about future outcomes.
Educational material. Charts use real SOL/USDT perpetual prices; past behaviour does not predict future results. Not investment advice.