Indicator & technique library · Indicator library
Volume Profile Explained: POC, Value Area and Settings
At a glance
- Volume Profile is a histogram of traded volume at each price level over a chosen window, not over time.
- The point of control (POC) is the price with the most volume; the value area usually covers 70% of it.
- High-volume nodes mark prices the market accepted; low-volume nodes mark prices it rejected quickly.
- It describes where business was done — it is context, not a signal generator, and it degrades in strong trends.
Most chart tools plot volume against time: one bar per candle, along the bottom of the screen. Volume Profile turns that sideways. It asks a different question — not when did people trade, but at which prices did they trade — and answers it with a horizontal histogram pinned to the price axis.
Traders care because price levels where large amounts of contracts or coins changed hands tend to behave differently from levels where almost nothing traded. A price that absorbed a lot of volume was, in auction language, accepted; a price the market flew through was rejected. Volume Profile gives you a map of both, which is why it is one of the few tools that is equally useful for judging where to place a stop, where to expect friction, and where not to expect any.
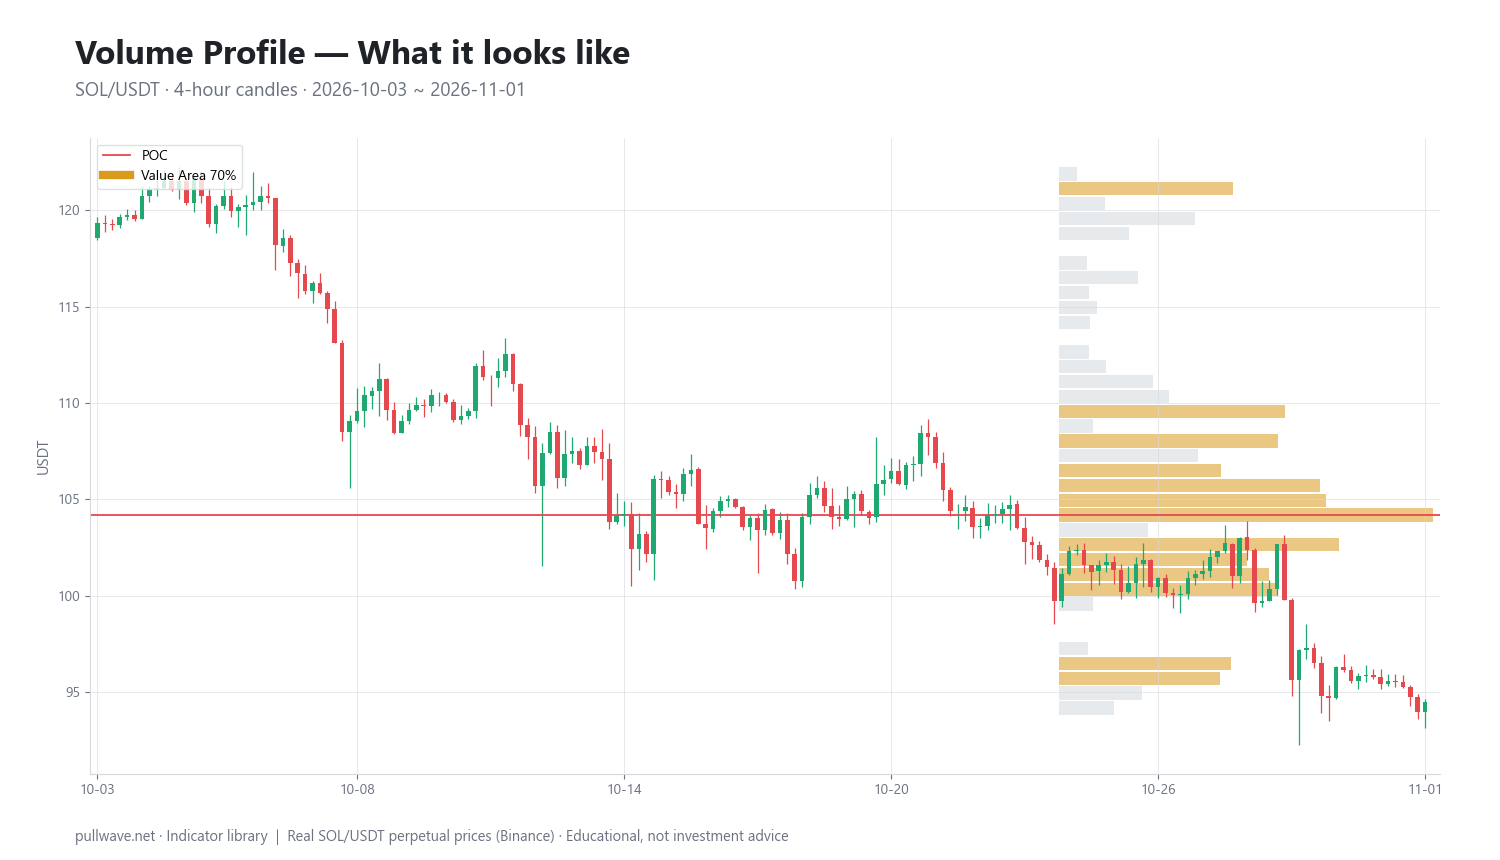
Figure 1 shows the indicator drawn on real SOL/USDT 4-hour candles: the candles on the left, the volume-at-price histogram on the right, with the widest row (the point of control) and the shaded value area marked.
What is Volume Profile?
Volume Profile is a histogram that splits a price range into horizontal rows (bins) and sums all the volume traded inside each row over a defined window of time. The result is drawn as bars extending sideways from the price axis, longest where volume was heaviest.
Three readings come out of it:
- POC (point of control) — the single price row with the most traded volume.
- Value area (VA) — the contiguous block of rows around the POC that contains a set percentage of total volume, conventionally 70%. Its edges are the value area high (VAH) and value area low (VAL).
- HVNs and LVNs — high-volume nodes (local peaks in the histogram) and low-volume nodes (local troughs).
It is a descriptive tool. It does not predict; it summarizes where the auction spent its effort. Note also that it is time-agnostic: the histogram tells you how much volume occurred at a price, never at what point in the window it occurred.
The idea behind it (theory and history)
The conceptual parent is Market Profile, developed by J. Peter Steidlmayer, a trader and board member at the Chicago Board of Trade, and released by the CBOT in the mid-1980s as an information product. Market Profile organizes the day's trade into letters (TPOs, time-price opportunities), building a bell-shaped distribution that shows how much time the market spent at each price. Steidlmayer set out his thinking with Kevin Koy in Markets and Market Logic (1986).
The underlying model is auction theory: a market moves up to find sellers and down to find buyers, and between those extremes it rotates around a price area where both sides agree to do business. That agreement area is "value." When the market trades away from value and does not generate activity there, it typically returns; when it trades away and volume builds at the new prices, value migrates.
Volume Profile is the volume-weighted version of the same idea. The CBOT's Liquidity Data Bank made actual volume-at-price data available from clearing records, and once retail charting software could process tick data, plotting real volume per price row became straightforward. There is no single named inventor of the modern "VPVR" drawing you see in charting platforms — it is a software-era refinement of Steidlmayer's framework, and anyone who tells you otherwise is guessing.
The 70% value area is not arbitrary: in a normal distribution, roughly 68% of observations fall within one standard deviation of the mean. Market Profile rounded that to 70% as a workable approximation of the first standard deviation of the day's distribution.
How it is calculated
Step by step:
- Choose the window. A single session, a week, a visible range, a fixed date range, or an anchor point such as a swing high. Everything downstream depends on this choice.
- Find the price range of that window: the highest high and the lowest low.
- Split the range into N rows of equal height. Row height = (high − low) / N.
- Distribute each bar's volume into rows. With tick or trade data, every trade goes into the row containing its exact price. With OHLC candles you need an approximation: either spread the candle's volume evenly across all rows its range touches, or assign the whole candle's volume to its typical price, (H + L + C) / 3. The example in this page uses the typical-price method.
- Sum per row to get the histogram.
- POC = the row with the largest total.
- Value area: start with the POC row's volume. Look at the two rows above and the two rows below the current block; add whichever pair holds more volume. Repeat until the accumulated total reaches 70% of the window's volume. The highest and lowest rows included are VAH and VAL.
``` h = (P_high - P_low) / N # row height, N bins V[i] = SUM(volume of bars whose typical price falls in row i) TOT = SUM(V) p = index of row with max(V[i]) # POC row
value area: standard two-up / two-down expansion from the POC row
lo = hi = p acc = V[p] while acc < 0.70 * TOT: up = V[hi+1] + V[hi+2] # pair of rows above the block down = V[lo-1] + V[lo-2] # pair of rows below the block if up >= down: hi += 2; acc += up else: lo -= 2; acc += down
VAH = upper edge of row hi VAL = lower edge of row lo ```
Two caveats on that code. It is the conventional greedy expansion, not an optimizer: it does not guarantee the smallest contiguous block containing 70% of volume, and platforms differ slightly in how they handle the edges of the range and the final partial step. And step 4 has a real consequence — a profile built from 4-hour candles is a coarse estimate of a profile built from ticks, so the POC can shift by a row or two between methods. Treat levels as zones, not as prices to the cent.
Default settings and variations
| Setting | Typical default | Why / variation |
|---|---|---|
| Row count | 24–100 (40 is a common middle) | More rows = finer detail but noisier LVNs; fewer rows = smoother, more robust nodes |
| Value area | 70% | Approximates one standard deviation; some platforms offer 68% or 80% |
| Volume assignment | Tick data, else typical price or uniform spread | Tick is most accurate; typical price is cheap and stable |
| Window type | Session, fixed range, visible range (VPVR), anchored | Session profiles suit futures with a clear open/close; fixed and anchored suit 24/7 crypto |
| Up/down split | Off by default | Splits each row into buy-side and sell-side volume (delta profile) |
In crypto the session concept is weak — there is no close, no bell, no overnight gap. A "daily" profile in crypto is just a UTC-midnight convention. That is why most crypto traders use fixed-range profiles (over a defined consolidation, a move, or a month) or anchored profiles starting at a significant high, low, or event. Visible-range profiles are convenient but change every time you scroll or zoom, which makes them unsuitable for any kind of record-keeping.
How to read it
Start with the shape, not the levels.
- D-shape (balanced): a single fat middle, thin edges. The market is rotating; value is established; edges tend to attract responsive selling and buying.
- P-shape: thin at the bottom, fat at the top. Volume concentrated near the highs of the range, with little accumulated below.
- b-shape: fat at the bottom, thin above. Volume concentrated near the lows, with the upper part of the range thinly traded.
- Bimodal / double distribution: two fat areas separated by a thin middle. The thin middle is often the most useful level on the chart: it is the price range almost nobody wanted.
Then read the nodes. HVNs are areas of agreement; price tends to slow, chop, and get stuck there. LVNs are areas of disagreement; price tends to pass through them fast, and when it comes back it often either rejects cleanly or accelerates to the next HVN.
Finally, locate current price relative to VAH, POC, VAL. Inside the value area means balance. Outside means the market is either exploring a new range or in an imbalance that has not yet resolved. To know when the volume at any level was traded, you have to look at the candles — the histogram cannot tell you.
How traders use it
1. Fading the value area edges in balance. When the market is clearly rotating, VAH and VAL act as the practical boundaries of the range and the POC as the magnet in the middle. A Market Profile heuristic known as the 80% rule observes that when price opens outside value, re-enters, and holds inside for two consecutive periods, it often traverses the value area. Works: in confirmed balance, low-volatility stretches. Fails: on the first day of a trend, when the "edge" becomes the launchpad instead of the ceiling.
2. LVNs as decision levels. Place reference lines in the histogram's thin spots. If price enters an LVN and stalls, the market is rejecting it; if it accelerates, the imbalance is continuing. Works: with well-formed bimodal profiles that have an obvious gap. Fails: with too many rows, where every third row is a "thin spot" and the level count becomes meaningless.
3. Naked POCs as reference areas. A POC from a previous profile that price has never traded back to remains an untested area of heavy prior activity. Many traders mark these as context for where a pullback might find friction. Works: in ranging and mean-reverting regimes. Fails: in sustained trends, where naked POCs can sit untouched for months.
4. Trade location and stop placement. Independently of entry logic, profiles answer "is my stop sitting inside a thick HVN where price will grind over it, or just beyond an LVN where a move away is likely to be quick?" This is probably the least glamorous and most durable use of the tool.
Regime matters more than settings. In a directional trend, value migrates continuously and any composite profile built from the previous range goes stale fast. Volume Profile is at its best when the market is deciding, and at its weakest when the market has already decided.
Example on a real SOL chart
The window is SOL/USDT perpetual on Binance, 4-hour candles, 2026-10-03 to 2026-11-01. Settings: 40 price bins, volume assigned to each candle's typical price, value area 70%.
The profile over that month produced:
- POC: 104.18
- Value area high: 121.50
- Value area low: 95.33
- Last close in the window: 94.51
Two things stand out. First, the value area is wide — about 26.2 points, roughly a quarter of the POC price. That is a month in which the auction did business across a very broad band rather than settling into a tight range; on a 4-hour chart of a high-beta asset this is normal, but it means the "edges" are coarse references, not precise lines.
Second, the POC at 104.18 sits below the midpoint of the value area (about 108.4). The only thing that tells you is that more volume accumulated in the lower half of the band than in the upper half. The profile is time-agnostic, so it cannot say when in the month that volume was traded — whether the heavy activity at 104 came early, late, or in scattered visits. Answering that requires reading the candles alongside the histogram.
The final close of 94.51 is below the value area low of 95.33 — by under 1% — and roughly 9% below the POC. Read literally, that is a market finishing the window just outside the lower edge of its own month-long value, with a thick shelf of prior activity overhead. What it is not is a signal: a close marginally outside value can mean a breakdown in progress, or an overshoot that gets reclaimed in the next few bars. Volume Profile does not distinguish between the two; it only tells you the close happened at a price the month treated as cheap.
It is worth being explicit about what this window did not deliver. The scan was configured to log discrete events — acceptance outside value, value-area reclaims — and to measure the forward outcome 6 bars (one day) and 18 bars (three days) later. In this window it logged zero events. There is therefore no hit rate, no average move, nothing to report. One market, one month, one setting combination: this figure illustrates how the levels are constructed and where price finished relative to them, and nothing more. Do not read it as evidence that the tool works, or that it doesn't.
Common mistakes
- Treating rows as exact prices. A row is (high − low)/N wide. With 40 bins over a 60-point range, each row is 1.5 points thick. The POC is a zone.
- Using visible-range profiles for analysis you intend to keep. VPVR recalculates as you scroll. A level you "found" at one zoom level may not exist at another, and reviewing history with it is a straightforward way to fool yourself.
- Too many rows. Pushing the bin count up makes the histogram look precise and makes LVNs appear everywhere. Fewer rows, more reliable nodes.
- Reading time into the histogram. A fat row says volume accumulated there; it says nothing about whether that happened in one violent hour or across twenty quiet sessions. Those are different situations and only the candles distinguish them.
- Mixing venues. A profile from one exchange's perpetual is not the same as one from spot or from another venue. Levels drawn from an illiquid book describe that book, not the asset.
- Mistaking liquidation volume for acceptance. A cascade can print enormous volume across prices nobody willingly transacted at. The histogram cannot tell forced flow from voluntary flow; your eyes on the candles can.
- Assuming the POC must be revisited. It often is. "Often" is not "must," and in trends it may not be for a very long time.
Combining it with other tools
Volume Profile supplies location. It pairs naturally with tools that supply direction or timing.
- VWAP (session or anchored, with standard deviation bands) answers a similar question from a different angle — average transacted price rather than distribution of it. When an anchored VWAP and a POC coincide, the level is doing double duty.
- Open interest and funding on perpetuals add the positioning layer. Price pressing an LVN with open interest climbing and funding stretched is a different situation from the same move with open interest falling.
- Higher-timeframe structure. Use a monthly or quarterly fixed-range profile for context and an intraday profile for execution detail. Levels that line up across both deserve more attention.
- ATR for sizing stops relative to the width of a node, so you are not placing an exit inside a 3-point-thick HVN with a 1-point stop.
- Simple trend filters (a long moving average, or a higher-high/higher-low read) to decide whether fading value edges is appropriate at all, or whether only trades aligned with the migration make sense.
Avoid stacking Volume Profile with three other volume-derived tools. They will agree with each other and give you false confidence.
Frequently asked questions
Q. What is the POC in volume profile?
The POC, or point of control, is the price row where the most volume traded during the chosen window. It represents the price at which buyers and sellers did the most business, and it is commonly used as a reference for where price may find friction or attraction. It shifts if you change the window, the bin count, or the volume-assignment method.
Q. What is the difference between Volume Profile and Market Profile?
Market Profile, developed by J. Peter Steidlmayer and published by the CBOT in the 1980s, measures how much time the market spent at each price using TPO letters. Volume Profile measures how much volume traded at each price. They often produce similar shapes, but they can diverge sharply — for example when a single large trade prints heavy volume at a price the market only touched briefly.
Q. What are the best volume profile settings for crypto?
There is no universally best setting, but a moderate bin count (roughly 24–50 rows) with the standard 70% value area is a sensible starting point, applied to a fixed or anchored range rather than a visible range. Because crypto trades 24/7 with no session close, daily session profiles are an arbitrary UTC convention; profiles anchored to a swing, a consolidation, or a specific event usually describe the auction better.
Q. Does volume profile repaint?
A fixed-range or session profile does not repaint once its window is closed — the histogram is final. A visible-range profile (VPVR) recalculates constantly as you scroll or zoom, so its POC and value area change, and it should not be used to evaluate historical signals.
Q. Which timeframe should I build a volume profile on?
The timeframe affects accuracy, not the concept: finer data (ticks, or 1–5 minute candles) distributes volume into rows more precisely than 4-hour candles do. Choose the window to match your holding period — a few days for intraday work, several weeks or months for swing context — and use the lowest-timeframe data your platform can handle to build it.
Q. Can volume profile be used on altcoins with low liquidity?
It can, but the output is only as meaningful as the volume behind it. On thin markets a handful of large orders can create an artificial POC, and exchange-specific or incentivized volume distorts the histogram further. Cross-check against a more liquid venue or a larger-cap pair before relying on a level.
Key takeaways
- Volume Profile plots traded volume by price instead of by time, producing a POC, a value area (usually 70% of volume), and a map of high- and low-volume nodes.
- Its roots are in J. Peter Steidlmayer's Market Profile and auction market theory: markets rotate around prices both sides accept and move quickly through prices they reject.
- The histogram is time-agnostic — it shows where volume accumulated, never when — so it must be read alongside the candles.
- Levels depend entirely on your window, bin count, and volume-assignment method; change any of them and the levels move, so treat them as zones.
- The SOL/USDT example (POC 104.18, VAH 121.50, VAL 95.33, last close 94.51, zero logged events) illustrates construction and placement only; it is one market over one month and proves nothing about edge.
Educational material. Charts use real SOL/USDT perpetual prices; past behaviour does not predict future results. Not investment advice.