Indicator & technique library · Indicator library
ROC and Momentum Explained: Formula, Settings, Signals
At a glance
- Momentum subtracts the close n bars ago from today's close; ROC expresses the same distance as a percentage.
- The zero line is the whole signal structure: above zero means price is higher than n bars ago, below zero means lower.
- Common lookbacks are 9, 10, 12, 14, 20 and 25 periods; shorter means faster and noisier, longer means smoother and later.
- ROC is unbounded, so 'overbought' levels must be read relative to recent history, not against fixed thresholds.
Rate of Change (ROC) and Momentum are the two simplest momentum oscillators in technical analysis. Both answer one question: how far is price today compared with where it was n bars ago? Momentum answers in price units, ROC answers in percent. Everything else — the zero line, divergences, the shape of the curve — follows from that single subtraction.
Traders care about them because almost every more complex oscillator is built on this foundation. MACD, TRIX, the Coppock Curve, Pring's Know Sure Thing and Chande's Momentum Oscillator are all transformations of raw rate of change. Understanding ROC properly means you understand what the fancier tools are actually measuring, and where their blind spots come from.
What is ROC and Momentum?
The Momentum indicator is the difference between the current close and the close n periods earlier. If SOL closes at 100 today and closed at 90 twelve bars ago, 12-period Momentum is +10.
Rate of Change (ROC) normalizes that difference by the earlier price and multiplies by 100, giving +11.11% for the same example. Because it is a percentage, ROC is comparable across assets and across price levels — a 10-point move in SOL at $20 and at $200 are very different things, and ROC knows that while Momentum does not.
Both are plotted as a line oscillating around a center: zero for Momentum and percentage ROC, or 100 for the "ratio" version of ROC that some platforms use. Neither has an upper or lower bound. In a violent crypto expansion, ROC can print values that would be unthinkable in an equity index.
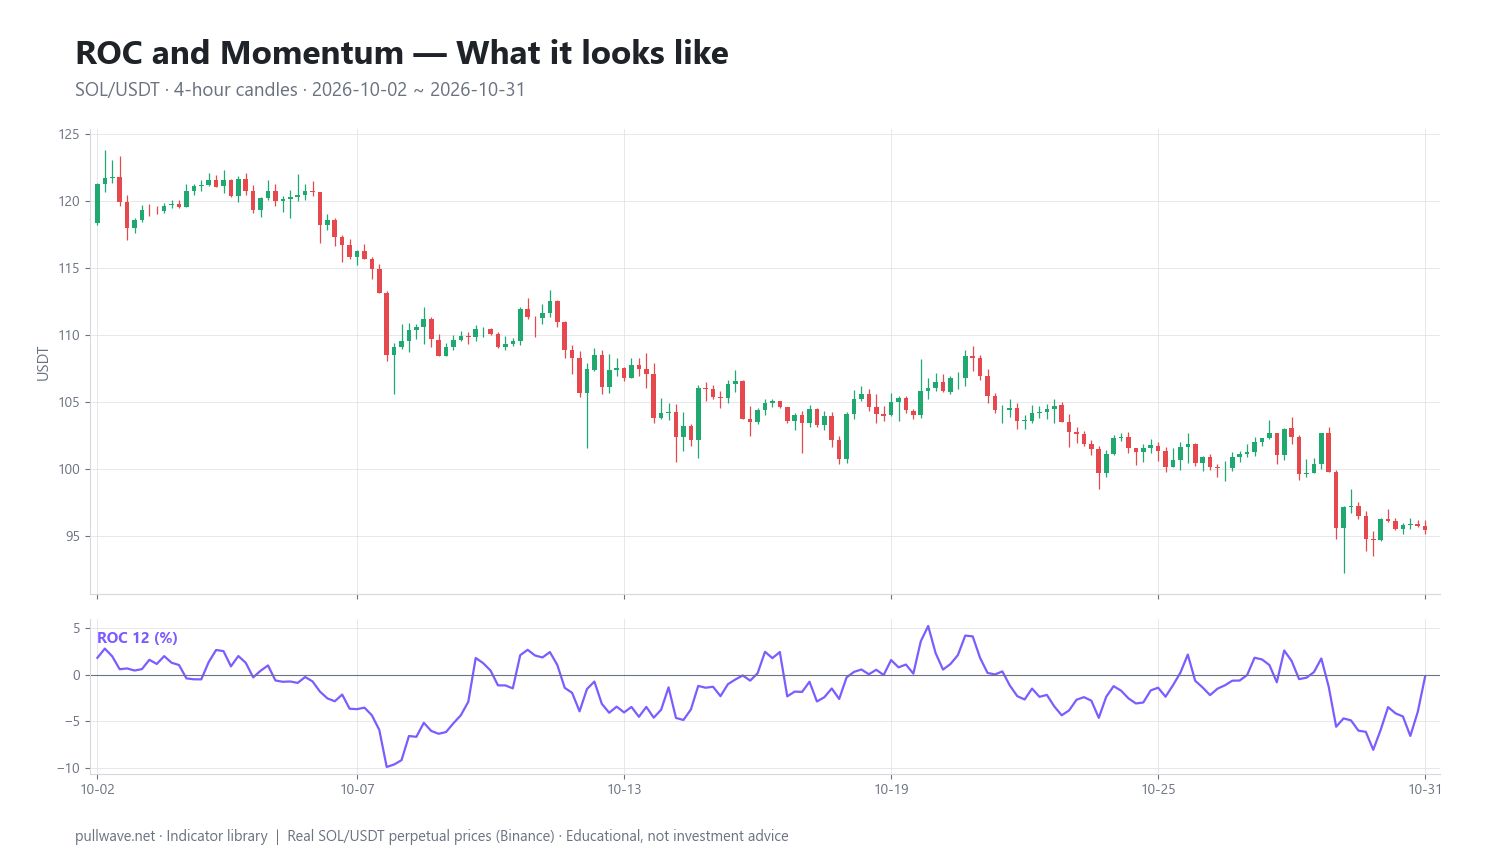
Figure 1 shows 12-period ROC plotted beneath SOL/USDT perpetual 4-hour candles for October 2026. Notice the shape: the line crosses its zero level repeatedly, spends little time at extremes, and compresses toward zero whenever the candles go sideways. That behavior is the indicator working correctly, not failing.
The idea behind it (theory and history)
Rate of change has no single documented inventor. It predates most named oscillators and appears in technical analysis literature from the middle of the twentieth century onward, simply because subtracting an old price from a new one is the most obvious way to quantify "speed." Early chartists used it to time cycles in equity indices long before computers made indicator plotting routine.
Two well-documented descendants anchor the history. Edwin Coppock published the Coppock Curve in Barron's in 1962 — a weighted moving average of the sum of two rate-of-change calculations, designed as a long-term buying guide for equity indices. Martin Pring later made rate of change a centerpiece of Technical Analysis Explained and built his Know Sure Thing (KST) oscillator by summing four smoothed ROCs of different lengths.
The theory is straightforward. Price trends are not uniform: they accelerate, cruise, then decelerate before reversing. Rate of change measures the first derivative of price — the speed. When speed falls while price still rises, the trend is losing fuel. That deceleration often, though not reliably, precedes a turn.
It is worth separating this from academic momentum. The cross-sectional momentum effect documented by Jegadeesh and Titman in the Journal of Finance in 1993 ranks many assets by their past 3–12 month returns and buys the winners. That is the same arithmetic as ROC applied across a universe of assets rather than along a single chart. The conceptual link is real; the trading application is different.
How it is calculated
Step by step, for a lookback of n bars:
- Take the current closing price.
- Take the closing price n bars ago.
- Subtract the old close from the current close. That is Momentum.
- Divide that difference by the old close.
- Multiply by 100. That is ROC in percent.
``` Momentum(n) = Close[0] - Close[n]
ROC(n) % = (Close[0] - Close[n]) / Close[n] * 100
ROC ratio = Close[0] / Close[n] * 100 (centered on 100) ```
A worked example from the window used later on this page: on the 4-hour SOL/USDT chart the final close was 95.44 and 12 bars earlier (two days, since 12 × 4h = 48h) price was almost identical, giving ROC(12) = -0.19%. Price had effectively gone nowhere over two days despite movement in between — exactly the information ROC is designed to compress into one number.
Two mechanical points matter. First, ROC uses only two data points; every bar in between is ignored. A clean trend and a violent round trip that happens to end at the same place produce the same reading. Second, the indicator changes for two reasons — the new close moving, or the old close dropping out of the window. A large bar falling out of the lookback can flip ROC without any fresh price action at all. This is sometimes called the "drop-off effect" and it is the single most misunderstood feature of the tool.
Default settings and variations
There is no canonical default. Charting platforms ship with 9, 10, 12 or 14 depending on the vendor. The common lengths come from calendar logic in the equity world: 12 and 25 periods approximated roughly half a month and a full month of trading days, while 10 was simply a round number that survived into software defaults.
| Lookback | Character | Typical use |
|---|---|---|
| 5–9 | Very fast, many zero crossings | Short-term swing timing, scalping context |
| 10–14 | Balanced; 12 is the most common | General-purpose momentum reading |
| 20–25 | Smoother, fewer signals, later | Intermediate trend confirmation |
| 50–200 | Regime measurement | Bull/bear context, relative strength screens |
The lookback is not a magic number — it defines which cycle you are measuring. A 12-bar ROC on a 4-hour chart measures two-day momentum. The same 12 on a daily chart measures roughly two and a half weeks. Always translate the setting into wall-clock time before judging whether it fits your holding period.
Useful variations:
- Smoothed ROC: apply a 3–10 period moving average to the ROC line to suppress whipsaw, accepting extra lag.
- Signal line: plot a moving average of ROC and watch crossings of that line rather than zero.
- Volatility-normalized ROC: divide ROC by ATR percentage or by the standard deviation of returns, so a +4% reading means something consistent in both quiet and explosive regimes. This is especially useful in crypto.
- Multi-length composites: KST and the Coppock Curve sum ROCs of different lengths to capture several cycles at once.
How to read it
Start with the zero line. ROC above zero means price is higher than it was n bars ago; below zero means lower. That is a factual statement about the lookback window, not a forecast.
Then read the slope. A rising ROC above zero means the advance is accelerating. A falling ROC that is still above zero means price is still up over the window but gaining more slowly — deceleration. The sign tells you direction; the slope tells you whether the move is gaining or losing energy.
Then read the magnitude relative to recent history. Because ROC is unbounded, there is no universal overbought level. A ±3% reading may be extreme for 12-period ROC on a 4-hour chart in a quiet month and completely ordinary during a liquidation cascade. Most practitioners draw reference bands by eye at levels that contained roughly 90–95% of readings over the last several months, and redraw them as volatility regimes change.
Finally, look for divergence: price makes a higher high while ROC makes a lower high, or price makes a lower low while ROC makes a higher low. Divergence says the second leg was slower than the first. It is a warning about trend quality, not a timing trigger, and in strong crypto trends divergences can repeat several times before anything happens.
How traders use it
1. Zero-line bias as a trend filter. The simplest application is treating ROC above zero as an up-bias and below zero as a down-bias, then only taking setups from other tools that agree with the sign. This works reasonably well in persistent trends, where ROC stays on one side of zero for long stretches. It fails badly in ranges, where price oscillates around a mean and ROC flips sign constantly. The October 2026 SOL window below produced 23 zero-line crossings in a single month — a textbook example of a filter being shredded by chop.
2. Momentum extremes in a range. When a market is clearly range-bound and ROC reaches the upper or lower edge of its recent distribution, traders watch for mean reversion back toward the middle of the range. This can work while the range holds. It is the most dangerous use of ROC the moment a range breaks, because a breakout produces an extreme ROC reading and continues — selling "extreme" momentum into the start of a trend is a classic way to be run over.
3. Divergence as a trend-quality check. Many traders use ROC divergence not to enter counter-trend positions but to downgrade an existing one: tighten management, reduce size, stop adding. Framed this way, divergence has value even though its standalone hit rate is poor. It fails when a trend is powered by continuous new participation, as in a strong crypto bull leg, where momentum can stay flat while price keeps climbing for weeks.
4. Relative strength across assets. Computing the same ROC length across several coins ranks them by recent performance. This is the closest practical cousin to academic momentum and is widely used for rotation and watchlist construction. It works best over longer lookbacks (weeks to months) and breaks down during correlated market-wide crashes, when every asset's ROC turns negative at once and ranking carries little information.
Crypto specifics. Markets run 24/7, so a 12-period ROC on a 4-hour chart is exactly 48 hours with no weekend gaps — cleaner than in equities. But perpetual futures add funding-driven squeezes that produce violent, short-lived ROC spikes with no follow-through. On leveraged positions, a momentum reading says nothing about your liquidation distance; position sizing must come from volatility and account risk, never from how strong an oscillator looks.
Example on a real SOL chart
The window below is SOL/USDT perpetual on Binance, 4-hour candles, from October 2 to October 31, 2026, with ROC set to 12 periods in percentage mode. The final close in the window was 95.44 and the final ROC(12) reading was -0.19%.
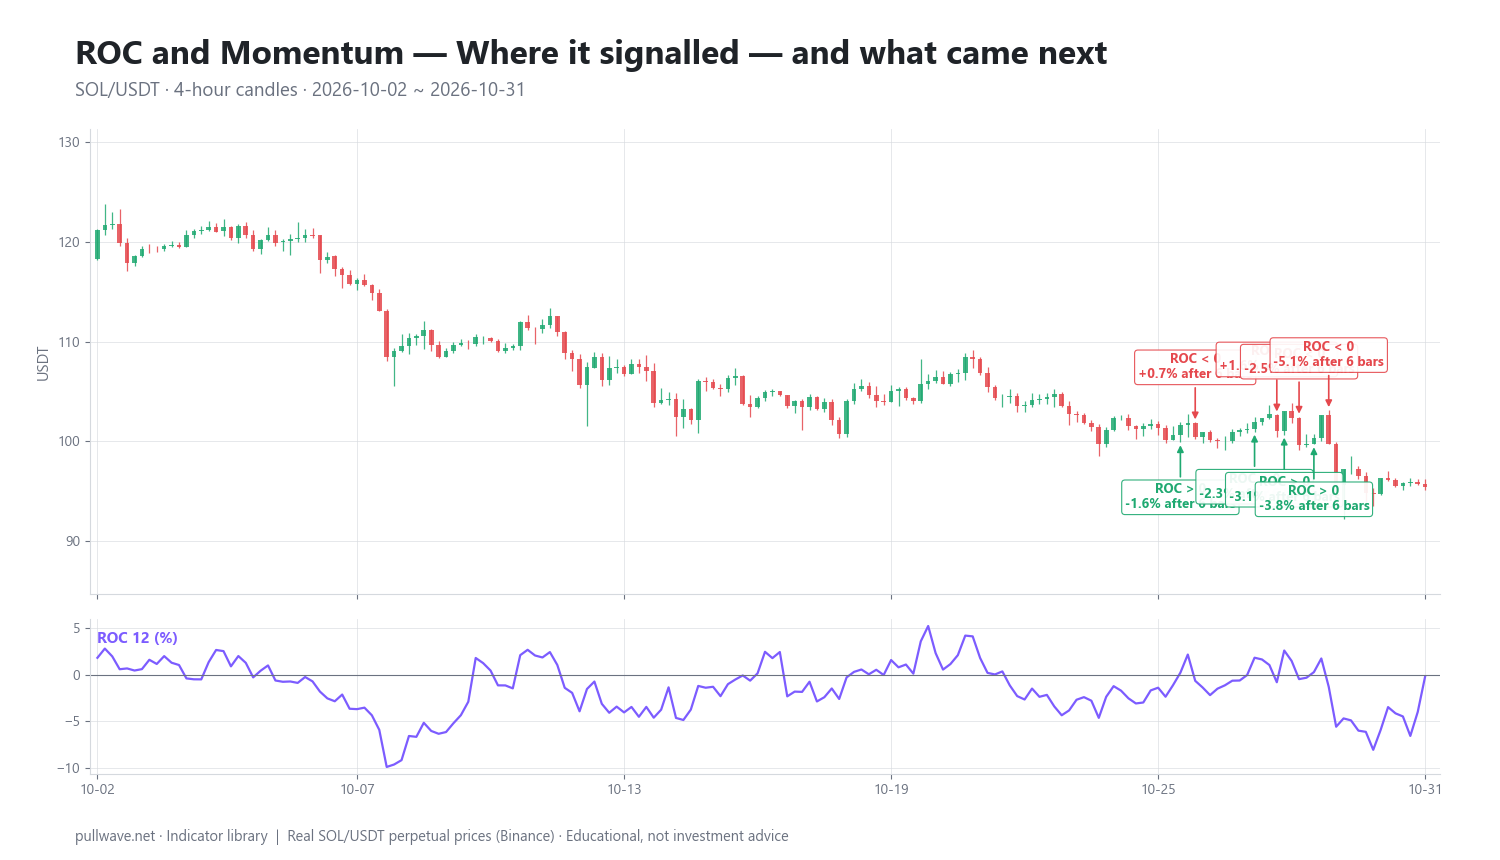
Figure 2 marks every zero-line crossing in the window and the percentage move that followed after 6 bars (one day) and after 18 bars (three days). Across the whole month there were 23 crossings, and price moved in the direction implied by the crossing after the measured horizon in 10 of those 23 cases. That is less than half — and it should be reported as what it is: a losing hit rate for a naive zero-cross rule in a sideways, downward-drifting month.
Here are ten of those signals in detail:
| Date (UTC) | Signal | Price | After 6 bars | After 18 bars |
|---|---|---|---|---|
| 2026-10-19 20:00 | ROC > 0 | 105.03 | +1.37% | -1.34% |
| 2026-10-22 12:00 | ROC < 0 | 104.58 | +0.14% | -2.86% |
| 2026-10-26 08:00 | ROC > 0 | 101.67 | -1.56% | -1.31% |
| 2026-10-26 16:00 | ROC < 0 | 100.43 | +0.68% | -0.65% |
| 2026-10-28 00:00 | ROC > 0 | 101.99 | -2.30% | -5.72% |
| 2026-10-28 12:00 | ROC < 0 | 101.02 | +1.62% | -5.07% |
| 2026-10-28 16:00 | ROC > 0 | 103.02 | -3.15% | -7.03% |
| 2026-10-29 00:00 | ROC < 0 | 99.64 | -2.46% | -4.22% |
| 2026-10-29 08:00 | ROC > 0 | 100.34 | -3.80% | -4.88% |
| 2026-10-29 16:00 | ROC < 0 | 99.78 | -5.09% | -4.35% |
The pattern is instructive. The bearish crossings generally looked better over three days — the October 22 signal at 104.58 was followed by -2.86%, and the October 28 signal at 101.02 by -5.07% — because the underlying drift was down. The bullish crossings mostly failed: 101.99 on October 28 was followed by -5.72% over 18 bars, and 100.34 on October 29 by -4.88%. Meanwhile, several crossings clustered within hours of each other on October 26, 28 and 29, which is the signature of an indicator being whipsawed.
This is one indicator, one market, one month of 4-hour data. It is an illustration of behavior, not evidence that ROC works or does not work. A trending month on the same chart would produce far fewer crossings and a very different table. Draw conclusions about mechanics, not about edge.
Common mistakes
- Treating zero crossings as standalone signals. Twenty-three crossings in a month says everything about why this fails in a range. Crossings are context, not triggers.
- Applying fixed overbought/oversold levels. ROC is unbounded. A level that was extreme last quarter may be the median this quarter. Calibrate to the current volatility regime or normalize by ATR.
- Ignoring the drop-off effect. ROC can swing sharply because a large bar left the lookback window, not because anything new happened. Always glance at the price n bars ago before interpreting a sudden move.
- Fading momentum at the start of a breakout. Extreme ROC is a property of trend initiation as much as exhaustion. The reading cannot tell you which one you are in; price structure has to.
- Overfitting the lookback. Searching for the "best" ROC length on past data usually produces a number that describes last year's cycle, not next month's.
- Confusing Momentum with ROC on long charts. Raw Momentum in price units is not comparable across different price levels, which makes multi-year Momentum charts of a coin that went from $3 to $250 nearly meaningless.
Combining it with other tools
ROC answers how fast. It does not answer where or how much risk. Pair it with tools that cover those gaps.
A trend filter such as a long moving average or ADX tells you whether zero-line logic is even appropriate: in a confirmed trend, ROC sign agreement is informative; in a flat regime, it is noise. Many traders simply disable momentum-direction rules when a range is identified and switch to boundary-based reading instead.
Structure tools — horizontal support and resistance, prior swing highs, volume profile nodes — turn a momentum reading into a locatable event. "ROC is at the top of its recent range" means something different at the midpoint of a range than at a level that has rejected price three times.
Volatility measures such as ATR or Bollinger Band width give the scale. A +4% ROC during a quiet compression is a far bigger deviation than the same +4% a day after a 15% liquidation move. Normalizing ROC by realized volatility keeps readings comparable over time.
Finally, note the overlap with other oscillators. MACD is the difference between two exponential averages — a smoothed, lagged relative of ROC. RSI measures the ratio of average gains to average losses over its lookback and is bounded between 0 and 100. Stacking ROC, MACD and RSI gives you three views of roughly the same information, which inflates confidence without adding evidence. Choose one momentum representation and spend the remaining screen space on structure, volatility and position risk.
Frequently asked questions
Q. What is the difference between the Momentum indicator and Rate of Change?
They measure the same thing with different units. Momentum is the raw price difference between the current close and the close n bars ago, while ROC divides that difference by the old close and multiplies by 100 to express it as a percentage. ROC is comparable across assets and across price levels; raw Momentum is not, which is why percentage ROC is the more widely used of the two today.
Q. What is the best ROC setting for crypto?
There is no universally best setting, but 12 and 14 are reasonable starting points because they balance responsiveness against noise. The more important step is translating the lookback into real time: 12 periods on a 4-hour chart is 48 hours, which suits multi-day swings, while the same 12 on a 1-hour chart measures only half a day. Match the window to how long you actually intend to hold.
Q. Is ROC a leading or lagging indicator?
ROC is best described as coincident with a leading tendency. It reacts immediately to the current close with no smoothing, so it is faster than any moving-average-based tool, and deceleration in ROC sometimes appears before price turns. But it is calculated entirely from past prices and offers no predictive guarantee — divergences in particular can persist for a long time without resolving.
Q. What does a negative ROC mean?
A negative ROC simply means the current close is lower than the close n bars ago. It is a statement of fact about that specific window, not a forecast of further decline. A reading of -0.19% on 12-period ROC, for instance, means price is essentially unchanged over the last 12 bars, which usually indicates consolidation rather than weakness.
Q. Can ROC be overbought or oversold?
Not in the way RSI or Stochastics can, because ROC has no fixed upper or lower bound. Traders approximate the idea by drawing reference lines at levels that contained most readings over a recent sample, but those levels must be redrawn when volatility shifts. In crypto this matters more than in most markets, since a volatility expansion can double the normal range of the indicator in days.
Q. How is ROC different from MACD?
MACD is the difference between two exponential moving averages, so it is inherently smoothed and lags price; ROC compares two raw closes and lags nothing. The trade-off is noise: MACD produces fewer, later signals, while ROC produces faster but far choppier ones. Running both rarely adds independent information, since they are measuring overlapping aspects of the same momentum.
Key takeaways
- ROC and Momentum are the same calculation in different units — the distance between today's close and the close n bars ago — and they underpin MACD, TRIX, KST and the Coppock Curve.
- The zero line defines sign, the slope defines acceleration, and magnitude only has meaning relative to the asset's own recent distribution, because ROC is unbounded.
- Naive zero-line crossings degrade sharply in ranges: the October 2026 SOL/USDT 4-hour window produced 23 crossings with only 10 of 23 moving in the signal direction over the measured horizons.
- The drop-off effect means ROC can move because an old bar left the lookback, not because new information arrived — always check the reference bar.
- Use ROC alongside trend regime, price structure and volatility measures rather than stacking it with other momentum oscillators that repeat the same information.
Educational material. Charts use real SOL/USDT perpetual prices; past behaviour does not predict future results. Not investment advice.