Indicator & technique library · Indicator library
Golden Cross and Death Cross Explained: Rules & Uses
At a glance
- A golden cross occurs when the 50-period simple moving average crosses above the 200-period average; a death cross is the opposite.
- Both are lagging trend-regime markers built from closing prices, not forecasts or timing signals.
- They are most useful as a slow filter for trend direction and least useful in sideways, choppy markets.
- In the SOL daily sample below, three crosses in 17 months produced mixed results — two of three moved in the signal's direction after 20 bars.
The golden cross and death cross are the two most widely reported signals in all of technical analysis. Both come from the same simple construction: a faster moving average crossing a slower one, almost always the 50-period and 200-period simple moving averages on a daily chart. When the fast average crosses above the slow one, headlines call it a golden cross; when it crosses below, a death cross.
Traders care about them for two reasons. First, they are an honest, mechanical way to define whether a market is in a long-term uptrend or downtrend, which is useful because most strategies behave very differently in those two regimes. Second, because so many people watch them, the crosses attract attention, flows and commentary — which is a market fact worth understanding, even if it is not a reason to trade.
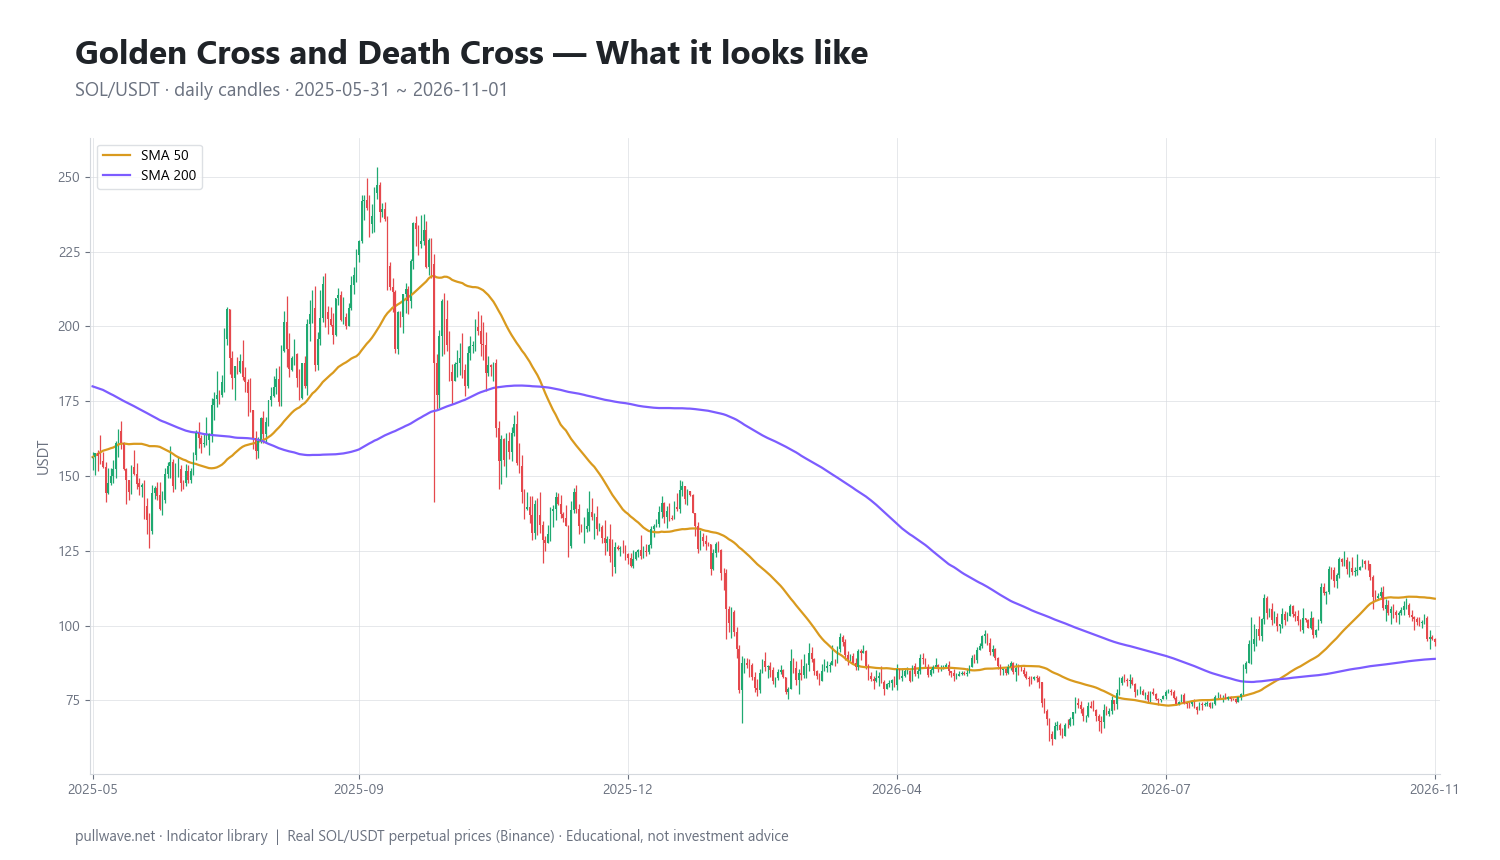
Figure 1 shows the 50-day and 200-day simple moving averages drawn on real SOL/USDT daily candles. Notice how the two lines spend long stretches far apart (clear trend) and short stretches wrapped around each other (no trend, and where crossovers become unreliable).
What is Golden Cross and Death Cross?
A golden cross is the event where a short-term moving average of price crosses from below to above a long-term moving average. The standard definition uses the 50-day and 200-day simple moving average (SMA) of closing prices on a daily chart.
A death cross is the mirror image: the 50-day SMA crossing from above to below the 200-day SMA. Neither term has a fixed technical definition beyond that, which is why you will see 50/200, 20/50 and exponential variants all described with the same two names.
Both are state-change markers, not oscillators. They do not measure how overbought or oversold a market is, and they do not produce a continuous reading. They tell you that the average price of roughly the last two months has moved to the other side of the average price of roughly the last seven months.
The idea behind it (theory and history)
The underlying theory is as old as charting itself: a moving average smooths noise and approximates the market's underlying drift. If the recent average is above the longer average, recent prices have been higher than the longer-run baseline, which is a crude but objective definition of an uptrend.
Moving-average crossovers were among the first fully mechanical trading rules. Richard Donchian, working at Futures Inc. from the 1940s onward, is widely credited with popularizing systematic crossover rules such as the 5- and 20-day averages. The 200-day average became a staple of equity market analysis through the 1960s and 1970s — William Gordon's 1968 book The Stock Market Indicators is one of the frequently cited early examinations of long moving averages in stocks.
The specific labels "golden cross" and "death cross" are financial-media vocabulary rather than the invention of a named analyst, and I have not seen a reliably documented first use. Treat anyone who gives you a precise inventor and date for these two phrases with caution. What is documented is the long history of the 50/200 pair as a trend filter in equities, from which crypto inherited it unchanged.
The economic logic, such as it is: large trends in risk assets tend to persist over months because capital reallocates slowly. A crossover of two slow averages is a way of waiting until that reallocation is visible in price before acting. The cost of that patience is lag — and lag is the central trade-off of the entire technique.
How it is calculated
Step by step, on daily closes:
- Take the closing price of each of the last 50 daily candles, add them, divide by 50. That is the 50-day SMA for today.
- Do the same with the last 200 closes to get the 200-day SMA.
- Repeat for every bar so you have two lines.
- Compute the spread: 50-day SMA minus 200-day SMA.
- A golden cross is printed on the bar where the spread turns from zero-or-negative to positive. A death cross is the bar where it turns from zero-or-positive to negative.
``` SMA(n)t = (C_t + C{t-1} + ... + C_{t-n+1}) / n
Spread_t = SMA(50)_t - SMA(200)_t
Golden cross at t: Spread_{t-1} <= 0 AND Spread_t > 0 Death cross at t: Spread_{t-1} >= 0 AND Spread_t < 0 ```
Two mechanical notes. The 200-day SMA needs 200 completed bars before it exists, so a newly listed token cannot produce a valid cross for roughly seven months. And a simple moving average lags price by approximately (n−1)/2 bars — about 25 bars for the 50 and about 100 bars for the 200 — which is why a cross can print long after a turn is obvious on the chart.
Default settings and variations
Why 50 and 200? The numbers come from the stock market calendar. With roughly 252 trading days per year, 50 days is about one quarter and 200 days is about ten months — close enough to "a year." The equivalents on a weekly chart are the 10-week and 40-week averages, which is how older equity analysts usually phrased it.
Crypto trades 365 days a year with no weekends or holidays, so a 200-day average covers only about 6.6 calendar months rather than nearly a year. If you want the equity equivalent in calendar time, roughly 290 daily bars would be closer. Most crypto traders still use 50/200 anyway, mainly because it is the convention everyone else watches.
| Variation | Typical use | Trade-off |
|---|---|---|
| SMA 50 / SMA 200 (daily) | The standard; trend regime filter | Slowest, fewest signals, largest lag |
| EMA 50 / EMA 200 (daily) | Slightly faster reaction to turns | Crosses earlier, more whipsaws in chop |
| SMA 20 / SMA 50 | Swing-trading trend filter | Many more signals, far more false ones |
| 10-week / 40-week (weekly) | Position and investor timeframe | Very few signals; one bar per week |
| 5 / 20 (Donchian-style) | Short-term systematic rules | Fast, requires strict risk control |
Simple versus exponential matters less than people expect at these lengths, but there is a real difference: the SMA drops a single old bar from the window each day, so a large price from 200 days ago falling out of the calculation can shift the line by itself. The EMA has no such edge effect but gives more weight to the last few weeks.
How to read it
Read the relationship, not just the crossing bar. The crossing itself is one moment; the structure around it carries most of the information.
- Separation. When the two averages are widely apart and both sloping the same way, the trend is strong and established. When they are tangled within a percent or two of each other, the market has no trend and crossovers will be noisy.
- Slope. A golden cross where the 200-day is still falling is weaker evidence than one where the 200-day has flattened or turned up. The same applies in reverse for a death cross.
- Where price sits. A cross that prints while price is far above both averages often arrives after a large move is already done. A cross that prints with price near the averages is at least closer to a reference level you could define risk against.
- Spread as a momentum reading. Plotting (SMA50 − SMA200) / SMA200 × 100 turns the pair into a slow oscillator. Expanding spread means the trend is accelerating; contracting spread means it is maturing, long before any cross occurs.
How traders use it
1. As a regime filter. The most defensible use: allow long setups from other tools only while the 50 is above the 200, and be more defensive or flat when it is below. This does not generate entries; it governs which playbook applies. Works in markets with long directional swings. Fails in long sideways ranges, where it flips state near the middle of the range and filters you out of good mean-reversion trades.
2. As a trend-following position signal. Enter in the direction of the cross and hold until the opposite cross. Works when the market produces one or two large trends per year, which crypto often does. Fails badly in a multi-month range: the approach buys highs, sells lows, and bleeds through repeated whipsaws. Historically most moving-average systems lose on the majority of individual signals and depend on a small number of very large winners.
3. As an exit or de-risking rule. Some longer-horizon spot holders use the death cross purely as a reason to reduce exposure, ignoring golden crosses for entries. Works as a way to avoid sitting through the worst part of a sustained bear phase. Fails when a sharp drawdown reverses quickly — the cross can print close to a low, after much of the damage has already happened.
4. As an attention and liquidity event. Crosses on large caps are reported widely, and that coverage can bring short-term flow. This is observational context, not an edge: the reaction can be in either direction, and by the time the headline exists the move that caused the cross is months old.
In crypto specifically, the 24/7 tape means no weekend gaps and a smoother average, but volatility is several times that of equities, so the same percentage distance between averages means something different. On perpetual futures, a slow signal of this kind is a poor fit for high leverage: a position that is meant to be held for months can be liquidated by a single overnight wick long before the thesis resolves.
Example on a real SOL chart
The window below is SOL/USDT perpetual on Binance, daily candles, from 2025-05-31 to 2026-11-01, using the standard daily SMA 50 versus SMA 200. The last close in the window was 94.51. Over roughly seventeen months the pair produced exactly three signals — a useful reminder of how rare these events are.
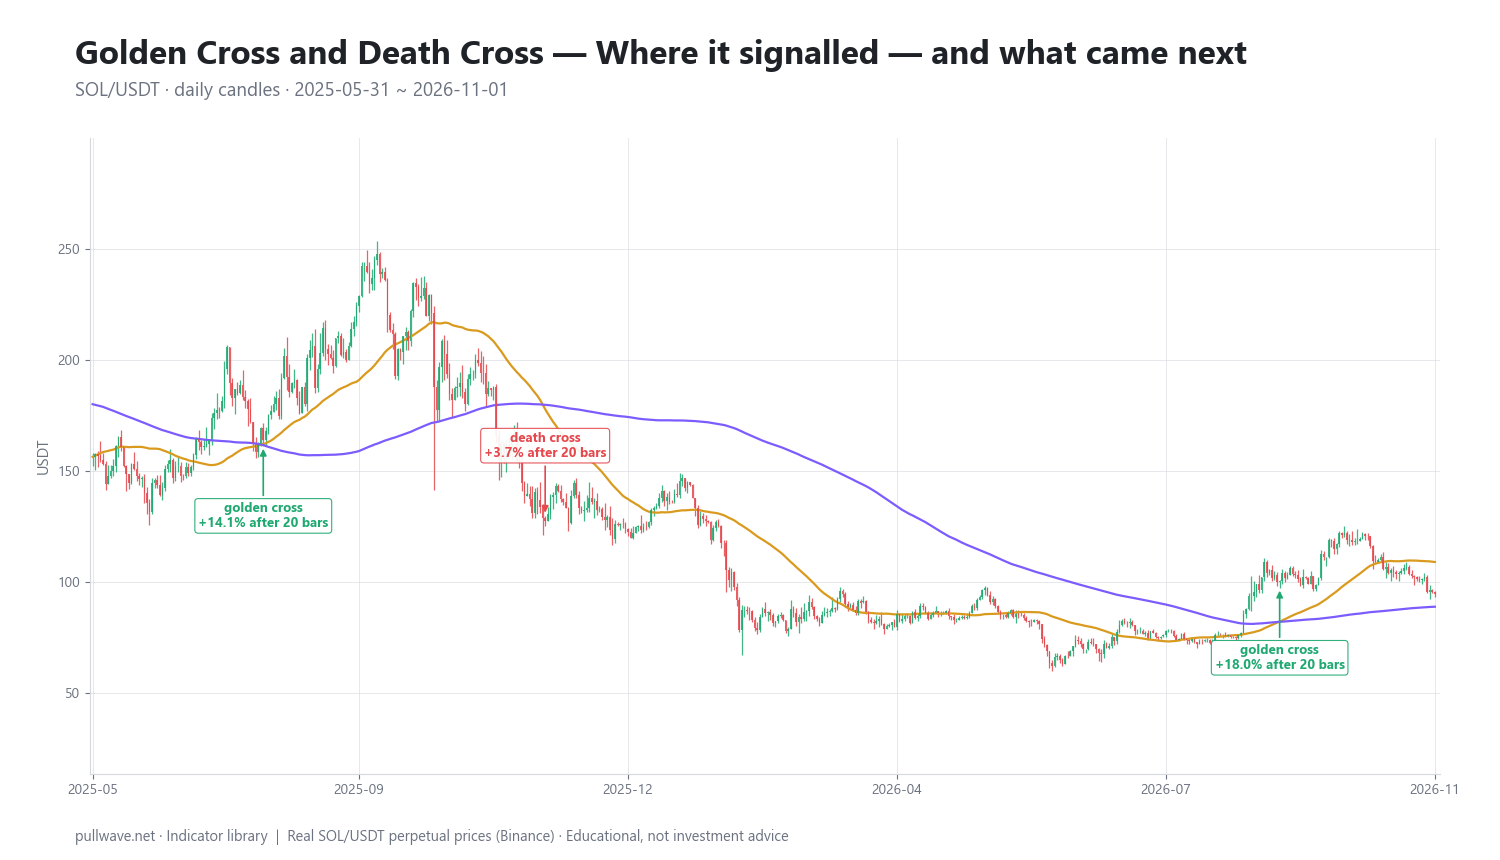
Figure 2 marks each cross and the percentage change 20 bars and 60 bars later.
| Date | Signal | Price | After 20 bars | After 60 bars |
|---|---|---|---|---|
| 2025-08-05 | Golden cross | 163.99 | +14.09% | +38.86% |
| 2025-11-22 | Death cross | 127.50 | +3.68% | +1.55% |
| 2026-09-02 | Golden cross | 100.38 | +18.04% | −5.85% |
The first signal is the textbook case. The golden cross printed at 163.99 and price was 14.09% higher 20 days later and 38.86% higher after 60 days — the kind of outcome that makes the technique famous.
The second is the textbook failure on the horizons measured here. The death cross printed at 127.50, and over the following 20 and 60 days price was higher, by 3.68% and 1.55%. On both of those horizons the signal pointed the wrong way. There is a complication worth stating plainly: the window's final close of 94.51 is well below 127.50. So the same signal was wrong at 20 and 60 bars, yet price ended the window below the signal price — the measurement horizon you choose changes the conclusion, and no single horizon is the "true" one.
The third is the most instructive. The golden cross at 100.38 was followed by an 18.04% gain after 20 days, then a −5.85% reading after 60 days: the initial move was given back and more. A trader who used the cross as a long-term regime signal would still have been positioned long while the market drifted back under the signal price.
Counting only the 20-bar horizon, two of three signals moved in the direction implied by the cross. That is one market, one timeframe, one seventeen-month window, and three observations. It is an illustration of how the tool behaves, not evidence that it works. Three samples cannot support any statistical claim, and the results here were genuinely mixed.
Common mistakes
- Treating the cross as a timing signal. It is the slowest common signal in technical analysis. Entering at the cross price with a tight stop usually means being stopped out by normal volatility within days.
- Ignoring the market regime. In a range, the 50 and 200 will cross repeatedly near the middle of the range. Every one of those crosses is noise. Check the separation and slope before giving any cross weight.
- Forgetting the lag. By the time a golden cross prints, the low is typically months and tens of percent behind you. That is the price of confirmation, not a flaw to be engineered away with smaller settings.
- Backtesting on a handful of signals. A 50/200 cross produces maybe one to three signals per year per market. Ten years of data on one coin is still a tiny sample.
- Using it on illiquid or newly listed tokens. Without 200 clean daily bars the long average is meaningless, and thin books distort closes.
- Applying the same leverage you would use on a day trade. A months-long signal held with high leverage on perpetuals converts a slow trend idea into a liquidation risk.
Combining it with other tools
The cross answers "which regime," so pair it with tools that answer "where" and "when."
- Horizontal structure. Prior swing highs and lows, and the levels where volume concentrated, give you places to act within the regime the cross defines. The cross says a pullback is worth considering; structure says where.
- Momentum oscillators. RSI or MACD on the same chart can show whether momentum is confirming or diverging as the cross forms. A golden cross with the 200-day still falling and momentum fading is a weaker configuration than one with both rising.
- Volatility measures. ATR or Bollinger Band width tells you how wide a stop has to be to survive normal noise, which is the practical constraint on holding any slow signal.
- The 200-day average alone. Price relative to the 200-day SMA is a faster version of the same regime question and often flips weeks before the crossover does. Using both gives you an early read and a confirmed read.
- Higher timeframe context. For a daily cross, check the weekly chart's structure. A daily golden cross inside a weekly downtrend is a different proposition from one inside a weekly uptrend.
Finally, risk management is not an add-on here. A signal that produces three events in seventeen months must be sized so that a long sequence of failures is survivable, because such sequences are normal for trend-following rules.
Frequently asked questions
Q. What is the difference between a golden cross and a death cross?
A golden cross occurs when a short-term moving average — normally the 50-day simple moving average — crosses above a long-term one, usually the 200-day. A death cross is the same event in reverse, with the 50-day crossing below the 200-day. Both describe the same mathematical relationship; only the direction differs.
Q. Which moving averages are used for the golden cross?
The standard is the 50-period and 200-period simple moving averages of closing price on a daily chart. These lengths come from the stock market, where 50 trading days is roughly a quarter and 200 is roughly ten months. Shorter pairs such as 20/50 and exponential versions are common variations, but they produce more signals and more false ones.
Q. Does the golden cross work in crypto?
It works as a description of trend regime, not as a reliable predictor of the next move. Crypto's high volatility means the lag between a trend turning and the cross printing can cost a large part of the move, and sideways periods produce whipsaws. In the SOL sample on this page, three crosses over seventeen months gave mixed results, with one clear success, one failure on both measured horizons, and one that reversed after 60 days.
Q. Is a death cross a sell signal?
It is better understood as a confirmation that the medium-term trend has turned down, not as an instruction. Death crosses frequently print after a large decline has already occurred, and sometimes near a local low. Most traders who use it treat it as a reason to reduce exposure or stop taking long setups, combined with other evidence.
Q. Should I use SMA or EMA for the 50/200 cross?
The simple moving average is the conventional choice and the one most market participants are watching, which matters if you care about the attention effect. The exponential version reacts somewhat sooner to turns but generates more false crosses in choppy conditions. At lengths of 50 and 200 the two track closely, so the choice is less important than how you use the signal.
Q. What timeframe is best for a golden cross in crypto?
The daily chart is the standard and the one everyone references. Weekly 10/40 crosses are rarer and slower, suited to position holders. On hourly or lower timeframes the same crossover fires often and carries little information, because 200 hours is less than nine days of a market that routinely moves that much in a session.
Key takeaways
- The golden cross and death cross are simply the 50-period moving average crossing above or below the 200-period average; they mark a change in trend regime, not a forecast.
- They are inherently lagging. A 50-day SMA lags by roughly 25 bars and a 200-day by roughly 100, so crosses confirm moves that are already well underway.
- They are most useful as a slow filter that tells you which playbook applies, and least useful as an entry trigger or in sideways markets where the averages tangle.
- Signals are rare — three in seventeen months in the SOL example — so any conclusion drawn from a handful of crosses on one market is statistically meaningless.
- Combine the regime read with price structure, momentum and a volatility-based view of risk, and size positions so that a long run of failed signals is survivable, especially on leveraged perpetuals.
Educational material. Charts use real SOL/USDT perpetual prices; past behaviour does not predict future results. Not investment advice.