Indicator & technique library · Trading techniques
Volatility Squeeze Breakouts: Setup, Rules and Examples
At a glance
- A volatility squeeze is a period when price range contracts sharply, measured by Bollinger Bands narrowing inside Keltner Channels or by low Bollinger BandWidth.
- The standard setup compares a 20-period, 2-standard-deviation Bollinger Band against a Keltner Channel built from EMA20 and a multiple of ATR.
- The squeeze signals that volatility is compressed and likely to expand; it says nothing reliable about which direction price will expand.
- In the SOL/USDT 4h sample window, 61.1% of bars were in a squeeze and only 3 of 7 breakouts moved in the signal direction after six bars.
A volatility squeeze is a stretch of time when a market's trading range contracts to an unusually narrow level, and a squeeze breakout is the first decisive move out of that contraction. The technique is built on a simple observation: volatility is cyclical. Quiet periods tend to be followed by active ones, and active periods eventually calm down again. Traders who watch for squeezes are trying to be positioned, or at least alert, before the quiet turns loud.
The appeal in crypto is obvious. Perpetual futures run 24/7, funding rates and leverage build up during flat periods, and a market that has gone nowhere for two days can travel 8% in four hours. The catch, which this page will keep returning to, is that a squeeze tells you when volatility is likely to expand, not which way price will go — and a large share of breakouts fail on the first attempt.
What is Volatility Squeeze Breakouts?
A volatility squeeze breakout is a two-stage technique. Stage one is identification: you measure volatility with an objective tool and wait until it drops into the low end of its own recent range. Stage two is the trigger: you define what counts as price escaping the compression — a close outside the bands, a break of the squeeze range high or low, or a volatility expansion reading.
The most common way to define the squeeze is to compare two volatility envelopes that react differently to quiet markets. Bollinger Bands use standard deviation, which collapses quickly when candles get small. Keltner Channels use Average True Range, which falls more slowly. When the Bollinger Bands contract so far that they sit entirely inside the Keltner Channels, volatility is compressed relative to its own normal. That condition is the squeeze.
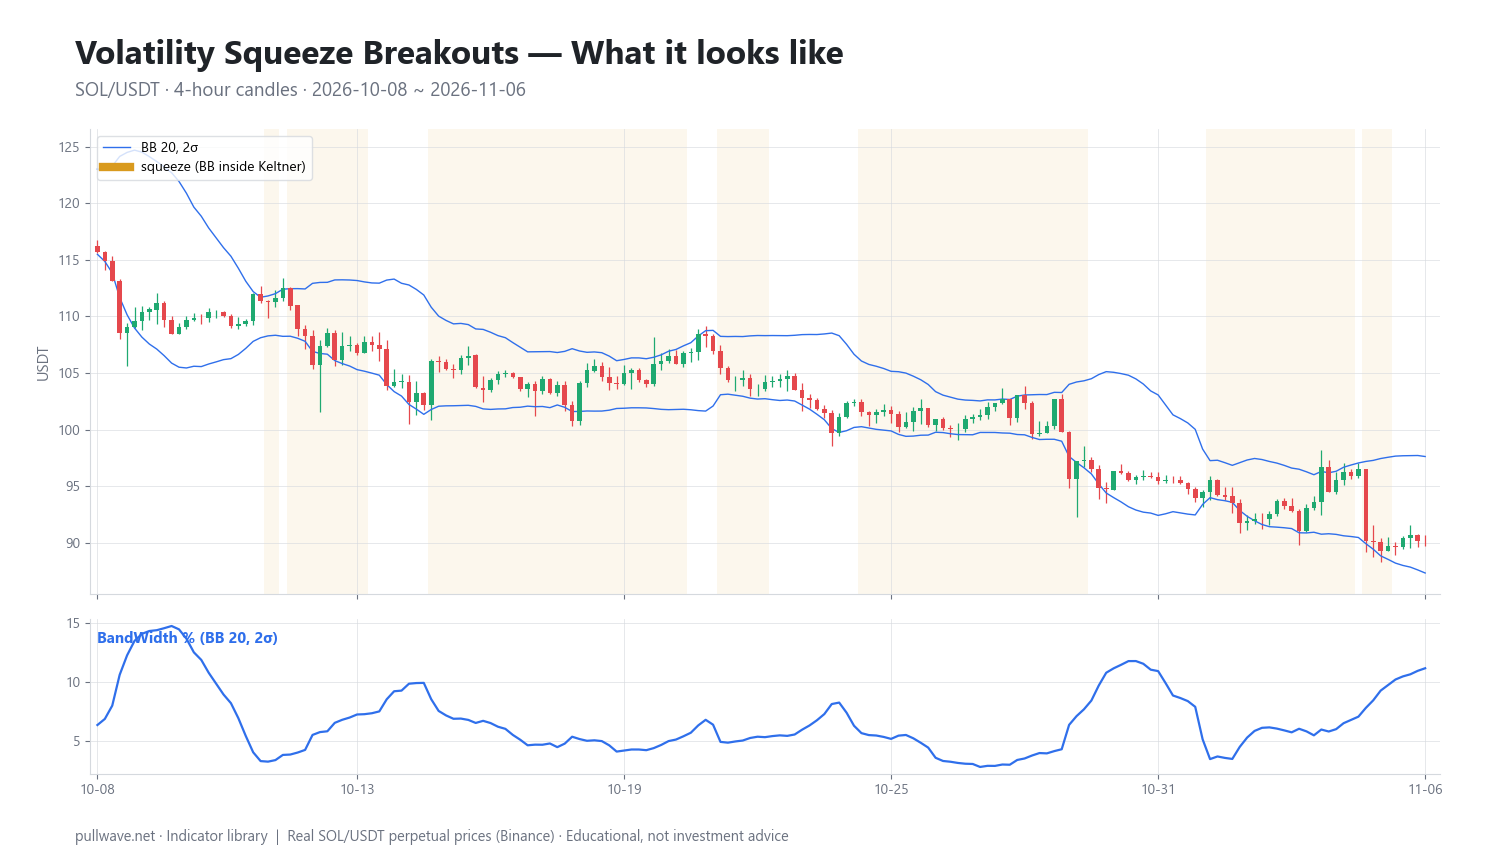
Figure 1 shows the technique on real SOL/USDT 4h candles: the Bollinger Band envelope, the Keltner Channel envelope, and the shaded stretches where the bands are nested inside the channel. Notice how the nested periods cluster — squeezes are not isolated single bars but regimes that can last many candles.
The idea behind it (theory and history)
The building blocks come from two different decades. Keltner Channels trace back to Chester W. Keltner, who described a moving-average-plus-range band in his 1960 book How to Make Money in Commodities. The modern version most platforms use — an exponential moving average with Average True Range added and subtracted — is a later adaptation; ATR itself was introduced by J. Welles Wilder Jr. in New Concepts in Technical Trading Systems (1978).
Bollinger Bands were developed by John Bollinger in the early 1980s, replacing fixed-percentage bands with bands set at a number of standard deviations around a moving average. Bollinger also named "the Squeeze": in Bollinger on Bollinger Bands (2001) he described periods of very low BandWidth as a setup for the next directional move, and warned about the "head fake" — the tendency of price to poke one way out of a squeeze before reversing and running the other way.
The nested-bands version of the squeeze is widely credited to John Carter, who popularized a "squeeze" indicator in his book Mastering the Trade (2005) and in his trading education work. The underlying statistical idea is older than any of these tools: volatility clusters. Quiet begets quiet, large moves beget large moves, and mean reversion in volatility is one of the more durable statistical regularities in financial markets. The squeeze is a practical, chart-readable way to exploit that regularity.
How it is calculated
Step by step, with the settings used in the example on this page:
- Middle line. Compute a 20-period simple moving average of closing prices for the Bollinger Bands, and a 20-period exponential moving average for the Keltner Channel.
- Standard deviation. Compute the population standard deviation of the last 20 closes.
- Bollinger Bands. Upper band = SMA20 + 2σ. Lower band = SMA20 − 2σ.
- True Range. For each bar, True Range is the largest of: high − low, |high − previous close|, |low − previous close|.
- ATR. Average the True Range over 10 periods (Wilder's smoothing or a simple average, depending on the platform).
- Keltner Channel. Upper = EMA20 + 2 × ATR10. Lower = EMA20 − 2 × ATR10.
- Squeeze test. The market is "in squeeze" on any bar where the upper Bollinger Band is below the upper Keltner line and the lower Bollinger Band is above the lower Keltner line.
- Breakout test. A breakout is registered when the squeeze condition ends and price closes outside the Bollinger Band, or outside the high/low range of the squeeze period, depending on your rule.
A useful companion measure is Bollinger BandWidth, which expresses the band spread as a percentage of the middle line and lets you compare compression across different price levels.
``` BB_mid = SMA(close, 20) BB_up = BB_mid + 2 * STDEV(close, 20) BB_low = BB_mid - 2 * STDEV(close, 20)
KC_mid = EMA(close, 20) KC_up = KC_mid + 2 * ATR(10) KC_low = KC_mid - 2 * ATR(10)
Squeeze = (BB_up < KC_up) AND (BB_low > KC_low)
BandWidth = (BB_up - BB_low) / BB_mid * 100 ```
Default settings and variations
The 20-period length is inherited from Bollinger's original work: roughly one trading month on daily bars, long enough for the standard deviation to be meaningful and short enough to adapt. The 2σ multiplier captures about 95% of observations under a normal distribution, so touches of the band are relatively uncommon by construction. ATR 10 is a shorter, faster volatility read that keeps the Keltner Channel from reacting as abruptly as standard deviation does.
| Component | Common default | Variation | Effect |
|---|---|---|---|
| BB length | 20 | 10–50 | Shorter = more squeezes, more noise |
| BB deviations | 2.0σ | 1.5σ–2.5σ | Lower σ = narrower bands = more squeeze signals |
| KC length | EMA 20 | EMA 20 (rarely changed) | Keeps both envelopes centered alike |
| ATR length | 10 or 20 | 10–20 | Shorter ATR = channel adapts faster |
| ATR multiplier | 1.5 or 2.0 | 1.0 ("tight"), 2.0, 3.0 | Higher multiplier = wider channel = squeeze fires more often |
Carter's widely copied version uses a 1.5 ATR multiplier, which makes the squeeze condition stricter and rarer than the 2.0 used here. Some traders drop the Keltner comparison entirely and simply require BandWidth to be in the lowest 10–20% of its last 100–200 readings — a percentile approach that adapts automatically to each market's own character. On crypto, where baseline volatility is high, percentile-based definitions often travel better across assets than fixed thresholds.
How to read it
Read the squeeze in three layers. First, the state: is the market compressed or not? Second, the duration: how many bars has the compression lasted, and how far has BandWidth fallen relative to its recent range? Third, the release: when compression ends, where does price close relative to the squeeze range?
Longer and tighter squeezes are generally considered more significant than brief ones, because more orders accumulate around a narrow price area and more stops sit just outside it. A BandWidth reading near the bottom of its multi-month range is a stronger compression signal than one that is merely below average.
The critical point: the squeeze is non-directional. Nothing in the standard deviation or ATR calculation knows whether buyers or sellers will win. Direction has to come from somewhere else — the prevailing trend, the structure of the range, momentum, volume, or the location of the squeeze relative to higher-timeframe support and resistance.
How traders use it
1. Trend continuation after a pause. A market trends, then consolidates into a tight squeeze near the highs, then releases in the direction of the prior trend. This is the version with the best reputation, because the squeeze acts as a rest inside an established move rather than a coin flip. It works in trending regimes and fails badly in choppy ones, where each "continuation" breakout gets reversed within a few bars.
2. Range breakout with a defined invalidation. Mark the squeeze high and low. A close outside that band is the trigger; the opposite side of the range is the natural invalidation level. The appeal is that risk is small and precisely defined while volatility is low. The failure mode is the head fake Bollinger described: price breaks one way, traps entries, and reverses through the range.
3. Volatility positioning rather than directional betting. Some traders use the squeeze purely as a risk-management cue — reducing leverage, widening stops in advance, or avoiding mean-reversion strategies — because they expect range expansion regardless of direction. This use case works in every regime, since it does not require being right about direction.
4. Multi-timeframe alignment. Look for a squeeze on a higher timeframe (daily or 12h) and take the trigger on a lower one (1h or 4h). The higher timeframe supplies context and the lower one supplies a tighter entry. This fails when the two timeframes disagree, and it tempts traders into over-trading lower-timeframe noise while calling it a "daily setup."
Example on a real SOL chart
The sample window is SOL/USDT perpetual futures on Binance, 4h candles, from 8 October 2026 to 6 November 2026, using Bollinger 20/2σ against a Keltner Channel of EMA20 ± 2×ATR10. The last close in the window was 90.1.
This was an unusually compressed month: 61.1% of all bars in the window were in a squeeze. Across the window, BandWidth ranged between 2.76 and 14.73, and the final reading was 11.14, near the upper part of that range. Seven squeeze-to-breakout events were recorded. Outcomes were measured at 6 bars (one day) and 18 bars (three days) after each signal.
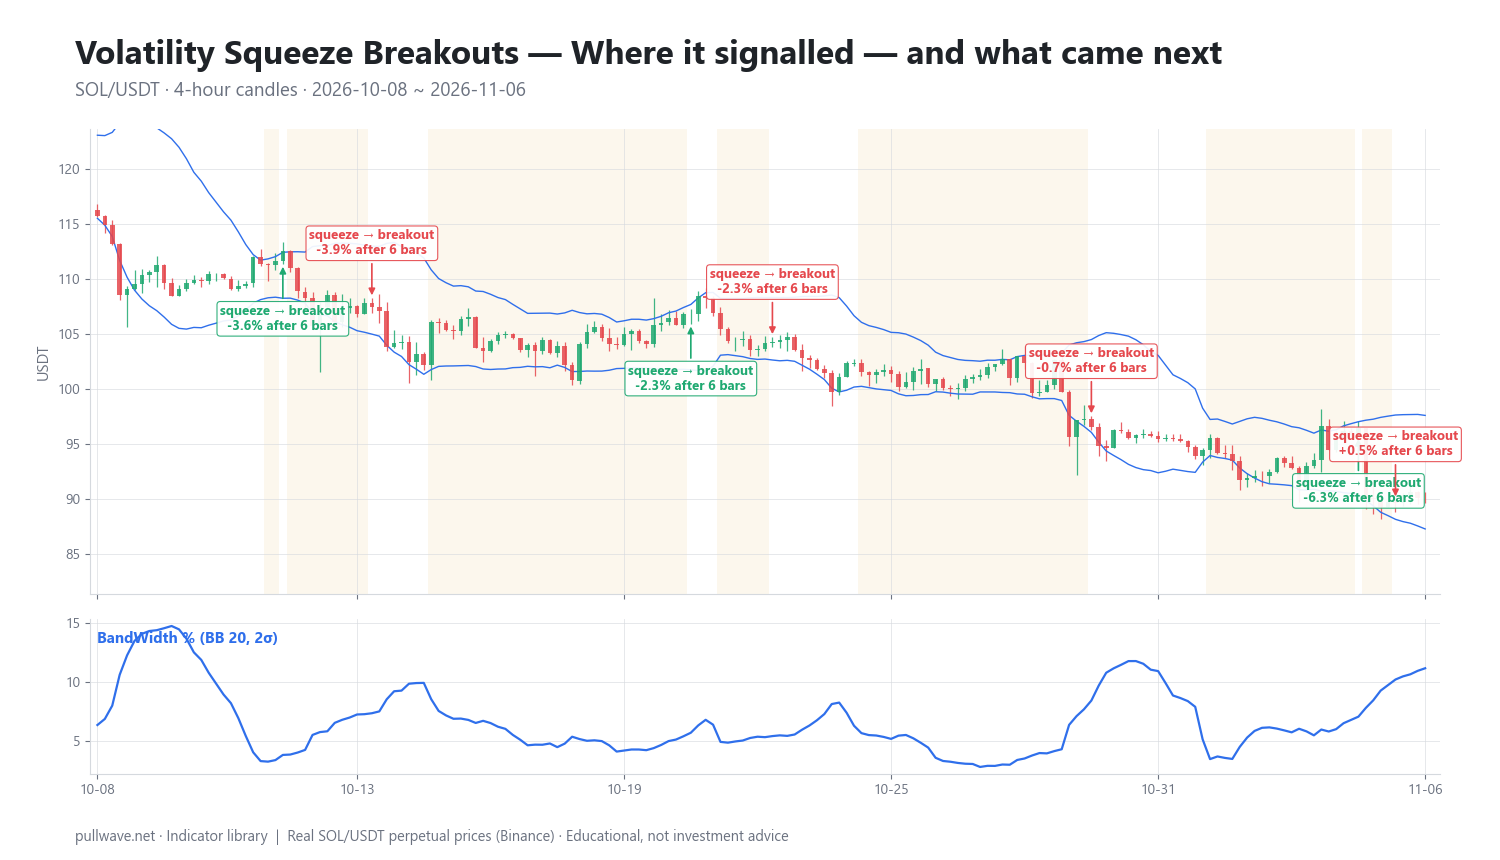
Figure 2 marks each of the seven events on the same chart with its subsequent percentage move at both horizons.
| Date (UTC) | Price | % after 6 bars | % after 18 bars |
|---|---|---|---|
| 2026-10-12 04:00 | 112.54 | −3.58 | −8.28 |
| 2026-10-14 04:00 | 107.44 | −3.93 | −2.23 |
| 2026-10-21 08:00 | 106.82 | −2.27 | −5.01 |
| 2026-10-23 04:00 | 104.25 | −2.30 | −3.42 |
| 2026-10-30 08:00 | 96.53 | −0.73 | −2.55 |
| 2026-11-05 08:00 | 96.48 | −6.32 | −6.61 |
| 2026-11-06 04:00 | 89.65 | +0.50 | +0.50 |
Two things stand out. First, the price column is a steady staircase downward, from 112.54 to 89.65 — roughly a 20% decline over the window. Every squeeze released into a market that was already drifting lower, and the subsequent price changes were negative at both horizons in six of seven cases. Second, and more importantly, only 3 of the 7 breakouts moved in the direction of the signal after six bars. In other words, even in a window where the overall path was clear in hindsight, the breakout trigger itself picked the right side less than half the time.
That is the honest reading: the squeeze identified compression well — 61.1% of bars qualified, and BandWidth travelled between a low of 2.76 and a high of 14.73 within the same month — but the directional edge in this sample was mixed at best. The last event on 6 November is barely meaningful, since it had only enough data for a +0.50% reading at both horizons.
This is one market, one timeframe, and one 30-day window. It illustrates mechanics and failure modes. It is not evidence that squeeze breakouts work or do not work in general, and results on another asset, timeframe or month could look entirely different.
Common mistakes
- Treating the squeeze as a direction signal. It measures compression only. Traders who enter "because there's a squeeze," without a directional thesis, are effectively flipping a coin with a volatility tailwind.
- Ignoring the regime. In a trend, squeeze breakouts resolve with the trend more often. In a choppy, mean-reverting market, the same signal produces a string of head fakes, as the SOL window partly shows.
- Entering on the wick instead of the close. Intrabar spikes through a band are common in crypto, especially around liquidation cascades. Requiring a candle close outside the range filters a meaningful share of noise.
- Over-leveraging because the stop is tight. A narrow squeeze range invites large position sizes on perpetuals. When the breakout fails and reverses through the range, that same tight stop plus high leverage is how accounts get liquidated on a 3% move.
- Using too short a timeframe. On 1m or 5m crypto charts, micro-squeezes fire constantly and most of them mean nothing. Higher timeframes produce fewer, cleaner compressions.
- Ignoring where the squeeze sits. A squeeze pressed against a well-tested resistance level is a different setup from one floating in the middle of a range, even though the indicator looks identical.
Combining it with other tools
Because the squeeze is non-directional by construction, it pairs naturally with directional tools. A momentum oscillator read at the moment of release — the slope of a linear regression of price around the moving average, MACD histogram direction, or RSI relative to 50 — gives a tilt rather than a certainty. Many squeeze implementations plot exactly this kind of momentum histogram beneath the squeeze dots for that reason.
Market structure is the other natural partner. Mark the swing highs and lows that bracket the compression, and treat a close outside structure as more meaningful than a close outside a band. Horizontal levels from higher timeframes, volume-profile value areas, and prior range edges all help answer the question the indicator cannot: which side has the path of least resistance.
Volume and, on perpetuals, open interest add a confirmation layer. A breakout on expanding volume with rising open interest suggests new positioning; a breakout on thin volume with falling open interest often reflects stop-runs and short covering. Funding rates that turned sharply positive during the squeeze can indicate crowded longs, which raises the odds that the first move out is a flush rather than a trend start.
Finally, ATR itself is useful after entry. Sizing stops as a multiple of ATR at the moment of release — rather than as a fixed percentage — keeps risk consistent as volatility expands from compressed levels, which is exactly what you are betting will happen.
Frequently asked questions
Q. What is a volatility squeeze breakout?
A volatility squeeze breakout is a price move out of a period of unusually low volatility. The squeeze is typically detected when Bollinger Bands contract entirely inside Keltner Channels, or when Bollinger BandWidth falls into the lowest part of its recent range. The breakout is the first decisive close outside the compressed range.
Q. What are the best squeeze settings for crypto?
There is no universally best setting. The common starting point is Bollinger 20/2σ against a Keltner EMA20 with an ATR multiplier of 1.5 or 2.0, and many crypto traders prefer 4h or daily charts because lower timeframes produce too many micro-squeezes. Testing a percentile-based BandWidth threshold on the specific asset you trade is usually more informative than copying a fixed number.
Q. Does a squeeze tell you which direction price will go?
No. Standard deviation and Average True Range both measure the size of moves, not their sign, so the squeeze is directionally neutral by design. Direction has to come from trend context, market structure, momentum, volume, or higher-timeframe levels.
Q. How long does a volatility squeeze usually last?
It varies widely by market and timeframe, and squeezes often come in clusters rather than as isolated bars. In the SOL/USDT 4h example on this page, 61.1% of bars over a 30-day window qualified as being in a squeeze. Longer compressions are generally considered more significant, but duration alone does not predict the size or direction of the release.
Q. What is the difference between the TTM Squeeze and Bollinger BandWidth?
Bollinger BandWidth is a single line showing band spread as a percentage of the moving average, so you judge compression by comparing it to its own history. The TTM-style squeeze instead compares Bollinger Bands to Keltner Channels and produces a binary on/off state, usually plotted as dots, often with a momentum histogram alongside. They measure the same underlying phenomenon with different outputs.
Q. Why do so many squeeze breakouts fail?
Compressed ranges concentrate stop orders just outside the range, which makes the first move out an attractive target for liquidity-seeking flow — John Bollinger called this the "head fake." In the SOL sample window, only 3 of 7 breakouts moved in the signal direction after six bars. Requiring a candle close, confirming with volume or structure, and sizing conservatively are the usual responses.
Key takeaways
- A volatility squeeze identifies compression, most commonly when Bollinger Bands (20/2σ) sit entirely inside Keltner Channels (EMA20 ± ATR multiple); the breakout is the release from that compression.
- The technique rests on volatility clustering and mean reversion in volatility — a durable statistical regularity — not on any claim about direction.
- Direction must be supplied by other evidence: trend, structure, momentum, volume and, on perpetuals, open interest and funding.
- In the SOL/USDT 4h window from 8 October to 6 November 2026, 61.1% of bars were in a squeeze, BandWidth ranged between 2.76 and 14.73 and ended at 11.14, and only 3 of 7 breakouts moved in the signal direction after six bars — a single illustration, not proof of edge.
- The most common ways to lose money with this technique are over-leveraging into a tight stop, trading micro-squeezes on very low timeframes, and ignoring whether the broader regime is trending or ranging.
Educational material. Charts use real SOL/USDT perpetual prices; past behaviour does not predict future results. Not investment advice.