Indicator & technique library · Candlestick patterns deep dive
Tweezer Tops and Bottoms: Rules, Context and Evidence
At a glance
- A tweezer is two consecutive opposite-colour candles that reject almost exactly the same high (top) or low (bottom).
- The definition of "equal" is everything: with a tolerance of 0.1 ATR the pattern appears on roughly one in six 4h candles.
- In a pooled test of 21,306 occurrences across 20 crypto perpetuals, the pattern alone closed in its expected direction 48.9% of the time after 6 bars against a 50.0% baseline.
- Its honest value is as vocabulary and as a precise invalidation level, not as a standalone signal.
A tweezer is one of the simplest shapes in candlestick charting: two candles side by side, opposite colours, whose highs (or lows) sit at almost exactly the same price. The name comes from the picture — two prongs of equal length sticking out of the chart at one level. A tweezer top has matching highs after an advance; a tweezer bottom has matching lows after a decline.
Traders care because the shape marks a price the market tested twice and refused twice, which makes it a tidy anchor for a stop or for defining what would prove an idea wrong. It is also extremely common — in the data below, about one in six 4-hour candles across twenty crypto perpetuals began a tweezer — and in that same data the pattern on its own did not move the odds of the next swing. Both of those facts belong on the same page, and this one keeps them together.
What is Tweezer Tops and Bottoms?
A tweezer is a two-candle pattern defined entirely by one thing: the two candles share an extreme. Everything else — body size, shadow length, where the closes land — is optional in the strict version and only matters in the variations.
- Tweezer top. Candle 1 is bullish (close above open), candle 2 is bearish (close below open), and the two highs are equal within a small tolerance. It usually appears after an up-move and claims a bearish turn.
- Tweezer bottom. Candle 1 is bearish, candle 2 is bullish, and the two lows are equal within the tolerance. It usually appears after a down-move and claims a bullish turn.
The word "claims" is deliberate. A pattern is a hypothesis about what happens next, and the whole point of the test later on this page is to check that claim rather than repeat it. Note also what the strict definition does not require: no minimum body, no long rejection wick, no gap, no volume condition. Those are filters you can add, and adding them changes both the number of occurrences and the statistics completely.
Tweezers are the two-bar cousin of equal highs and equal lows in market-structure analysis. They are not double tops or double bottoms — those are swing formations separated by many bars and a retracement in between. A tweezer is immediate: two adjacent candles, one level, one rejection sequence.
The idea behind it (theory and history)
Candlestick charting reached Western traders mainly through Steve Nison's Japanese Candlestick Charting Techniques (1991), which catalogued and named the patterns most charting platforms now ship with, tweezers included. The popular origin story — that the 18th-century rice trader Munehisa Homma invented candlestick charts — is repeated everywhere but is poorly documented, and the link between whatever he actually traded on and the modern candle vocabulary is at best indirect. Treat it as folklore rather than history; it does not affect whether the pattern is useful.
The reasoning behind a tweezer is straightforward order-flow logic. Candle 1 pushes into a price and stops. Candle 2 pushes into the same price, fails again, and closes the other way. Two independent attempts met the same supply (or demand) at a level precise enough that the difference is a rounding error. Read that way, a tweezer is a very local statement about where a transaction barrier sat for a few hours.
There is a competing reading worth holding in your head at the same time. The smart-money literature argues that equal highs and equal lows are exactly where resting stop orders and breakout orders pile up — the "liquidity pool" idea described on the equal highs and lows and liquidity pages. Under that interpretation the twin extreme is not a wall that will hold but a target that invites a later sweep. It is an interpretation of order placement, not something the data on this page measures. The same shape supports two opposite stories, which is a good reason to insist on context before giving a tweezer any weight.
The external evidence is sobering. Academic studies on equities and futures have generally found weak or no profitable predictive power in candlestick patterns once costs are included. The best-known example is Marshall, Young and Rose (2006) in the Journal of Banking & Finance, which tested candlestick strategies on Dow Jones component stocks and found no value for investors; Fock, Klein and Zwergel (2005) reported similar conclusions on intraday futures data. Crypto is a different market with different participants, but the sensible prior is skepticism, not enthusiasm.
How it is calculated
A tweezer is not an indicator with a line; it is a rule that either matches a pair of candles or does not. The only numerical ingredient is the tolerance that decides what "equal" means, and here it is scaled by volatility so that the same rule works on a $90 coin and a $0.15 coin.
Step by step:
- Measure volatility. Compute Wilder's 14-period Average True Range and read its value on the bar immediately before the first candle of the pattern. True Range for a bar is the largest of: high minus low, |high − previous close|, |low − previous close|. Wilder's smoothing averages those values with a 14-period recursive average.
- Set the tolerance. tolerance = 0.10 × ATR. On a 4-hour chart that is a tenth of a typical bar's range.
- Check the colours. For a top: candle 1 bullish, candle 2 bearish. For a bottom: candle 1 bearish, candle 2 bullish. Doji-ish candles with close equal to open fail the colour test in this strict version.
- Compare the extremes. For a top, take the absolute difference of the two highs. For a bottom, the two lows. If that difference is less than or equal to the tolerance, the pattern qualifies.
- Time-stamp it. The pattern is only complete at the close of candle 2. Anything you "see" before that close can still change.
``` ATR = Wilder ATR(14), read on the bar before candle 1 tolerance = 0.10 * ATR
Tweezer top: close1 > open1 (candle 1 bullish) close2 < open2 (candle 2 bearish) |high1 - high2| <= tolerance
Tweezer bottom: close1 < open1 (candle 1 bearish) close2 > open2 (candle 2 bullish) |low1 - low2| <= tolerance ```
An arithmetic illustration, not a real signal: if ATR(14) reads 2.00 before the pair forms, the tolerance is 0.20. Highs of 95.40 and 95.26 differ by 0.14 and qualify; highs of 95.40 and 95.08 differ by 0.32 and do not. If ATR were 4.00 instead, both pairs would qualify. The same two candles can be a tweezer in a volatile week and not a tweezer in a quiet one — that is a feature of ATR scaling, but you should know it is happening.
The optional context conditions used later are defined like this:
trend  (top)    : the 6 bars before candle 1 rose   by >= 1.5 * ATR
trend  (bottom) : the 6 bars before candle 1 fell   by >= 1.5 * ATR
volume          : volume(candle 2) / 20-bar average volume >= 1.2
swing  (top)    : the pattern's high is the highest high of the previous 20 bars
swing  (bottom) : the pattern's low  is the lowest  low  of the previous 20 bars
Default settings and variations
| Setting | Used here | Common variations | What changes |
|---|---|---|---|
| Tolerance for "equal" | 0.10 × ATR(14) | exact tick equality; fixed % of price; 0.05 or 0.25 ATR | Dominates the number of occurrences |
| ATR length | 14 (Wilder, 1978 default) | 10, 20, or the bar's own range | Mildly shifts tolerance in fast markets |
| Candle colours | Opposite colours required | Any colours; second candle must be a doji | Opposite colours is the stricter, more meaningful version |
| Candle spacing | Strictly adjacent | extremes matching within 2–5 bars | Loosening spacing multiplies matches |
| Matched price | Highs (top) / lows (bottom) | matching closes or matching opens | Different pattern, different behaviour |
| Shadow requirement | None | long upper/lower shadows required | Fewer, more visually convincing cases |
The tolerance is the setting that matters most and the one almost nobody states. Demand that the two highs match to the tick and tweezers become rare curiosities. Allow a quarter of an ATR and nearly every pair of opposite-colour candles near a turning point qualifies. The rule used on this page — 0.1 ATR — sits in the middle and still produces a very frequent pattern: 21,306 occurrences in 124,920 candles, which is roughly one new tweezer every six bars. Whenever you read a statistic about tweezers anywhere, the first question is "what counted as equal?"
The 14 in ATR(14) is simply Wilder's own default from New Concepts in Technical Trading Systems (1978) and carries no magic. It is used here because it is the convention and because consistency across twenty markets matters more than optimisation.
Four variants are reported in the test below, and they are nested rather than independent:
- Pattern only — every detected occurrence, no filter.
- With prior trend — the six bars before candle 1 moved against the pattern's expected direction by at least 1.5 ATR, so the pattern actually has something to reverse.
- With prior trend and volume — both the trend condition and relative volume on candle 2 of at least 1.2.
- With prior trend and swing extreme — both the trend condition and the pattern printing the extreme of the previous 20 bars.
There is no "swing extreme alone" variant in these numbers; the volume and swing variants always include the trend condition.
How to read it
Read location before shape. A tweezer bottom in the middle of a sideways chop is two candles that happen to share a low — which, on a 4-hour crypto chart, happens constantly. A tweezer bottom that prints the lowest low of the last twenty bars after a 1.5-ATR slide at least sits somewhere that a turn could matter.
Then read the pair itself. How much of candle 1's range did candle 2 take back? A tweezer bottom whose second candle closes near the top of the first candle's body says more about demand than one whose second candle is a thin green sliver. How long are the shadows at the matched level? A pair of long rejection wicks is a different observation from two bodies that simply ended at the same price.
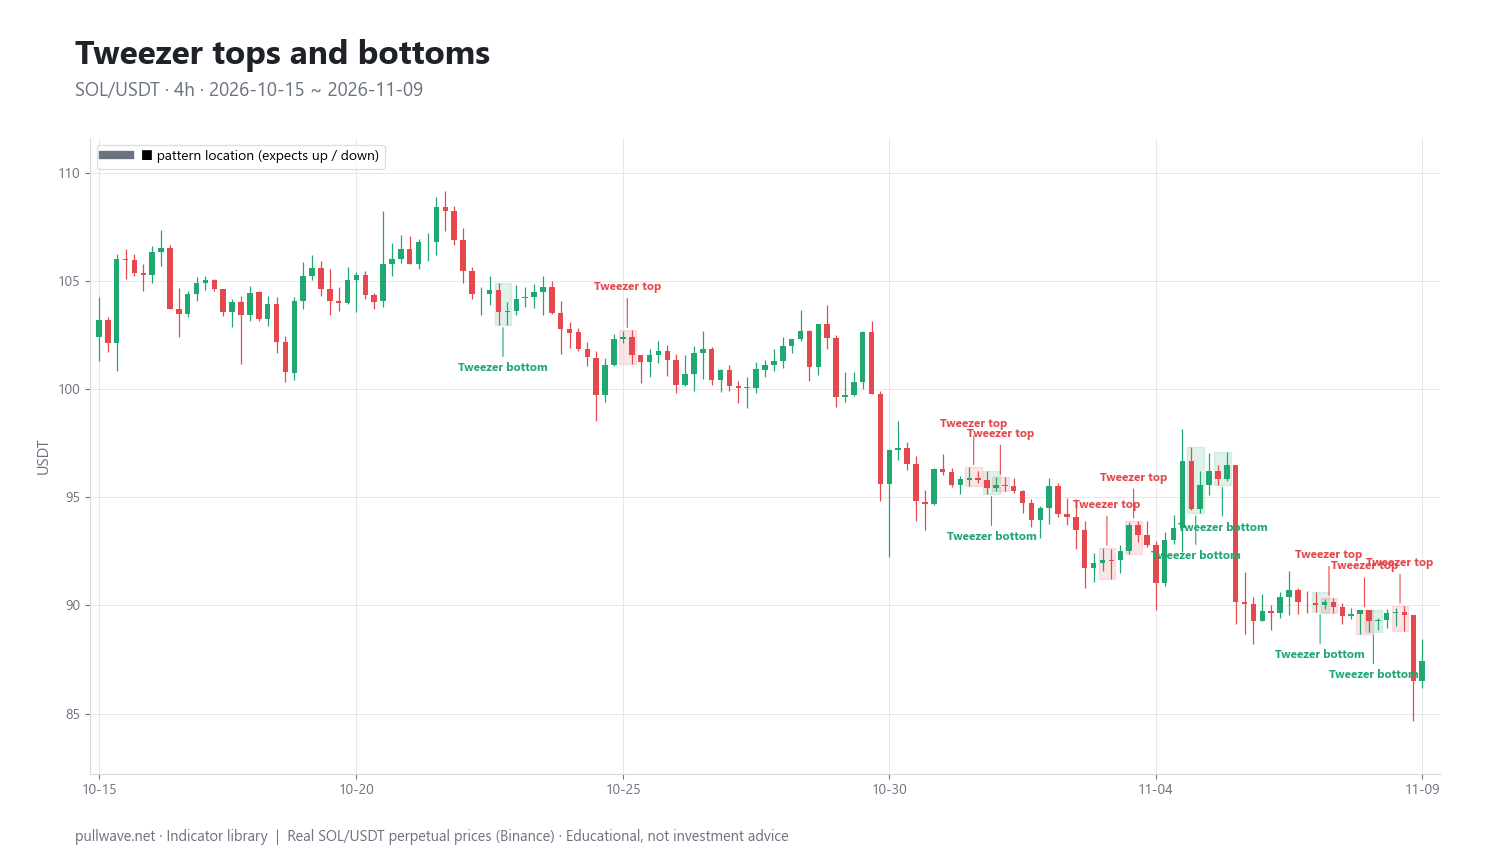
Figure 1 shows real SOL/USDT 4-hour candles with tweezer tops and bottoms outlined and labelled. Two things are visible immediately: the patterns are numerous, and they cluster — several appear within a day or two of each other during choppy stretches, which is exactly what you would expect when a market is oscillating inside a range and repeatedly brushing the same prices.
Finally, read volume honestly. Exchange OHLCV volume is a single aggregate number for the bar, not a split of buyers and sellers; every trade has both. Relative volume — the bar's volume divided by its own 20-bar average — tells you only that the bar was busier than recent bars. A value of 1.2 means 20% busier than usual. It is a crowd-size measurement, not an intention measurement.
How traders use it
1. As an invalidation level. The twin high or low is a precise price, so it is a natural place to say "if this is exceeded, my read was wrong." Works when the level coincides with structure the rest of the chart already respects. Fails when that same obvious level is where other traders have placed their stops — the smart-money literature argues stops tend to cluster at equal extremes, an interpretation rather than something measured here, and in 24/7 leveraged markets a brief spike through a well-known level is routine either way.
2. As confirmation at a pre-identified level. Some traders mark support and resistance first and only then look for candle evidence that the level is holding. A tweezer bottom at a level chosen hours earlier is a different piece of information from a tweezer bottom spotted in isolation. Works in range-bound regimes where levels repeat. Fails in strong trends, where the pattern fires against the trend over and over while price keeps going.
3. As a prompt to re-examine an open position. If you are already positioned and a tweezer prints against you at a level that matters, it is at minimum a reason to re-check the trade thesis and risk. Works as a review trigger. Fails as an automatic exit rule — given how often tweezers occur, acting on every one would shred a position by a thousand cuts and by fees and funding.
4. As a possible map of liquidity. In the smart-money framing, an equal extreme marks a price where resting orders are thought to cluster — again, an interpretation of order placement, not something tested by the data on this page. Traders who hold that view use the shape the opposite way round: not as a reversal signal but as a level price may revisit later. Works as a structural observation that keeps you aware of an obvious price. Fails as a timing tool, because "eventually revisited" has no deadline.
Checklist before giving a tweezer any weight:
| Check | What to look for | Why it matters |
|---|---|---|
| Completion | Candle 2 has closed | Unclosed candles change shape |
| Tolerance | Extremes within 0.1 ATR | "Looks equal" is not a rule |
| Prior move | At least 1.5 ATR against the pattern's direction over 6 bars | A reversal needs something to reverse |
| Location | Extreme of the last 20 bars, or a level you marked earlier | Separates structure from chop |
| Relative volume | Candle 2 at or above 1.2× its 20-bar average | Crowd size only, not direction |
| Timeframe fit | Pattern timeframe matches your holding period | A 4h pattern is noise to a weekly trader |
| Cost of being wrong | Distance to invalidation vs fees, funding, liquidation price | Decides whether the idea is even tradable |
If you want to learn the pattern properly, log it rather than trust memory. Pick one market and one timeframe, scroll forward bar by bar, record every pair that passes the tolerance rule, note the context flags, then record the close 6 and 12 bars later. Fifty honestly logged cases will teach you more than a hundred screenshots of the ones that worked.
Example on a real SOL chart
The chart is SOL/USDT perpetual on Binance, 4-hour candles, from 2026-04-23 to 2026-11-09 — 1,200 bars, last close 87.44. Applying the rule above, 199 tweezers were detected in that window: 90 bullish (tweezer bottoms) and 109 bearish (tweezer tops). That is a pattern roughly every six bars, or about one a day on a 4-hour chart. Frequency alone should temper any idea that this is a rare, high-information event.
Here are ten occurrences from the last stretch of the window, with the price at the pattern's final close and the subsequent price change 6 and 12 bars later (these are raw price changes, not direction-adjusted):
| Date (UTC) | Pattern | Close | 6 bars later | 12 bars later |
|---|---|---|---|---|
| 2026-11-01 04:00 | Tweezer top | 95.51 | −1.33% | −3.60% |
| 2026-11-03 04:00 | Tweezer top | 92.07 | +1.03% | +4.11% |
| 2026-11-03 16:00 | Tweezer top | 93.26 | +1.31% | −3.44% |
| 2026-11-04 20:00 | Tweezer bottom | 95.55 | −6.54% | −5.70% |
| 2026-11-05 08:00 | Tweezer bottom | 96.48 | −6.32% | −6.79% |
| 2026-11-07 04:00 | Tweezer bottom | 90.18 | −0.96% | −3.04% |
| 2026-11-07 08:00 | Tweezer top | 89.93 | −0.30% | −2.77% |
| 2026-11-08 00:00 | Tweezer top | 89.28 | −2.06% | −2.06% |
| 2026-11-08 04:00 | Tweezer bottom | 89.31 | −2.09% | −2.09% |
| 2026-11-08 16:00 | Tweezer top | 89.54 | −2.35% | −2.35% |
The pattern in this sample is not the candlestick pattern — it is the market. Price was falling through this stretch, from the mid-90s toward the 87.44 close. Four of the six tops were followed by lower prices six bars later, and all four bottoms were followed by lower prices too, two of them by more than 6%. A tool that "works" for tops and fails for bottoms during a decline is mostly reporting the trend back to you. Notice also how close together the events sit: 2026-11-08 00:00 (top) and 2026-11-08 04:00 (bottom) are adjacent bars pointing opposite ways, which is what happens when a definition is loose enough to fire constantly.
Across the 80 scored events in this illustration's log, 41 moved in the direction the pattern claimed after the outcome horizon — 41/80, about 51%, which is a coin flip with extra steps.
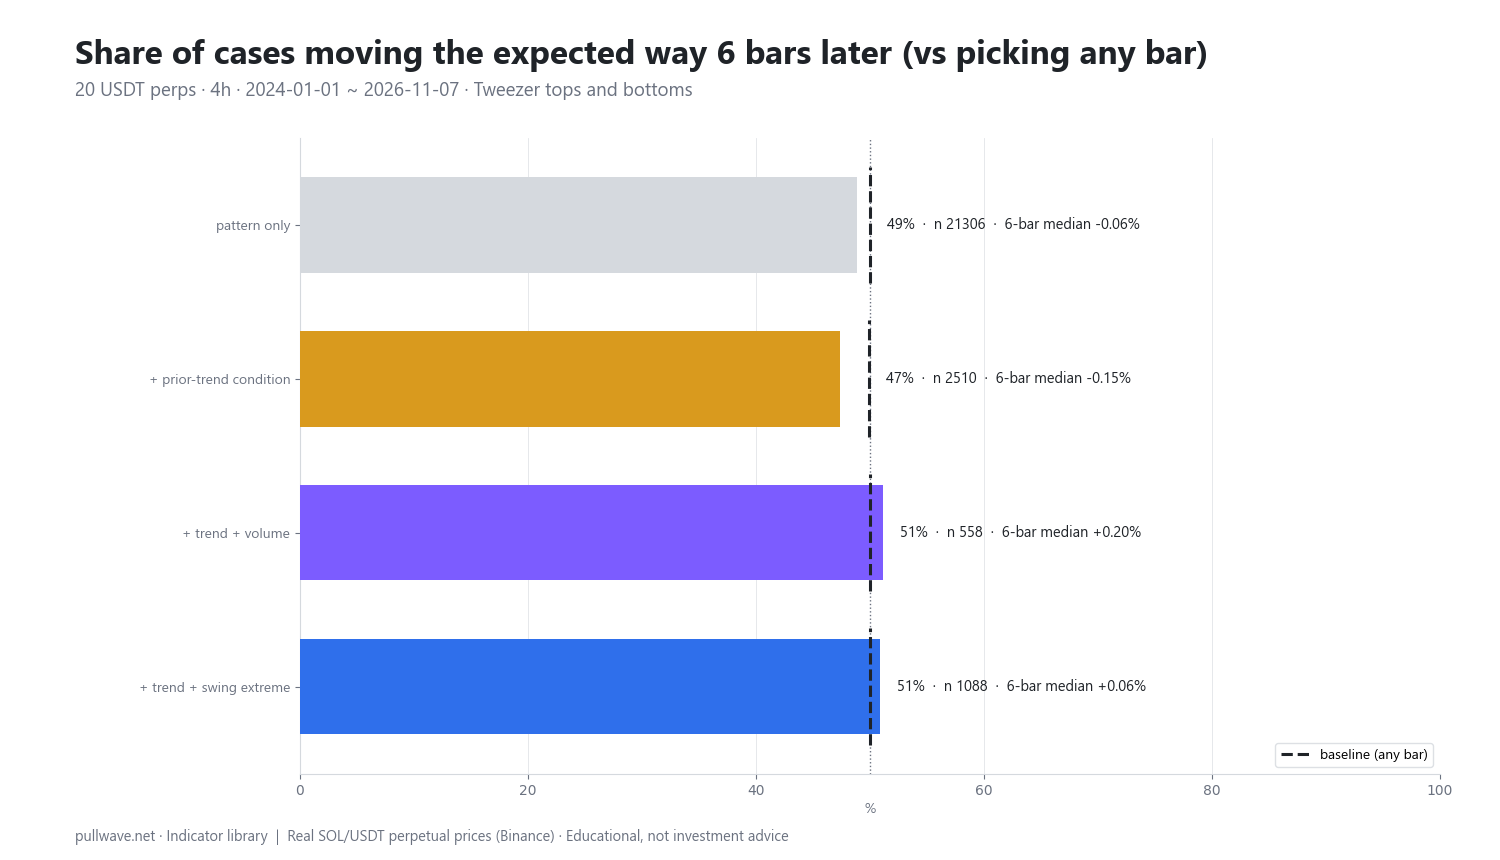
To get sample sizes worth discussing, the same rule was run over a pool of 20 liquid USDT-margined perpetuals (BTC, ETH, SOL, BNB, XRP, DOGE, ADA, AVAX, LINK, DOT, LTC, TRX, ATOM, NEAR, APT, ARB, OP, SUI, INJ, FIL) on 4-hour candles from 2024-01-01 to 2026-11-07 — about 124,920 candles. That produced 21,306 tweezers: 10,049 bullish and 11,257 bearish. For each one, the outcome is the close 6 bars (and 12 bars) after the pattern's last candle compared with that candle's close, and the baseline is the same share when any bar in the window is picked, weighted to match the mix of up- and down-expecting cases. Median moves here are direction-adjusted: positive means the expected way.
| Variant | n | 6-bar expected | Baseline | Median 6-bar | 12-bar expected | Baseline | Median 12-bar |
|---|---|---|---|---|---|---|---|
| Pattern only | 21,306 | 48.9% | 50.0% | −0.06% | 49.2% | 50.1% | −0.07% |
| + prior trend | 2,510 | 47.4% | 49.9% | −0.15% | 47.3% | 49.9% | −0.25% |
| + prior trend + volume | 558 | 51.1% | 50.0% | +0.20% | 49.6% | 50.1% | −0.02% |
| + prior trend + swing extreme | 1,088 | 50.9% | 50.0% | +0.06% | 47.7% | 50.0% | −0.29% |
Figure 2 plots these bars against the baseline with the sample size and median move for each variant. Read the results plainly. The raw pattern lands slightly below the baseline at both horizons, with a median move of −0.06% and −0.07% — in other words, indistinguishable from nothing, and certainly not a reversal signal. Adding the prior-trend requirement, which is supposed to make the pattern meaningful, makes it look worse: 47.4% and 47.3% against baselines near 50%, with median moves of −0.15% and −0.25%. Counter-trend tweezers in this sample were, if anything, continuation markers.
The two context variants that include a second filter show a small positive tilt at 6 bars — 51.1% with volume (n = 558) and 50.9% at a swing extreme (n = 1,088) — but both fade by 12 bars, to 49.6% and 47.7%, and the swing variant's 12-bar median is −0.29%. A 1.1-point edge at one horizon that disappears at the next, on a few hundred overlapping cases, is a hypothesis to test, not an edge to trade.
And the caveats are serious. Events overlap — the same multi-day move can contain a dozen tweezers — and crypto assets are highly correlated, so the effective sample is far smaller than n suggests. No fees, no slippage, no funding are included, and on perpetuals those costs alone would swamp a 0.2% median move. The thresholds (0.1 ATR, 1.5 ATR, 1.2× volume, 20-bar lookback, 6 and 12 bar horizons) are one arbitrary definition; change any of them and the numbers move. Results differ by timeframe, by market and by period. This is one illustration on one definition over one window — never proof that the pattern works or that it cannot.
Common mistakes
Hindsight. On a completed chart, the tweezers that preceded big turns jump out and the hundreds that preceded nothing are invisible. Scrolling back and admiring successful patterns teaches nothing. Count forward from a fixed rule instead.
Trading every occurrence. With one pattern roughly every six bars on a 4-hour chart, acting on all of them is a fee-generating machine. If a pattern is this frequent and shows no directional tilt, the default assumption is noise.
Eyeballing "equal". Two highs that look level on a zoomed-out screen can be half an ATR apart. Without a stated tolerance you are not applying a rule, you are pattern-matching on pixels.
Ignoring the timeframe. A 4-hour tweezer is two 4-hour candles; on the 1-hour chart that same price action is eight bars that may form something entirely different, and on the daily chart the whole pattern is about a third of a candle. The pattern's relevance should match your holding period.
Confusing it with a double top or bottom. Those are swing structures separated by a retracement and often by days or weeks. A tweezer is two adjacent bars. They are not the same evidence.
No confirmation and no plan. The pattern completes at a close and says nothing about what happens next bar. Deciding in advance what would confirm and what would invalidate turns an observation into a process.
Misreading volume. A high-volume second candle means the bar was busy, not that buyers "won". Aggregate volume contains no buy/sell split.
Forgetting crypto costs and leverage. On perpetual futures you pay taker fees, you pay or receive funding while positioned, and a leveraged position has a liquidation price that may sit closer than the pattern's natural invalidation level. A two-candle pattern whose stop distance is smaller than normal 4-hour noise is not a reason to raise size.
Combining it with other tools
Tweezers are at their most useful as a local detail inside an analysis you already had. A few sensible pairings:
- Horizontal levels and prior swings. The question is whether the twin extreme lands on a price that already mattered. Levels first, candles second.
- Trend filter. A 20-EMA, a higher-timeframe structure read, or a simple "higher highs and higher lows" check tells you whether you are fading a trend or trading with the dominant direction. The pooled data suggests counter-trend tweezers deserve the most skepticism.
- ATR. You are already using it for the tolerance; the same reading sizes a stop that sits beyond normal noise rather than inside it.
- Momentum tools. RSI or MACD divergence at the tweezer's level adds an independent observation. It does not make the pattern reliable, it just means two methods agree.
- Volume profile or VWAP. A twin rejection at a high-volume node or at a session VWAP is a more interesting coincidence than one in thin air.
- Liquidity framing. The equal highs and lows and liquidity-pool material treats the same shape as a presumed stop cluster. Holding both readings at once — wall or magnet — keeps you honest about which scenario the next bars are confirming.
- Sibling candle pages. Reading a single candle, the doji, the hammer and shooting star, engulfing patterns, harami and inside bars, morning and evening stars, three white soldiers and three black crows, marubozu, pin bars, and the page on patterns with trend and volume context all use the same evidence-first approach. Tweezers often overlap with those shapes — a tweezer bottom whose second candle engulfs the first is two descriptions of the same bars.
What tweezers are genuinely good for: a shared vocabulary for describing what price did at a level, a precise and objective invalidation price, and a small piece of context for tools that carry more weight. That is a modest job, and it is an honest one.
Frequently asked questions
Q. What is a tweezer top and a tweezer bottom in candlestick charting?
A tweezer top is two consecutive candles — the first bullish, the second bearish — whose highs are at effectively the same price, usually after an advance. A tweezer bottom is the mirror image: a bearish candle followed by a bullish candle sharing the same low, usually after a decline. The shared extreme is the entire pattern; it shows the market tested one price twice and was rejected both times.
Q. Are tweezer tops and bottoms reliable reversal signals?
On the evidence here, not on their own. Across 21,306 occurrences on 4-hour candles from 20 crypto perpetuals, the pattern closed in its expected direction 48.9% of the time after 6 bars against a 50.0% baseline, with a median move of −0.06%. Academic studies of candlestick patterns in equities and futures have generally found weak results after costs, so the sensible stance is to treat a tweezer as context rather than a signal.
Q. How close do the two highs or lows have to be for a tweezer?
There is no universal standard, which is why the tolerance must be stated. The rule used on this page is a difference of no more than 0.1 × ATR(14), measured on the bar before the pattern — about a tenth of a typical bar's range. Demanding exact equality makes the pattern rare; allowing a quarter of an ATR makes it almost ubiquitous, so any statistic about tweezers depends on this choice.
Q. What is the difference between a tweezer top and a double top?
A tweezer top is formed by two adjacent candles sharing a high, so on a 4-hour chart it spans eight hours. A double top is a swing structure in which price reaches a high, retraces meaningfully, then returns to the same area days or weeks later. They can appear on the same chart at different scales, but they describe different amounts of market activity and should not be treated as equivalent evidence.
Q. What timeframe works best for tweezers in crypto?
The timeframe should match your holding period rather than be chosen for signal quality. Lower timeframes produce far more tweezers and far more noise; higher timeframes produce fewer and give each one more context. Because crypto trades 24/7 with no overnight gaps, the classic gap-based variants of candlestick patterns adapt poorly — each candle usually opens right at the previous close — which is one reason patterns defined purely by price levels, like tweezers, carry over more cleanly than gap patterns.
Q. Does a tweezer need high volume to count?
Not by the strict definition, and volume should be interpreted carefully: exchange volume is an aggregate figure with no buy/sell split, and relative volume only tells you a bar was busier than its 20-bar average. In the pooled test, requiring a prior trend plus relative volume of at least 1.2 on the second candle produced 51.1% in the expected direction after 6 bars versus a 50.0% baseline from 558 cases — but that tilt faded to 49.6% by 12 bars, so it is a hypothesis to test, not a confirmed filter.
Key takeaways
- A tweezer is two adjacent opposite-colour candles that reject the same high (top) or low (bottom) within a stated tolerance — here, 0.1 × ATR(14).
- The tolerance defines the pattern. With this definition it is very frequent: 199 occurrences in 1,200 SOL 4-hour bars and 21,306 across about 125,000 pooled candles.
- In that pooled test the pattern alone matched its claimed direction 48.9% of the time after 6 bars against a 50.0% baseline, and adding a prior-trend requirement made it worse (47.4%), while trend-plus-volume and trend-plus-swing-extreme showed small 6-bar tilts that faded by 12 bars.
- Overlapping events, correlated assets, excluded fees and funding, and one arbitrary set of thresholds mean these numbers are an illustration, not proof in either direction.
- Use tweezers as vocabulary, as a precise invalidation level and as context for levels and trend tools — and log your own occurrences before giving the shape any weight.
Educational material. Charts use real SOL/USDT perpetual prices; past behaviour does not predict future results. Not investment advice.