Indicator & technique library · Candlestick patterns deep dive
Pin Bars and Rejection Wicks: Rules, Context, Evidence
At a glance
- A pin bar is a single candle whose body is at most 25% of the range, with one wick of at least 60% of the range and an opposite wick of at most 20%.
- The long wick says price traded to a level and was pushed back before the close — a map of rejection, not proof of a reversal.
- Across 124,920 4h candles on 20 USDT perpetuals, 10,948 pin bars closed in their expected direction 51.1% of the time after 6 bars against a 49.9% baseline.
- Adding prior-trend plus above-average volume raised that to 54.6% on 1,009 cases — a modest tilt before costs, and a hypothesis to test rather than an edge.
A pin bar is one candle that spent most of its life somewhere price did not stay. The bar pushed into a level, found no acceptance, and came back — leaving a long wick on one side, a small body at the other end, and almost nothing opposite. Traders call that long wick a rejection wick, and the candle a pin bar (short for "Pinocchio bar": the wick that lied about where price wanted to go).
Traders care because the pin bar is the cheapest piece of structure on a chart: it marks an exact price that was tested and refused inside one bar, which gives a natural invalidation level and a shared vocabulary for price action. It is also one of the most over-trusted shapes in retail trading, because long wicks are obvious in hindsight and appear constantly in crypto. This page gives the exact definition, the logic behind it, the common variations, and a transparent test on about 125,000 crypto candles — including the parts of that test that are unflattering.
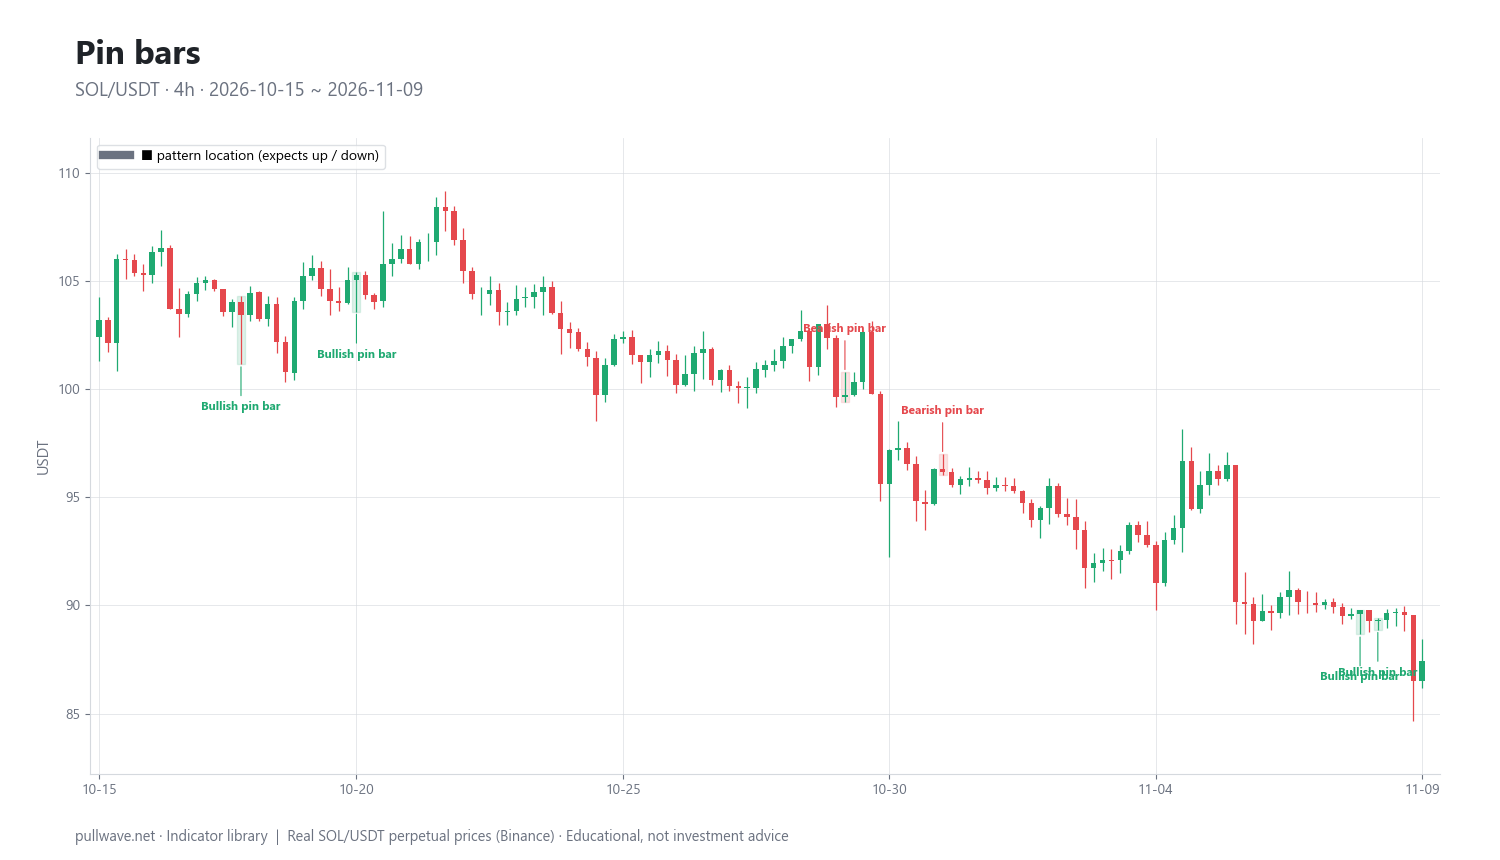
Figure 1 shows real SOL/USDT 4h candles with bullish pins (long lower wick) and bearish pins (long upper wick) outlined and labelled. Two things stand out immediately: they are not rare, and not all of them sit at anything you would afterwards call a turning point. Both observations matter more than any single textbook example.
What is a pin bar and a rejection wick?
A pin bar is defined by proportions, not by colour. Take the candle's range (high minus low), its body (the absolute distance between open and close) and its two wicks, then apply three conditions:
- Body ≤ 25% of the range — open and close finish close together, near one end of the bar.
- Long wick ≥ 60% of the range — one side of the candle is mostly empty space that price visited and left.
- Opposite wick ≤ 20% of the range — the close sits near the extreme furthest from the rejection.
A bullish pin has the long wick below: price sold off during the bar and closed back near the high, so the pattern "expects" up. A bearish pin has the long wick above. The body itself may be green or red in either case; a bullish pin with a slightly red body is still a bullish pin under these rules, because the geometry, not the colour, carries the information.
It is worth separating two words that get used interchangeably. A rejection wick is any unusually long wick on any candle, including ones with big bodies. A pin bar is the strict case where the wick dominates the entire bar and the body is almost incidental. Every pin bar contains a rejection wick; most rejection wicks do not belong to a pin bar.
The pin bar is the proportion-based cousin of the hammer, inverted hammer, shooting star and hanging man covered on the hammer and shooting star page in this series. Those classical names depend on where the candle sits in a trend, while the pin bar definition deliberately does not — which is exactly why it can be detected mechanically and the context added afterwards and measured separately. Note the direction of the overlap: these pin thresholds are stricter than the classical hammer rule (a lower shadow of at least twice the body with little or no upper shadow), so most pin bars would also be called hammers or shooting stars, while many hammers are too fat-bodied or too short-wicked to qualify as pin bars.
The idea behind it (theory and history)
Candlestick charting comes from Japanese markets and was popularised in the West by Steve Nison in Japanese Candlestick Charting Techniques (1991), the source of most of the English pattern names still in use. The often-repeated story that 18th-century rice trader Munehisa Homma invented candlesticks is poorly documented, and serious writers treat it as folklore rather than history. The term "pin bar" is newer again; it spread through the Western price-action community in the 2000s rather than from Nison's book, and the attribution is not firmly documented. Nothing below depends on who coined it.
The underlying logic is an auction argument. Inside a single bar, price traded out to an extreme and all the way back. Whatever orders were resting out there were filled or withdrawn, and by the close participants would no longer transact at that price. The candle therefore records where supply or demand appeared, with a precise and chart-visible boundary — something a line chart or a moving average cannot give you.
Two honest limits follow directly. First, a candle shows price and total traded volume, never a buy/sell split, so "buyers stepped in at the low" is an interpretation of a shape, not an observation of order flow. Every trade has both sides. Second, long wicks have purely mechanical causes: a stop run or liquidity sweep through an obvious swing level, a thin order book during quiet hours, a large market order hitting an illiquid book, or a brief liquidation cascade on perpetual futures can all print a textbook pin without anybody changing their opinion about value.
That is consistent with the research record. Academic studies of candlestick patterns on equities and futures have generally found weak or no profitable predictive power once realistic costs are included. None of this makes the pattern useless — it makes it a descriptive tool whose claims need to be sized honestly.
How it is calculated
There is nothing to smooth and nothing to fit. A pin bar is a set of ratios computed on one finished candle, which is both its strength (fully objective) and its weakness (the thresholds are arbitrary).
- Range.
high − low. Skip flat bars where the range is zero, which happens on illiquid markets and very low timeframes. - Body. The absolute difference between open and close. Direction of the body is ignored.
- Wicks. Upper wick = high minus the higher of open and close; lower wick = the lower of open and close minus low.
- Test the three conditions. Body at most 25% of the range, the long wick at least 60%, the opposite wick at most 20%.
- Assign direction. A long lower wick labels the bar bullish; a long upper wick labels it bearish. A candle cannot satisfy both.
``` range = high - low body = abs(close - open) upper = high - max(open, close) lower = min(open, close) - low
bullish pin: body <= 0.25range AND lower >= 0.60range AND upper <= 0.20range bearish pin: body <= 0.25range AND upper >= 0.60range AND lower <= 0.20range ```
The three thresholds add to 1.05, so there is a sliver of slack in how the remaining range is distributed, but the 60% wick requirement does almost all of the work and the close always lands near the far extreme. Importantly, the rules are scale-free: they say nothing about how big the candle is in absolute terms, so a tiny doji-like bar in a dead market can qualify alongside a violent 5% rejection. That is one of the first things most traders add a filter for.
The context filters used later in this page need four extra measurements: a 14-period Wilder ATR taken on the bar before the pattern; the prior move over the 6 bars before it; the pin's relative volume (its own volume divided by its 20-bar average); and whether the pin made the 20-bar extreme (the lowest low or highest high of the previous 20 bars).
Default settings and variations
| Component | Value used here | Why it exists |
|---|---|---|
| Body | ≤ 25% of range | Makes the bar about rejection, not direction |
| Long wick | ≥ 60% of range | The wick must dominate the candle |
| Opposite wick | ≤ 20% of range | Forces the close near the far extreme |
| ATR | 14-period Wilder, prior bar | Volatility yardstick, measured before the pattern so it is not contaminated by it |
| Prior move | ≥ 1.5 × ATR over 6 bars, against the expected direction | Defines "there was something to reverse" |
| Relative volume | ≥ 1.2 × its own 20-bar average | Says the bar was busier than usual — nothing more |
| Swing extreme | Lowest low / highest high of previous 20 bars | The pin sits at the edge of recent structure |
Why these numbers? They are conventional round values, not optimised ones, and that is deliberate: a pattern definition tuned to maximise a backtest result is the easiest way to fool yourself. The 14-period ATR is Wilder's original default and is widely used, so it makes the volatility yardstick comparable with other material. The 1.5 × ATR prior-move threshold is large enough that a reversal pattern has something real to reverse, but not so large that only crashes qualify. Relative volume of 1.2 is a mild filter — roughly "20% busier than the recent norm" — chosen so that the sample stays meaningful. The 20-bar lookbacks (for volume averaging and for the swing extreme) cover a little over three days on a 4h chart.
Common variations you will meet elsewhere:
- Looser ratios. Body ≤ 33%, wick ≥ 66%, or simply "the close is in the top or bottom third of the range". These multiply the number of hits and dilute whatever signal exists.
- An absolute size filter. Requiring range ≥ 1 × ATR removes pins made of pure noise and is probably the single most useful addition.
- A close-beyond rule. Requiring the close to finish beyond the prior candle's body makes the pin behave like a one-bar engulfing and reduces the count sharply.
- Two-bar pins. Some traders merge a spike bar and its immediate recovery bar into one synthetic pin, on the grounds that candle boundaries are arbitrary clock divisions.
- Session or level anchoring. Only counting pins that tag a pre-marked level, a prior day's high or low, or a round number.
Timeframe matters more than any of these. The same rules applied to 5-minute candles produce vastly more pins, most of them order-book artifacts. One crypto adaptation is worth noting too: these markets trade 24/7, so there are no overnight gaps and each candle opens at or near the previous close. Classical definitions that depend on gaps (morning and evening stars, for instance) need reinterpretation in crypto; the pin bar does not, because it lives entirely inside a single bar.
How to read it
Read a pin in three layers, in this order of importance.
Location. Where did the wick happen? A bullish pin whose low is the lowest of the previous 20 bars, tagging a level you had already marked, is a different object from one printed in the middle of a chop zone — even though the detector labels both identically. Location is what connects the shape to other participants' orders.
Approach. What did the previous bars do? A pin that arrives after a 1.5 × ATR slide is a response to pressure and has something to reverse. A pin after six flat, overlapping candles is mostly a liquidity artifact with a nice shape.
Shape and participation. Only then look at the proportions themselves and at whether the bar was busier than usual. Relative volume above 1.2 says more contracts changed hands than on a typical recent bar. It does not say who was buying.
A short checklist makes this reproducible:
| Check | Question to ask | Why it matters |
|---|---|---|
| Proportions | Body ≤ 25%, long wick ≥ 60%, opposite ≤ 20%? | Keeps the definition objective, not visual |
| Size | Is the range meaningful versus ATR? | A 0.2 × ATR pin is noise with a shape |
| Location | 20-bar extreme, or a level marked in advance? | Connects the wick to real order clusters |
| Approach | Did the prior 6 bars move ≥ 1.5 × ATR against the pin? | Separates reversal attempts from drift |
| Participation | Relative volume ≥ 1.2? | Busier bar, nothing about intent |
| Invalidation | Where does the read stop being true? | The wick tip is a concrete, pre-defined level |
The most practical output is that last row. A pin bar hands you a precise price — the tip of the long wick — beyond which the rejection story no longer holds. That reference point is useful whether or not you believe the pattern predicts anything at all.
How traders use it
- As a reversal cue at an extreme. A bullish pin at the lowest low of a range after a sharp decline, or a bearish pin at a new high. Works best in mean-reverting, range-bound regimes where the wick tags a level many participants are watching. Fails in strong trends, where counter-trend pins print repeatedly all the way up or down and each one looks compelling in isolation.
- As a pullback or continuation read. A bullish pin rejecting a moving average or a prior breakout level inside an established uptrend. Works in trending regimes with orderly pullbacks, where the pattern is aligned with the dominant flow. Fails exactly when the trend ends — the first genuine reversal often produces one more "continuation pin" on the way, and it is indistinguishable at the time.
- As a risk-definition tool. Many experienced traders use the wick extreme purely for stop placement and position sizing, independent of any directional claim. This is a measurement, not a prediction, and it is the least fragile use of the pattern. It fails when the wick is enormous relative to ATR, so sensible invalidation sits absurdly far away and the position size required becomes trivial.
- As a confirmation layer. A timing filter applied after something else — a level, a trend filter, a divergence — flagged a location. Fails when it degenerates into an excuse: on a busy crypto chart you can find a pin near almost any level if you look hard enough and allow yourself to loosen the ratios.
On perpetual futures, two crypto-specific costs attach to all of this. Funding is a recurring charge that compounds against a pattern whose measured median effect is a fraction of a percent, so holding a pin-based idea for days can cost more than the edge being claimed. And obvious wick extremes are precisely where stop and liquidation clusters accumulate, so leveraged positions with stops parked just beyond a famous wick sit in the most likely path of the next sweep. Lower leverage widens the distance between an ordinary retest and a liquidation.
Example on a real SOL chart
Figure 1 is SOL/USDT perpetual on Binance, 4h candles, from 2026-04-23 to 2026-11-09 — 1,200 bars, with a last close of 87.44. Applying the rules exactly as written detects 83 pin bars: 54 bullish and 29 bearish, which is roughly one every two and a half days on a single market. That frequency alone should temper expectations about how special any individual one is.
Here are the ten most recent occurrences, with the pin's close and the percentage change 6 and 12 bars later:
| Date (UTC) | Pattern | Close | After 6 bars | After 12 bars |
|---|---|---|---|---|
| 2026-10-09 04:00 | Bullish pin | 110.62 | −0.66% | −1.17% |
| 2026-10-10 16:00 | Bullish pin | 110.42 | +0.82% | −1.97% |
| 2026-10-11 20:00 | Bullish pin | 111.30 | −5.03% | −4.06% |
| 2026-10-14 16:00 | Bearish pin | 104.17 | +1.74% | −0.65% |
| 2026-10-17 20:00 | Bullish pin | 103.42 | +0.63% | +1.56% |
| 2026-10-20 00:00 | Bullish pin | 105.28 | +0.47% | +0.18% |
| 2026-10-29 04:00 | Bearish pin | 99.71 | −2.44% | −4.16% |
| 2026-10-31 00:00 | Bearish pin | 96.16 | −0.62% | −0.64% |
| 2026-11-07 20:00 | Bullish pin | 89.77 | −3.64% | −2.60% |
| 2026-11-08 04:00 | Bullish pin | 89.31 | −2.09% | −2.09% |
The results are mixed, and the mix is instructive. The three bullish pins on 9–11 October appeared during a decline that kept going; the one on 11 October was followed by −5.03% six bars later. The bearish pins late in October were followed by further weakness, which is what they claimed. The two bullish pins in early November again fell into a market that kept dropping — from the 110s in early October to the high 80s by 8 November, the bullish rejections repeatedly failed to mark a floor. Across the whole measured set in this window, 42 of 80 occurrences moved in the signal direction after the measurement horizon — close to half, which is what you would expect from a shape with little standalone predictive content.
One chart proves nothing either way, so the same rules were run over a pool of 20 liquid USDT-margined perpetuals (BTC, ETH, SOL, BNB, XRP, DOGE, ADA, AVAX, LINK, DOT, LTC, TRX, ATOM, NEAR, APT, ARB, OP, SUI, INJ, FIL) on 4h candles from 2024-01-01 to 2026-11-07, about 124,920 candles. The detector found 10,948 pin bars — 6,081 bullish and 4,867 bearish. Outcome is the close 6 or 12 bars after the pin versus the pin's own close; the baseline is the same share obtained by picking any bar in the window, weighted by the mix of up- and down-expecting cases, which lands near 50%.
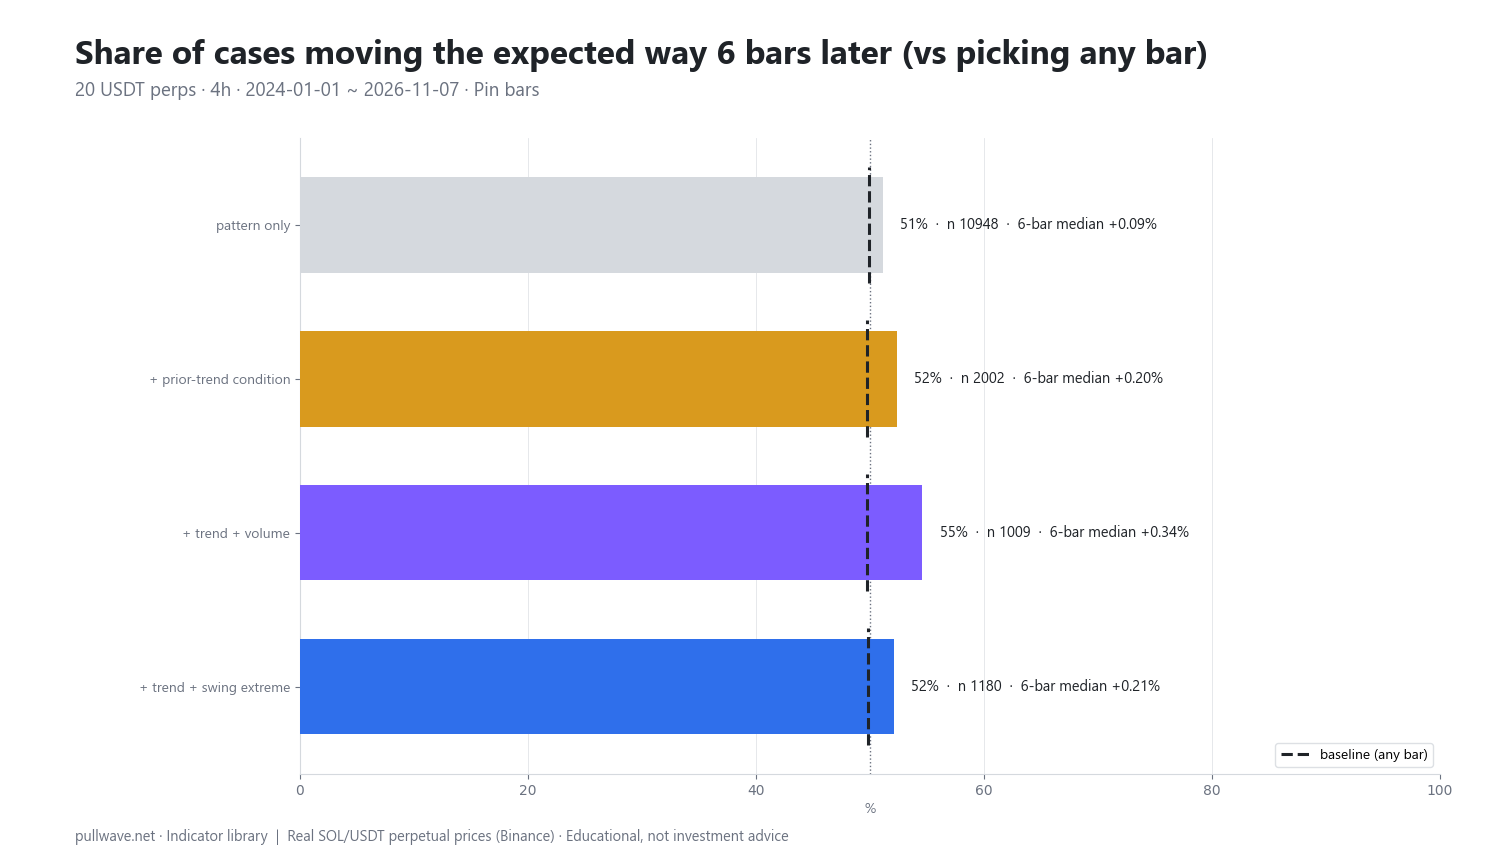
Figure 2 plots each variant's share of expected-direction closes against that baseline, with its sample size and median move:
| Variant | n | 6-bar | Base | Median 6b | 12-bar | Base | Median 12b |
|---|---|---|---|---|---|---|---|
| Pattern only | 10,948 | 51.1% | 49.9% | +0.09% | 50.7% | 49.9% | +0.07% |
| + prior trend | 2,002 | 52.4% | 49.7% | +0.20% | 51.1% | 49.6% | +0.11% |
| + trend + volume | 1,009 | 54.6% | 49.7% | +0.34% | 51.6% | 49.5% | +0.15% |
| + trend + swing extreme | 1,180 | 52.1% | 49.8% | +0.21% | 49.7% | 49.7% | −0.01% |
The volume and swing-extreme variants always include the prior-trend condition; there is no "swing extreme alone" row in these numbers. Read the table carefully. The raw pin bar sits 1.2 percentage points above baseline at 6 bars with a median move of +0.09% — economically nothing once spread, fees and funding are counted. Requiring a 1.5 × ATR move into the pin lifts the 6-bar share to 52.4% on 2,002 cases, and adding above-average volume takes it to 54.6% on 1,009 cases with a median of +0.34%. That is the most interesting cell on the page, and it is still a hypothesis to test, not an edge to deploy.
The swing-extreme variant is a reality check in the other direction: slightly better than baseline at 6 bars (52.1% vs 49.8%), then 49.7% against a 49.7% baseline at 12 bars with a median of −0.01%. Whatever effect exists appears to decay quickly, which is consistent with a short-lived liquidity story rather than a lasting change in direction. Note also the asymmetry in the raw counts — 6,081 bullish pins versus 4,867 bearish ones in the pool, and 54 versus 29 on SOL in this window — which tells you something about how crypto sells off and recovers intraday, and is a reminder that long lower wicks are simply more common.
The caveats are not boilerplate, and they are large enough to swallow the differences above. Pattern events overlap and are not de-duplicated, and the 20 assets are highly correlated, so the effective independent sample is far smaller than n suggests. No fees, slippage, spread or funding are included, and no trading rules, stops or targets are applied. The thresholds (25/60/20, 1.5 × ATR, 1.2 relative volume, 20-bar lookback) are one arbitrary definition; change them and the numbers move. And this is one timeframe, one asset class, one period. Treat all of it as an illustration, never as proof.
Common mistakes
- Hindsight selection. Your eye finds the pins that preceded big moves and skips the rest. This SOL window contains 83 of them; you will remember four.
- Treating the shape as the signal. The shape alone measured about one percentage point above random. Almost everything that produced a difference came from location, approach and participation — the context, not the candle.
- Ignoring timeframe. A 5-minute pin during a quiet hour is order-book noise; a daily pin summarises a full day of participation. Using evidence from one to argue about the other is a category error.
- No confirmation and no invalidation. Reacting to a pin's close with no follow-through condition and no price that proves the read wrong turns a context clue into a coin flip with leverage attached.
- Trading every occurrence. At roughly one pin every two and a half days per market, constant exposure to a sub-1% median effect pays costs every time while waiting for an effect that may not survive them.
- Reading intent into volume. Relative volume ≥ 1.2 only says the bar was busier than its own 20-bar average. Exchange OHLCV volume has no buy/sell split, and "aggressive buyers" is a story layered on top of a single number.
- Forgetting the sweep. In leveraged 24/7 markets, the most visually perfect pins often form exactly where stops cluster. The wick can be a consequence of forced orders rather than evidence of new conviction.
Combining it with other tools
Pin bars are a vocabulary for where, not a system for when. The most valuable habit is to mark ranges, swing highs and lows, prior-day extremes and significant levels before any pin exists. A wick that tags a level you identified yesterday is a genuinely different observation from one you found because the wick drew your eye today.
ATR makes "long wick" comparable across markets and timeframes, and tells you whether invalidation beyond the wick tip is a sensible distance or an unworkable one. A trend filter — a 20- or 50-period moving average, or a simple higher-highs/higher-lows test — separates counter-trend attempts from pullback rejections; in the pooled numbers, the prior-move condition changed the result most, with relative volume second and swing-extreme location adding little beyond 6 bars. Volume context is the third layer, used only for what it is: a measure of how busy a bar was.
The pin also belongs to a family that is best read together: the doji (indecision, no single dominant wick), the hammer and shooting star (the trend-positioned classical versions of this same shape), engulfing, harami and inside bars, tweezers, morning and evening stars, and marubozu (all body, no wicks — the exact opposite case). The series page on patterns with trend and volume context covers how the same context filters behave across all of them, and the page on reading a single candle explains the building blocks.
If you want to test the pattern yourself, the method matters more than the result. Fix your exact ratios in advance and write them down. Scan one market over at least a year on the timeframe you actually trade. Log every occurrence — date, direction, prior 6-bar move in ATR units, relative volume, whether it made the 20-bar extreme — without skipping the ugly ones. Then measure the close 6 and 12 bars later and compare against a random-bar baseline on the same data, not against your memory. Finally, subtract realistic costs. That discipline is what protects you from the version of the pattern that exists only in hindsight.
So what is the pin bar genuinely good for? Three things. It gives you precise language for describing what a bar did. It supplies an objective invalidation price that does not depend on being right about direction. And it marks locations worth watching for other tools to confirm or contradict. Those are modest claims, and they are the ones the evidence supports.
Frequently asked questions
Q. What is a pin bar in trading?
A pin bar is a single candle with a small body and one long wick, and almost no wick on the opposite side. Using the definition on this page, the body is at most 25% of the candle's range, the long wick is at least 60%, and the opposite wick is at most 20%. A long lower wick is a bullish pin; a long upper wick is a bearish pin.
Q. What does a long rejection wick mean?
It means price traded to that extreme during the bar and did not stay there, closing far away from it. That tells you a level was tested and refused within a single bar, which is useful for marking invalidation. It does not tell you who traded, because exchange volume has no buy/sell split, and it does not tell you what happens next.
Q. Is a pin bar the same as a hammer or shooting star?
They describe the same basic shape with different rules. Hammer, inverted hammer, shooting star and hanging man are classical names that depend on where the candle sits in a trend, while "pin bar" is a purely proportional definition that can be detected anywhere. The pin thresholds are stricter than the classical hammer rule, so most pin bars would also be called hammers or shooting stars, while many hammers have bodies that are too large or wicks that are too short to qualify as pin bars.
Q. Do pin bars actually work in crypto?
In the test on this page — 10,948 pin bars across 20 USDT perpetuals on 4h candles — price closed in the expected direction 51.1% of the time after 6 bars against a 49.9% baseline, with a median move of 0.09%. Adding a prior 1.5 × ATR move plus above-average volume raised that to 54.6% on 1,009 cases with a median of 0.34%. Those are small tilts measured before costs on overlapping events in correlated markets, so they are best treated as a hypothesis rather than an edge.
Q. What timeframe is best for pin bars?
There is no universally best timeframe, but higher timeframes filter more noise because each candle reflects more participation. The numbers here come from 4h candles; on 5- or 15-minute crypto charts the same rules fire far more often and a larger share of hits are order-book artifacts. Test the pattern on the exact timeframe you trade rather than assuming results transfer.
Q. Where is a pin bar invalidated?
The natural invalidation point is beyond the tip of the long wick, because trading through it says the rejection did not hold. That is the pattern's most practical contribution: an objective price level for risk definition, independent of any prediction. In leveraged crypto markets, remember that obvious wick extremes are also where stop and liquidation clusters sit, so they are frequently revisited.
Key takeaways
- A pin bar is defined by proportions — body ≤ 25% of range, one wick ≥ 60%, opposite wick ≤ 20% — and records a price that was tested and refused inside a single bar.
- On 124,920 4h candles across 20 crypto perpetuals, 10,948 pin bars closed in the expected direction 51.1% of the time after 6 bars versus a 49.9% baseline: the shape on its own is close to noise.
- Context holds the small differences: prior trend 52.4%, prior trend plus above-average volume 54.6% on 1,009 cases, while the swing-extreme variant faded to 49.7% against a 49.7% baseline by 12 bars.
- On SOL/USDT 4h from 2026-04-23 to 2026-11-09 there were 83 pin bars (54 bullish, 29 bearish), and 42 of 80 measured occurrences moved in the signal direction — a mixed, roughly coin-flip illustration.
- The pattern's dependable value is descriptive: vocabulary for price action, a precise invalidation level beyond the wick, and context for other tools — not a standalone signal.
Educational content only. Nothing here is a recommendation to buy or sell any asset, and historical pattern statistics do not predict future results.
Educational material. Charts use real SOL/USDT perpetual prices; past behaviour does not predict future results. Not investment advice.