Indicator & technique library · Candlestick patterns deep dive
Marubozu Candlestick Explained: Rules, Data and Uses
At a glance
- A marubozu is a candle whose body covers almost the whole range — here, body at least 90% of the range and at least 1.0 ATR.
- The traditional reading is continuation: one side controlled the period from open to close.
- In a pooled test of 1,538 marubozu candles on 20 USDT perpetuals (4h, 2024–2026), price continued in the candle's direction 47.3% of the time after 6 bars, below the ~49.9% baseline.
- Its most durable use is descriptive: marking displacement, defining invalidation levels and sizing risk — not forecasting the next move.
A marubozu is a candle with almost no wicks. The open sits at one extreme of the bar and the close at the other, so the body covers nearly the whole range. It is the visual opposite of a doji: instead of indecision, it shows one side setting the price from the first second of the period to the last.
Traders care about marubozu candles for two different reasons, and it pays to keep them separate. The descriptive reason — a full-bodied, larger-than-usual candle is the cleanest signature of displacement and hands you obvious levels — holds up well. The predictive reason — the folk reading that a marubozu means continuation — is much weaker than the textbooks suggest, as the data below shows.
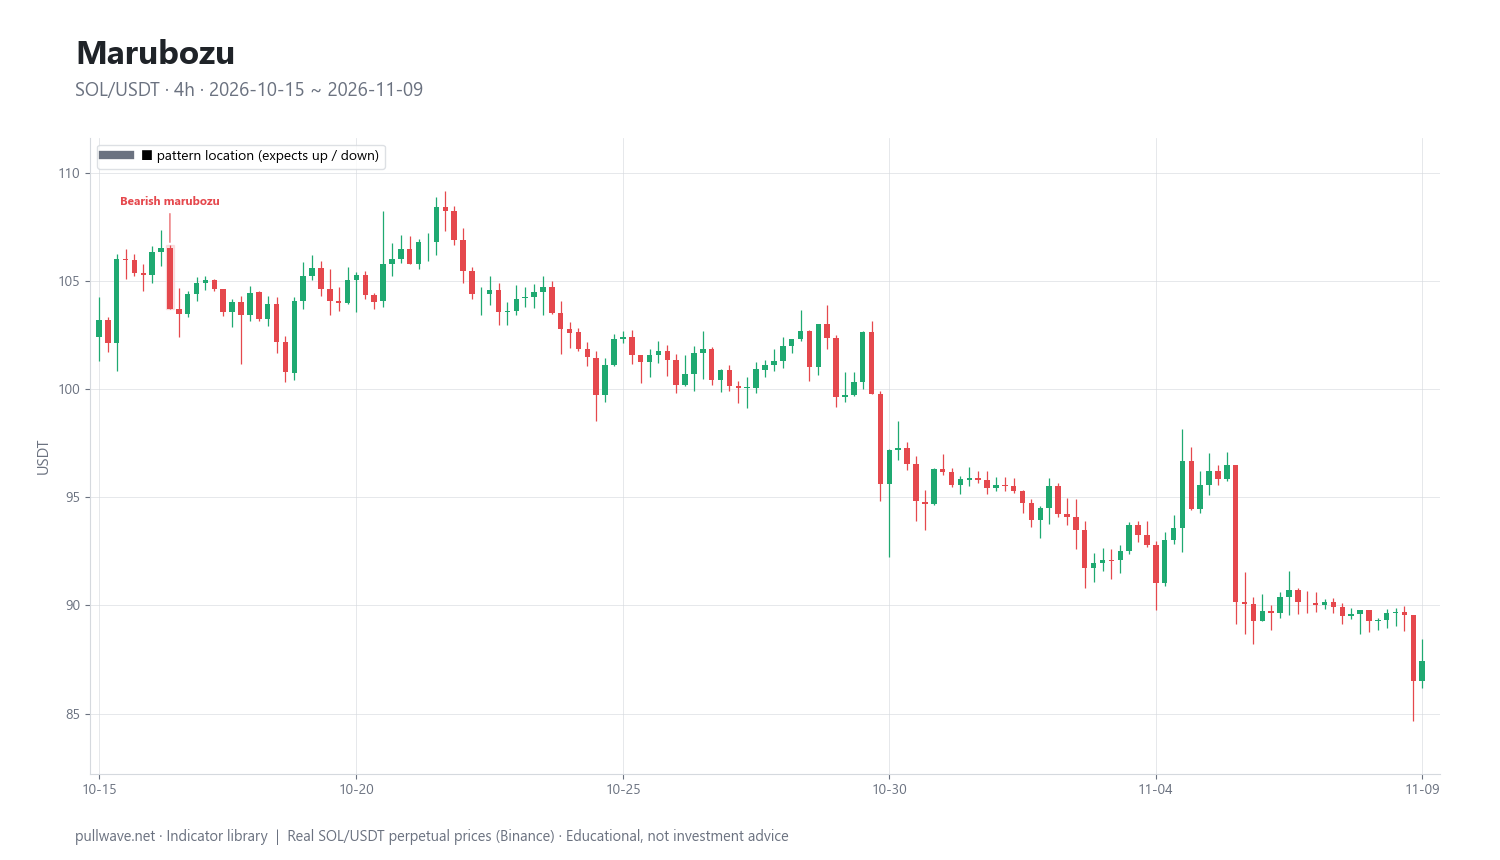
Figure 1 shows SOL/USDT 4h candles with every marubozu in the sample window outlined and labelled, bullish and bearish in different colours. Notice how rare they are, and how several sit at the end of a leg rather than at the start of one.
What is Marubozu and Strong Candles?
"Marubozu" is a Japanese candlestick term usually translated as "bald" or "shaven head" — a candle with its hair, the wicks, cut off. Strictly, a bullish marubozu opens exactly at the low and closes exactly at the high; a bearish one opens at the high and closes at the low. In real 24/7 crypto data a tick-perfect version almost never occurs, so practitioners use a tolerance: the body must be some high percentage of the range.
"Strong candle" is the broader family: any bar with a dominant body relative both to its own range and to recent volatility. A candle can have a 95% body and still be meaningless if the whole bar is a tenth of the average true range — nothing happened, it just happened in a straight line. A usable definition therefore needs two conditions: shape (body vs range) and size (body vs recent volatility).
Classical literature also recognises partial forms: a full marubozu with no wick at either end, an opening marubozu with no wick at the open end, and a closing marubozu with no wick at the close end. The closing variant is the one most traders watch, because the close is the price the market agreed on when the period ended. The 90% body rule used here does not separate these variants, but the distinction is worth knowing when reading older material.
The idea behind it (theory and history)
Candlestick charting comes from Japanese rice markets and was popularised in the West by Steve Nison, whose 1991 book Japanese Candlestick Charting Techniques introduced most of the pattern vocabulary English-speaking traders still use, marubozu included. The often-repeated story that Munehisa Homma invented candlesticks in the 18th century is poorly documented; treat it as folklore and judge the patterns on what they describe.
The logic of the marubozu is the simplest in the candlestick vocabulary. A wick is a rejected price: the market traded there and came back. No upper wick on a green candle means sellers never pushed price back below the eventual close, even briefly. The candle is a record of uninterrupted, one-directional pressure for the entire period.
From that, the traditional inference is continuation — whoever controlled this period is likely to control the next. This is the opposite of most other patterns in this series. Engulfing candles, harami, morning and evening stars, tweezers and pin bars are all reversal readings. The marubozu says the prior move is working. That asymmetry matters, because a huge one-sided candle after an extended run can equally be the last buyer or the last seller — capitulation, not conviction.
In the "smart money" vocabulary the same bar is called a displacement candle, and a run of them creates the three-candle fair value gap those methods trade back into. The observation is identical; only the interpretation differs. For context, academic studies of candlestick patterns on equities and futures have generally found weak or no profitable predictive power once costs are included. That does not make the shapes useless — it makes them a description of price action rather than a forecasting engine.
How it is calculated
A marubozu is not a smoothed line; it is a per-candle test that either passes or fails. For each candle:
- Compute the range: high minus low. Skip the bar if the range is zero.
- Compute the body: the absolute difference between close and open.
- Compute the body ratio: body divided by range. Require at least 0.90, leaving 10% or less for both wicks combined.
- Compute the 14-period Wilder ATR on the bar before the candle, so the volatility yardstick does not include the bar being tested.
- Require the body to be at least 1.0 ATR. On 4h data that means the body alone must span roughly a normal bar's entire range, in one direction, with no wicks.
- Classify direction: close above open is bullish, close below open is bearish. The expected direction is the candle's own colour — this is a continuation pattern.
``` range = high - low body = |close - open| body_ratio = body / range
TR_t = max(high_t - low_t, |high_t - close_{t-1}|, |low_t - close_{t-1}|) ATR_t = (ATR_{t-1} * 13 + TR_t) / 14 # Wilder smoothing, 14 periods
marubozu = (body_ratio >= 0.90) AND (body >= 1.0 * ATR_{t-1}) direction = bullish if close > open else bearish ```
Two notes. The ATR is Wilder's, from New Concepts in Technical Trading Systems (1978), not a simple average of true range; its slower smoothing is what you want in a yardstick. And on perpetual futures there are no overnight gaps, so each open sits essentially at the previous close — classical definitions built around gaps do not transfer cleanly to 24/7 markets. The ATR filter also means "strong" is judged relative to what the market has recently been doing, not as an absolute percentage.
Default settings and variations
| Setting | Default | Why | Common variations |
|---|---|---|---|
| Body / range | ≥ 90% | Tolerates the small wicks real data produces, excludes meaningful rejection | 95% (stricter), 80% (looser) |
| Body size | ≥ 1.0 × ATR(14) | Separates a large move from a quiet drift in a straight line | 1.5 × ATR, 0.75 × ATR |
| ATR period | 14, Wilder | Wilder's default; stable but adaptive | 20 or 50 |
| ATR reference bar | bar before the candle | Stops the candle inflating its own yardstick | Including the bar (easier to pass) |
| Wick symmetry | not required | 90% body already caps total wick | Cap each wick separately |
| Timeframe | 4h | Enough bars to sample, filters microstructure noise | 1h (noisier), 1D (very few) |
Context filters change the question from "did a marubozu occur?" to "did one occur somewhere meaningful?" Four variants are tested below:
- Pattern only — every detected occurrence, no filter.
- With prior trend — the close must be on the same side of a rising or falling 20-period EMA, so the candle agrees with the local trend.
- With prior trend + volume — the trend condition and relative volume (volume divided by its own 20-bar average) of at least 1.2.
- With prior trend + swing extreme — the trend condition and a close beyond the previous 20-bar range.
The last two always include the trend condition; there is no "volume alone" column. One honesty note: exchange OHLCV volume is a single aggregate per bar, not a buy/sell split. Relative volume only says a bar was busier than usual.
How to read it
Start with the raw statement. A bullish marubozu says price opened near its low, never traded meaningfully below the open, and closed near its high. A bearish marubozu says the mirror image. That is the whole message.
Then ask three context questions. Where is it? A marubozu breaking out of a multi-day range is a different animal from one printed on the fifth consecutive leg of a vertical move — initiation versus exhaustion, same shape. How big is it? Very large one-sided candles in crypto often come from liquidation cascades on perpetual futures, where forced closures push price further and liquidate more positions; the move is real but the conviction behind it is mechanical, and such moves are frequently part-retraced. What happened next? A marubozu immediately absorbed — the next candle trades back inside its range and closes there — has already failed its own premise.
Remember too that a marubozu is a timeframe artefact. A 4h marubozu is four 1h candles that will show wicks and two-sided trade on that lower chart. The shape exists only at the resolution you chose.
How traders use it
As a map of displacement. Marking full-bodied, 1-ATR-plus candles gives a skeleton of where the market moved decisively versus where it rotated; swing points created by a marubozu tend to be the structurally important ones. This works in every regime because it makes no forecast, and fails the moment "this bar was decisive" becomes "so the next one will be."
As a source of invalidation levels. The bar offers two objective prices: the extreme the move started from and the body's midpoint. That works because the levels are visible to everyone; it fails when obvious extremes attract clustered stops that leveraged markets routinely sweep.
As breakout confirmation. Many traders require a range break to close with a full body beyond the boundary rather than wicking through it. This works best in expanding-volatility, trending regimes, and fails in chop, where the same rule produces a stream of breaks that reverse — and the 24/7 clock supplies plenty of thin-book hours that manufacture full-bodied fakes.
As a volatility and sizing input. A 1-ATR body implies structural stops will be wide, so fixed risk means a smaller position. Reading the candle as a volatility event rather than a direction signal is unglamorous and probably the most useful item here.
A fifth use is the inverse: treating a marubozu at the extreme of an extended move as a warning of exhaustion. The data below gives that reading more support than the textbook one.
Example on a real SOL chart
Figure 1 is SOL/USDT perpetual on Binance, 4h candles, 23 April 2026 to 9 November 2026 — 1,200 bars, ending at a close of 87.44. The rules found 11 marubozu candles: 8 bullish and 3 bearish, roughly one bar in a hundred. Ten of them, with the close and the raw change 6 bars (one day) and 12 bars (two days) later:
| Date (UTC) | Label | Close | After 6 bars | After 12 bars |
|---|---|---|---|---|
| 2026-05-14 12:00 | Bullish marubozu | 93.10 | −4.40% | −7.18% |
| 2026-06-03 04:00 | Bullish marubozu | 75.21 | −8.12% | −12.10% |
| 2026-06-11 00:00 | Bullish marubozu | 65.23 | +2.70% | +2.47% |
| 2026-06-14 20:00 | Bullish marubozu | 71.24 | +3.78% | +3.16% |
| 2026-06-24 12:00 | Bearish marubozu | 67.29 | −1.52% | +7.03% |
| 2026-08-20 04:00 | Bullish marubozu | 86.16 | +4.93% | +9.63% |
| 2026-09-18 16:00 | Bullish marubozu | 114.19 | −2.66% | −3.32% |
| 2026-09-21 08:00 | Bullish marubozu | 116.77 | +0.44% | +0.21% |
| 2026-10-02 00:00 | Bullish marubozu | 121.22 | −1.56% | −0.41% |
| 2026-10-16 12:00 | Bearish marubozu | 103.72 | −0.15% | −1.49% |
Across all 11 events, 7 moved in the candle's own direction over the measurement horizon. Read that as mixed, not as evidence — eleven overlapping events on one asset in one window prove nothing. The dispersion is the real lesson: six-bar outcomes ran from +4.93% to −8.12%. The two highest closes listed, 18 September at 114.19 and 2 October at 121.22, were both followed by lower prices at both horizons. The bearish candle of 24 June shows how much the horizon matters: −1.52% after 6 bars, +7.03% after 12.
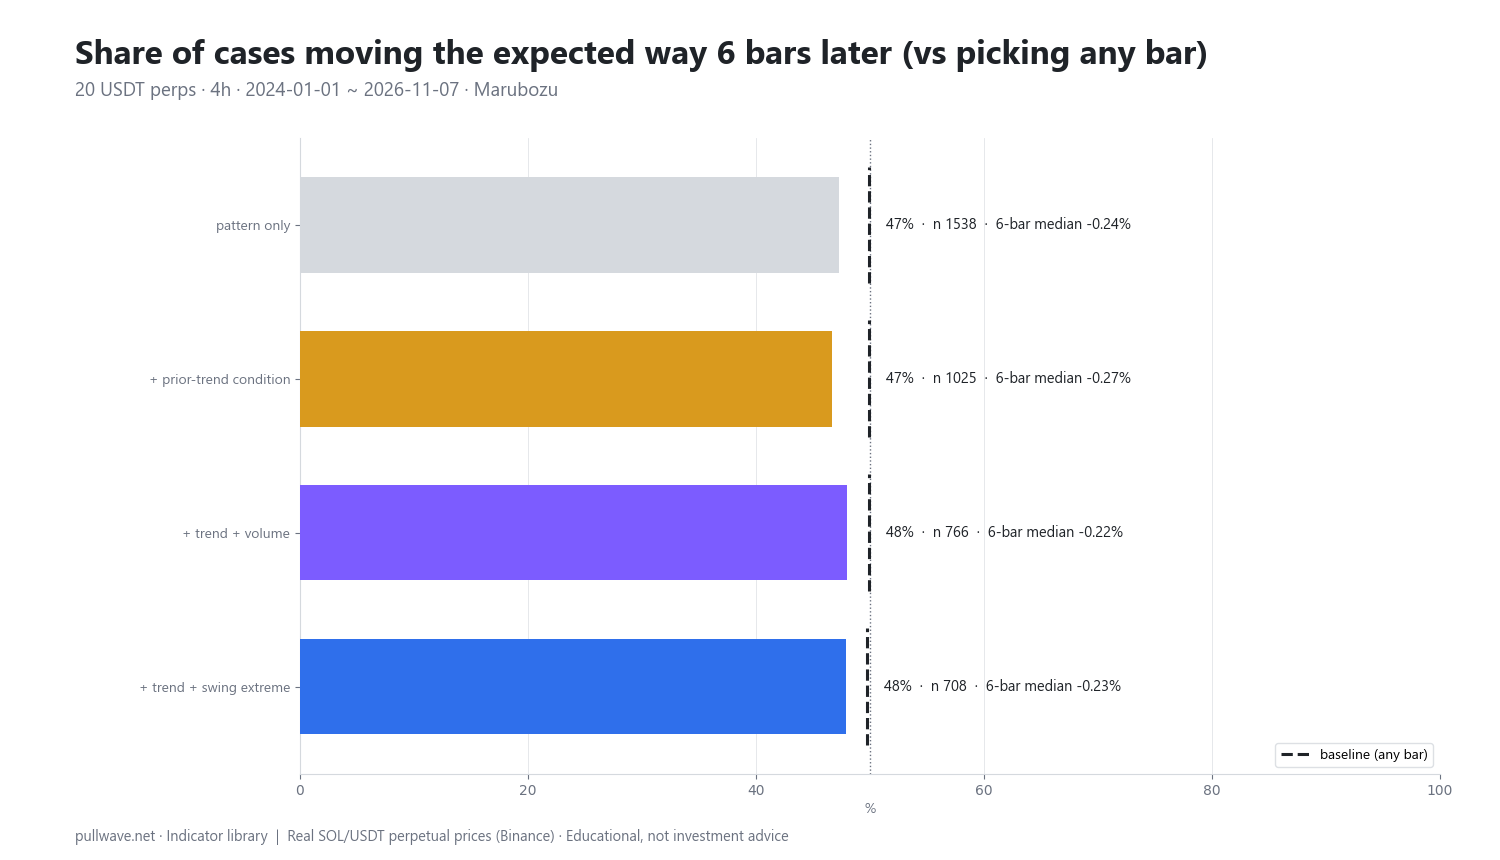
To get meaningful sample sizes, the same rules were run over 20 liquid USDT-margined perpetuals (BTC, ETH, SOL, BNB, XRP, DOGE, ADA, AVAX, LINK, DOT, LTC, TRX, ATOM, NEAR, APT, ARB, OP, SUI, INJ, FIL) on 4h candles from 1 January 2024 to 7 November 2026 — about 124,920 candles, containing 1,538 marubozu candles: 873 bullish and 665 bearish. Figure 2 compares the pattern alone with each context variant against the baseline, the share of the time price closed a given way after 6 or 12 bars when any bar is picked.
| Variant | n | 6 bars in direction | Baseline | Median 6b | 12 bars | Baseline | Median 12b |
|---|---|---|---|---|---|---|---|
| Pattern only | 1,538 | 47.3% | 49.9% | −0.24% | 47.6% | 49.9% | −0.19% |
| + prior trend (20-EMA) | 1,025 | 46.7% | 49.9% | −0.27% | 46.8% | 49.9% | −0.27% |
| + trend + volume ≥ 1.2× | 766 | 48.0% | 49.9% | −0.22% | 46.5% | 49.9% | −0.37% |
| + trend + close beyond 20-bar range | 708 | 47.9% | 49.7% | −0.23% | 46.3% | 49.7% | −0.29% |
Every variant came in below the baseline. The pattern alone continued in its own direction 47.3% of the time after 6 bars against 49.9%, with a direction-adjusted median move of −0.24% — the median case drifted slightly against the continuation reading. Requiring agreement with a rising or falling 20-EMA made it worse. Adding volume lifted the 6-bar figure to 48.0% but dropped the 12-bar figure to 46.5%.
There is no edge here to present even as a hypothesis. If anything, the consistency of the shortfall is mild support for the exhaustion interpretation: on this data, a big one-sided candle in the direction of the trend sat on average slightly closer to the end of a move than the start. Even that deserves caution. Events overlap and are not de-duplicated; the 20 assets are highly correlated, so one liquidation cascade can print a dozen "independent" cases in the same hour; fees, slippage and funding are excluded entirely, and on moves this small costs would swamp the difference. The thresholds are one arbitrary definition, and results differ by timeframe, asset and period. This is an illustration of how to test a pattern honestly, not a verdict.
Common mistakes
- Hindsight. Every marubozu that preceded a big run is obvious afterwards; the ones that preceded nothing are invisible. The cure is mechanical detection: define the rule, find every instance, then look.
- Ignoring timeframe. Scanning six timeframes until one shows a clean full body is search until satisfied. Pick the timeframe matching your holding period first.
- No context or confirmation. The raw pattern was below baseline. A marubozu should serve a thesis you already had — a level, a trend read — not create one.
- Trading every occurrence. The 1,538 pooled events across 20 assets average roughly one per market every two weeks, each with a median move under half a percent before costs.
- Confusing size with conviction. The largest one-sided perpetual candles are often forced liquidations in thin books, followed by partial retrace.
- Forgetting volume is aggregate. A high-volume marubozu was a busy bar, not one where "buyers outnumbered sellers." OHLCV cannot tell you that.
Combining it with other tools
The marubozu works better inside a checklist than as a trigger:
| Check | Question | Why it matters |
|---|---|---|
| Location | At a level, a range edge, or mid-air? | Mid-air strong candles say least |
| Trend stage | First displacement of a move, or the fifth? | Initiation vs exhaustion |
| Size vs ATR | 1 ATR, or 3? | Extreme bars are often cascade-driven |
| Relative volume | Busier than its 20-bar average? | Participation, not direction |
| Follow-through | Does the next candle hold beyond the body? | Fast absorption refutes the premise |
| Timeframe fit | Visible on the chart matching your horizon? | Prevents cherry-picking |
Useful companions are an ATR reading for sizing, a 20-EMA for trend context (noting it did not improve the numbers here), horizontal levels and prior ranges for location, and relative volume for participation. In smart-money language the same bar is a displacement candle and may form the middle leg of a fair value gap. Within this series the marubozu is the counterpart to the doji and sits alongside the hammer and shooting star, pin bars, engulfing candles, harami and inside bars, morning and evening stars, three white soldiers and black crows, and tweezers.
To test it yourself: write the exact rule down first, including body ratio, ATR multiple and ATR period. Scan a fixed window on a fixed timeframe, log every hit with date, direction and context flags, record outcomes at two horizons chosen before you start, and compare against the baseline for that same window. Then subtract plausible fees, slippage and funding before letting anything change. Fixing the rules first is the discipline that matters — tuning thresholds after seeing results will always find something that looks good on that data and rarely on the next.
Frequently asked questions
Q. What is a marubozu candlestick?
A marubozu is a candle with little or no wick, where the body covers almost the entire high-to-low range. A common working definition requires the body to be at least 90% of the range and at least 1.0 ATR in size, so the bar is both one-sided and genuinely large. A bullish marubozu opens near its low and closes near its high; a bearish one does the reverse.
Q. Is a marubozu bullish or bearish?
It depends on its colour: a green marubozu is bullish, a red one bearish, and the traditional reading is continuation in that direction. However, in a pooled test of 1,538 marubozu candles on 20 crypto perpetuals (4h, 2024–2026), price continued in the candle's direction only 47.3% of the time after 6 bars, against a baseline near 49.9%. A strong candle at the end of an extended move can mark exhaustion rather than continuation.
Q. What is the best timeframe for a marubozu in crypto?
There is no universally best timeframe, because the shape is an artefact of the resolution you choose — a 4h marubozu is four 1h candles with wicks of their own. Higher timeframes produce far fewer but structurally more meaningful candles, while 1h and below produce many that reflect thin-book noise during quiet hours. Choose the timeframe that matches your holding period before you scan, not after.
Q. Does high volume confirm a marubozu?
High relative volume only tells you the bar was busier than its own 20-bar average; exchange volume is an aggregate figure with no buy/sell split. In the pooled test, adding a 1.2× relative-volume filter on top of a trend filter raised the 6-bar continuation share to 48.0% but lowered the 12-bar share to 46.5%, both still below baseline. Treat volume as context for interpretation, not as confirmation of direction.
Q. What is the difference between a marubozu and an engulfing candle?
A marubozu is defined entirely by its own shape — body versus range and body versus ATR — and makes no reference to the previous candle. An engulfing pattern is relational: the current body must cover the previous candle's body, and it is read as a reversal. A single large bar can be both at once, a reminder that pattern labels overlap.
Q. Can a marubozu be used to place a stop loss?
Traders often treat the candle's opposite extreme or its midpoint as an invalidation level, because those prices are objective and visible. The caution is that obvious extremes attract clustered stop orders, and on leveraged perpetual futures those clusters are routinely swept. Risk should be governed by the distance to invalidation and your position size, not by how clean the level looks.
Key takeaways
- A marubozu is a candle whose body is at least 90% of its range and at least 1.0 ATR — one-sided pressure from open to close, with virtually no rejection.
- Its traditional continuation reading sits in direct tension with the reversal patterns elsewhere in this series; both can apply to the same bar depending on where it falls in a move.
- In a pooled test of 1,538 cases across 20 USDT perpetuals on 4h candles, continuation occurred 47.3% of the time after 6 bars versus a ~49.9% baseline, and every context variant also came in below baseline.
- Those results exclude fees, slippage and funding, use overlapping and highly correlated events, and rest on one arbitrary set of thresholds — they illustrate a testing method, not a verdict.
- The marubozu's durable value is descriptive: it marks displacement, defines clean invalidation levels, and signals that volatility has expanded, so position size should contract.
Educational material. Charts use real SOL/USDT perpetual prices; past behaviour does not predict future results. Not investment advice.