Indicator & technique library · Candlestick patterns deep dive
Candlestick Patterns with Volume and Trend Context Tested
At a glance
- Context means three mechanical checks added to a classic pattern: a prior move against the pattern, above-average relative volume on the last candle, and formation at a 20-bar swing extreme.
- In a pooled test of six reversal families over 124,920 4h candles on 20 USDT perpetuals, raw patterns resolved in their expected direction about as often as a randomly chosen bar.
- Adding the prior-trend plus volume filters lifted the 6-bar share to 54.0% for up-expecting patterns (n=1,506) and 53.2% for down-expecting ones (n=1,505) against baselines of 48.9% and 50.9%.
- Overlapping events, correlated assets, excluded costs and arbitrary thresholds mean these tilts are a hypothesis to test on your own data, not a demonstrated edge.
A candlestick pattern is a shape made by one to three bars: an engulfing, a harami, a star, a tweezer, a pin bar. On its own that shape is just a description of what the last few hours of trading looked like. "Context" means refusing to call the shape a signal until it passes a few mechanical checks: did price actually move against the pattern's claim beforehand, was the final candle busier than its own recent average, and did the pattern form at the edge of the recent range rather than in the middle of it?
Traders care because raw patterns are absurdly common. On 4h crypto charts you can find several per week on a single symbol, which is exactly why a pattern alone tells you very little. This page is the capstone of the candlestick series: it sets out the filter rules precisely, then reports a pooled test over roughly 125,000 four-hour candles to see whether the filters move the numbers at all — and how much of any movement is probably noise.
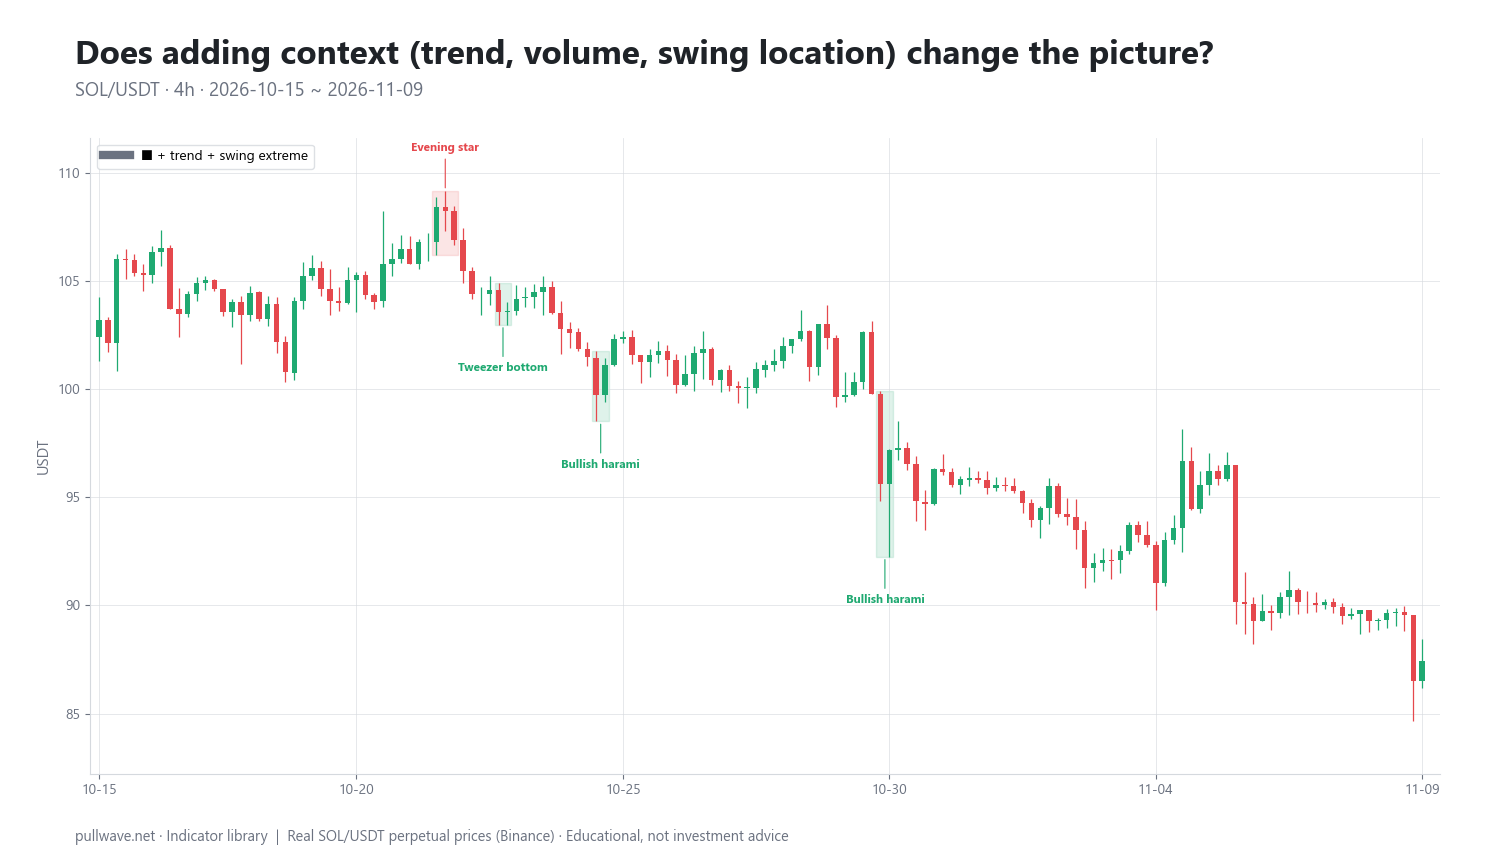
Figure 1 shows SOL/USDT 4h perpetual candles from 23 April 2026 to 9 November 2026, with only the reversal patterns that met both the prior-trend condition and the swing-extreme location outlined and labelled. Notice how few marks survive on 1,200 bars, and notice that they cluster: context filtering is mostly an exercise in throwing signals away.
What is Candle Patterns with Trend and Volume Context?
It is not a new indicator. It is a discipline applied to existing patterns: take a detected pattern, record the direction it claims, then require that direction to be supported by the bars around it before the pattern counts as an observation worth tracking.
Three context conditions are used throughout this page:
- Prior trend. A reversal pattern needs something to reverse. The six bars before the pattern's first candle must have moved against the pattern's expected direction by at least 1.5 × ATR(14).
- Relative volume. The pattern's last candle must have traded at least 1.2 times its own 20-bar average volume.
- Swing-extreme location. The pattern must have made the lowest low (for bullish patterns) or the highest high (for bearish patterns) of the previous 20 bars.
The "expected direction" is whatever the pattern claims: for reversal patterns, against the prior move. The six families pooled here are engulfing, harami, morning/evening star, three white soldiers / three black crows, tweezers and pin bars. Continuation shapes like marubozu use adapted conditions (a close on the same side of a rising or falling 20-EMA instead of a counter-move, and a close beyond the previous 20-bar range instead of a swing low or high).
One honesty note before anything else: exchange OHLCV volume is an aggregate figure for the market. It is not a split of buyers versus sellers — every contract traded has both. Relative volume only tells you that a bar was busier than its own recent normal.
The idea behind it (theory and history)
Candlestick charting came to Western traders largely through Steve Nison's 1991 book Japanese Candlestick Charting Techniques, which systematised the shapes and their names for an English-speaking audience. The frequently repeated story that 18th-century rice trader Munehisa Homma invented these patterns is poorly documented; treat it as folklore rather than history.
The theoretical argument for context is simple and reasonable. A bullish engulfing bar in the middle of a sideways drift is just two candles. The same shape after a sharp slide, on heavy participation, at the lowest price of the last several days, is a plausible description of sellers finishing and being absorbed. The pattern is the shape; trend, volume and location supply the story. Without a story, the shape is noise with a Japanese name.
The crypto-specific version of that story involves leverage. Perpetual futures markets run 24/7 with no overnight gaps, and liquidation cascades produce exactly the kind of bar context is trying to detect: an extended move against a crowded side, a spike in volume as forced orders hit, and a wick at a price nobody defended for long. Whether the wick marks a durable low or just a pause is the open question.
It is worth being blunt about the research. Academic studies on equities and futures have generally found weak or no profitable predictive power from candlestick patterns once trading costs are included. Marshall, Young and Rose tested candlestick strategies on Dow Jones stocks in the Journal of Banking & Finance (2006) and found no value for investors; Fock, Klein and Zwergel reached a similar conclusion on intraday futures data in 2005. Crypto is a different market with different microstructure, so those results do not transfer automatically — but they are the right prior to start from.
How it is calculated
The steps below are exactly what produced the numbers in the example section. Nothing is tuned after seeing results.
- Detect the pattern on 4h candles and record three things: the index of its first candle, the index of its last candle, and the direction it expects (+1 up, −1 down).
- Measure volatility with a 14-period Wilder ATR, taken on the bar before the pattern starts, so the pattern's own range cannot inflate the yardstick.
- Apply the prior-trend test. Compare the close just before the pattern with the close six bars earlier. For an up-expecting pattern that difference must be at most −1.5 × ATR; for a down-expecting pattern, at least +1.5 × ATR.
- Apply the volume test. Divide the last candle's volume by the average volume of the 20 bars ending with it. The ratio must be 1.2 or greater.
- Apply the location test. The pattern's low (bullish) must be the lowest of the previous 20 bars, or its high (bearish) the highest.
- Measure the outcome. Compare the close 6 bars and 12 bars after the pattern's last candle with that candle's close, signed so that positive always means "the way the pattern expected".
- Compare with a baseline. Compute the same share for any randomly chosen bar in the same window, weighted by how many up- and down-expecting cases there were. Without this step a 52% hit rate means nothing.
``` d = +1 (bullish pattern) or -1 (bearish pattern) f, L = index of first and last candle of the pattern
ATR = Wilder_ATR(14) at bar f-1 move = close[f-1] - close[f-7] # the 6 bars before the pattern trend_ok = (d == +1 and move <= -1.5ATR) or (d == -1 and move >= +1.5ATR)
relvol = volume[L] / mean(volume[L-19 .. L]) vol_ok = relvol >= 1.2
swing_ok = (d == +1 and min(low[f..L]) == min(low[f-20..L])) or (d == -1 and max(high[f..L]) == max(high[f-20..L]))
ret6 = d * (close[L+6] - close[L]) / close[L] * 100 ret12 = d * (close[L+12] - close[L]) / close[L] * 100 hit = ret6 > 0 ```
The four variants reported later are: pattern only (every detected occurrence), with prior trend, prior trend AND volume, and prior trend AND swing extreme. The volume and location variants always include the trend condition; there is no "swing extreme alone" column.
Default settings and variations
| Setting | Default here | Why | Common variations |
|---|---|---|---|
| Timeframe | 4h | Enough bars for sample size, slow enough to filter microstructure noise | 1h for active trading, 1D for swing work |
| ATR | Wilder ATR(14), bar before the pattern | 14 is the standard Wilder lookback; measured before the pattern to stay independent of it | ATR(10) or ATR(20); some use realised volatility |
| Prior-move lookback | 6 bars (one day on 4h) | A reversal needs a recent move, not a month-old one | 3–10 bars; or an EMA-slope condition |
| Prior-move size | ≥ 1.5 × ATR | Large enough to exclude drift, small enough to leave a usable sample | 1.0 × ATR (looser, more signals), 2.5 × ATR (stricter) |
| Volume average | 20 bars | Roughly three days on 4h; stable without being stale | 10, 30 or 50 bars |
| Relative volume threshold | ≥ 1.2 | A modest "busier than usual" bar, not a once-a-month spike | 1.5 or 2.0 for rarer, bigger events |
| Swing window | Previous 20 bars | Defines "the edge of the recent range" | 10 bars (local), 50 bars (structural) |
| Outcome horizon | 6 and 12 bars | One and two days on 4h; fixed horizon avoids hidden exit rules | Any horizon; or ATR-based targets and stops |
Every one of those numbers is an arbitrary choice. Loosen the ATR threshold and the sample grows while the filter weakens; tighten the volume threshold and you may end up with a few hundred events across three years, which is far too few to judge anything. That sensitivity is itself the lesson: if a result only appears at relvol ≥ 1.2 and vanishes at 1.3, it was never a result.
Crypto also forces one adaptation. Classic pattern definitions written for stock markets rely on overnight gaps — a morning star "gaps down then gaps up". Perpetual futures trade continuously, so each candle opens essentially where the last one closed. In practice the gap requirement is replaced by a tolerance: the open must sit near the previous close, with the star's body clearly separated from the two outer bodies.
How to read it
Read in this order, and stop as soon as a condition fails:
- What shape is it, and what does it claim? Name the pattern and its expected direction before looking at anything else.
- Is there something to reverse? No prior counter-move of meaningful size relative to ATR means a reversal pattern has nothing to work with.
- Where is it? At a 20-bar extreme, or buried inside a range where every third bar makes a shape?
- How busy was the last candle? Relative volume above its 20-bar average suggests participation; below suggests the shape formed on thin trade.
- What is the higher timeframe doing? A bullish reversal inside a clean daily downtrend is a counter-trend bet, whatever the 4h candles look like.
| Check | Pass condition | What failing it means |
|---|---|---|
| Pattern detected | Mechanical definition met, not "looks like" | You are pattern-matching by eye |
| Prior move | ≥ 1.5 × ATR against the expected direction over 6 bars | Nothing to reverse; likely range noise |
| Location | 20-bar lowest low / highest high | Mid-range shape, low information |
| Relative volume | Last candle ≥ 1.2 × its 20-bar average | Formed on quiet trade |
| Higher timeframe | Not fighting an obvious larger trend | Counter-trend exposure |
| Invalidation | A price level that says the idea is wrong | No plan, only a shape |
The honest reading of a fully qualified pattern is modest: "a counter-move stalled at a local extreme on above-average participation." That is a description, not a forecast.
How traders use it
1. As a volume reducer, not a signal generator. The main practical effect of context is that it deletes most occurrences. Fewer, better-documented observations are easier to review honestly than hundreds of vague ones. This works when your problem is overtrading; it fails if you then treat the survivors as high-probability trades simply because they are rare.
2. For structure and invalidation. A qualified pattern at a 20-bar extreme gives a concrete price that must hold for the interpretation to stand — the pattern's low or high, usually widened by a fraction of ATR because crypto wicks overshoot. This is arguably the most durable use of candles: they mark levels. It fails when volatility expands after the pattern and a once-sensible invalidation sits inside normal noise.
3. As confirmation for a thesis you already had. If a level, a trend filter or a funding extreme already had your attention, a qualified pattern is a timing cue with a defined invalidation. Works best when the pattern agrees with the higher timeframe; fails in choppy regimes where price oscillates through the level repeatedly and produces a qualified pattern in both directions within a day.
4. As a research log. This is the use most worth your time, and the testing recipe is simple:
- Write the rules down before you look: pattern definition, thresholds, horizon.
- Log every occurrence on the symbols and timeframe you actually trade — including the ones you would have skipped.
- Record market, timeframe, date, the context flags that passed, and the outcome at a fixed horizon.
- Include costs: taker fees both ways, realistic slippage and, for perps held over funding stamps, funding.
- Judge against the baseline rate for a random bar in the same window, not against the two examples you remember.
- Run it for a month or more, then ask whether the sample is even large enough to distinguish your result from chance.
Example on a real SOL chart
First the pooled test, because a single chart cannot answer the question. Six reversal families were detected on 4h candles across 20 liquid USDT-margined perpetuals (BTC, ETH, SOL, BNB, XRP, DOGE, ADA, AVAX, LINK, DOT, LTC, TRX, ATOM, NEAR, APT, ARB, OP, SUI, INJ, FIL) — 124,920 candles from 1 January 2024 to 7 November 2026. No fees, no slippage, no trading rules; overlapping events were not de-duplicated.
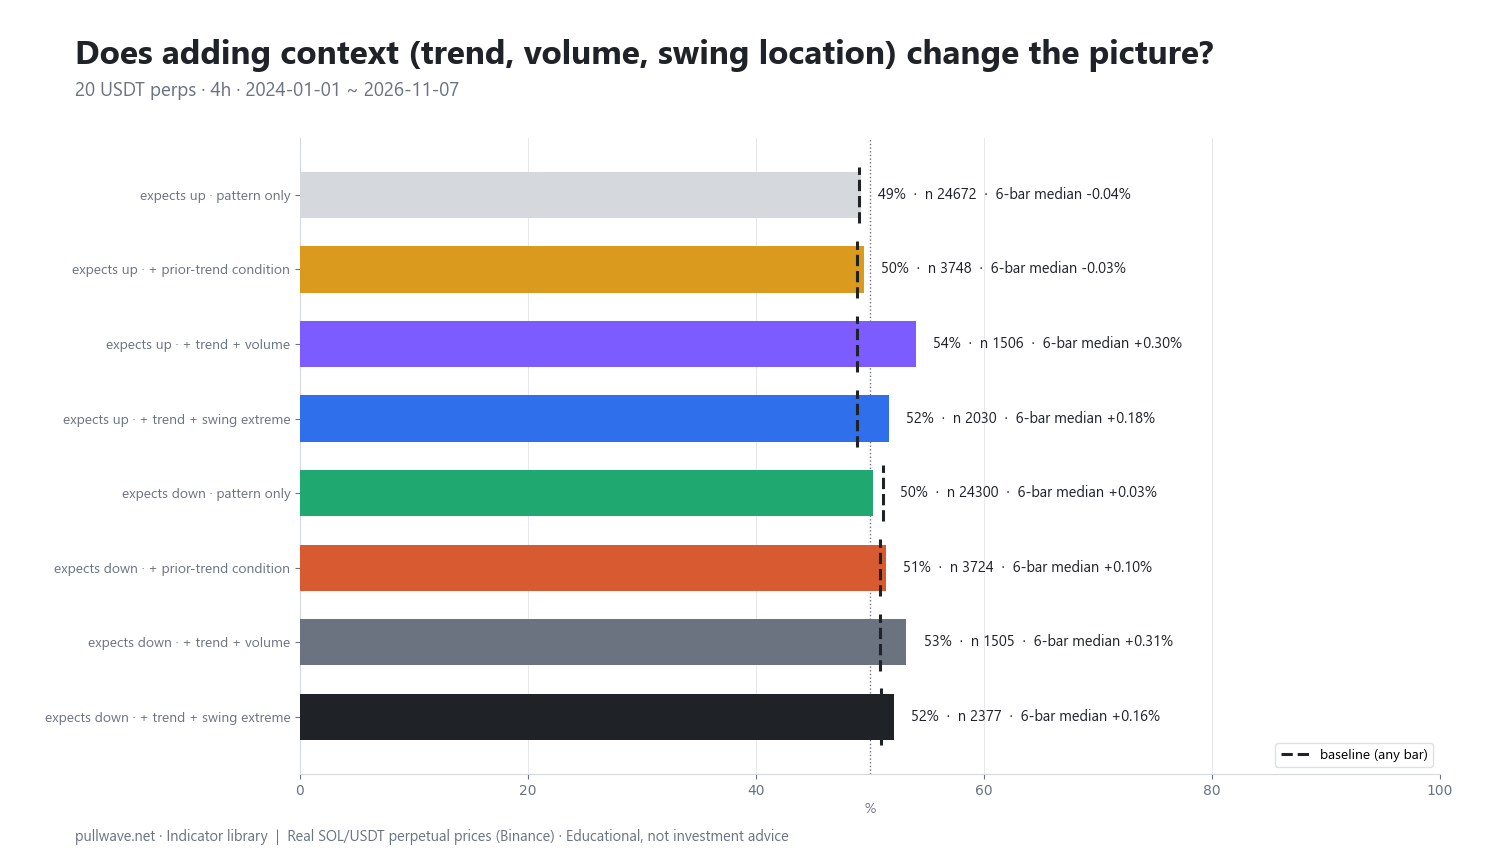
Figure 2 shows, for up-expecting and down-expecting patterns separately, the share that closed in the expected direction 6 bars later under each variant, against the dashed baseline for a randomly chosen bar.
Up-expecting patterns (bullish reversals)
| Variant | n | Expected direction, 6 bars | Baseline | Median 6-bar move | 12 bars |
|---|---|---|---|---|---|
| Pattern only | 24,672 | 49.2% | 49.0% | −0.04% | 48.1% |
| + prior trend | 3,748 | 49.5% | 48.9% | −0.03% | 48.9% |
| + trend + volume | 1,506 | 54.0% | 48.9% | +0.30% | 51.4% |
| + trend + swing extreme | 2,030 | 51.7% | 48.9% | +0.18% | 49.7% |
Down-expecting patterns (bearish reversals)
| Variant | n | Expected direction, 6 bars | Baseline | Median 6-bar move | 12 bars |
|---|---|---|---|---|---|
| Pattern only | 24,300 | 50.3% | 51.1% | +0.03% | 51.9% |
| + prior trend | 3,724 | 51.4% | 50.9% | +0.10% | 52.2% |
| + trend + volume | 1,505 | 53.2% | 50.9% | +0.31% | 52.8% |
| + trend + swing extreme | 2,377 | 52.1% | 51.0% | +0.16% | 52.2% |
Read it filter by filter. Raw patterns are a non-event: 49.2% for bullish shapes against a 49.0% baseline, 50.3% for bearish shapes against a 51.1% baseline — bearish patterns actually underperformed a coin flip taken on a random bar in a window where random bars drifted slightly down. The prior-trend condition alone cuts the sample by about 85% (24,672 → 3,748 and 24,300 → 3,724) and barely moves the numbers: 49.5% and 51.4%, with median moves of −0.03% and +0.10%.
Adding the volume condition is the only step that produces a visible gap: 54.0% versus a 48.9% baseline for up-expecting patterns (+5.1 points, n=1,506) and 53.2% versus 50.9% for down-expecting ones (+2.3 points, n=1,505). The swing-extreme condition lands in between at 51.7% and 52.1%. Median moves rise to +0.30% and +0.31% — real, but a small fraction of a typical 4h ATR, and before any fees, slippage or funding.
Now the caveats, which matter more than the table. With n ≈ 1,500 the standard error of a proportion is about 1.3 points, so +5.1 looks large — except the sample is not 1,500 independent experiments. Events overlap (the same bars appear in several patterns), the 20 assets are highly correlated so a single market-wide liquidation generates a dozen "independent" cases at once, and the 12-bar column has no baseline reported here, so it can only be compared with itself. If the effective independent sample is a few hundred episodes, the tilt sits close to the noise band. The thresholds are also one arbitrary definition: change 1.5 to 2.0, or 1.2 to 1.5, and the numbers move.
The SOL chart in Figure 1 makes the same point at human scale. Over 1,200 4h bars from 23 April 2026 to 9 November 2026 — ending at a last close of 87.44 — 26 patterns met both the trend and swing-extreme conditions, and 15 of them (15/26) closed in the pattern's direction after the fixed horizon. Ten of those events:
- 2026-09-06 12:00 — tweezer top at 105.70 → −2.35% after 6 bars, −1.37% after 12 (its way)
- 2026-09-18 20:00 — bearish harami at 112.73 → −1.50% / −1.45% (its way)
- 2026-09-18 20:00 — tweezer top at 112.73 → −1.50% / −1.45% (the same bar, counted twice)
- 2026-10-08 16:00 — bullish harami at 109.08 → −0.58% / +1.23%
- 2026-10-08 16:00 — bullish pin bar at 109.08 → −0.58% / +1.23% (again the same bar)
- 2026-10-12 08:00 — bearish engulfing at 110.96 → −4.35% / −3.47% (its way)
- 2026-10-21 20:00 — evening star at 106.90 → −3.07% / −3.84% (its way)
- 2026-10-22 20:00 — tweezer bottom at 103.62 → −0.80% / −1.24% (against it)
- 2026-10-24 16:00 — bullish harami at 101.11 → +0.64% / −0.67% (its way at 6 bars, not at 12)
- 2026-10-30 00:00 — bullish harami at 97.19 → −1.06% / −1.68% (against it)
Two things stand out. The duplicate timestamps show how overlap inflates sample counts — one 4h candle produced two "signals" twice in this short list. And the bearish patterns in a falling market mostly resolved their way while the bullish ones into the same decline mostly did not: the September–October slide from 112.73 to 87.44 swamped the shapes. That is a regime effect, not a pattern effect, and it is exactly why one chart proves nothing in either direction.
Common mistakes
- Hindsight selection. On a printed chart, every reversal has a pattern at the turn. What you cannot see are the identical patterns at the dozens of places price kept going. Only a complete log, including failures, answers the question.
- Trading every occurrence. Raw patterns fire constantly. Without context, a 4h crypto chart gives you something to react to almost daily, which is a route to churn rather than information.
- Ignoring timeframe and market. A result on 4h perps says nothing about 5-minute charts or spot altcoins with thin books. Pattern statistics are not portable.
- Confusing volume with buying or selling. Relative volume ≥ 1.2 means the bar was busier than its own recent average. Nothing in OHLCV data tells you whether buyers or sellers were in control.
- Double counting. Tweezers, haramis and pin bars frequently flag the same candle. Treating them as separate confirmations is just counting one event three times.
- Forgetting costs and funding. A +0.30% median move does not survive casual execution. Taker fees both ways, spread, slippage on a fast bar and funding payments on a perp all come out of that number first.
- Moving the thresholds after seeing results. Adjusting the ATR multiple or volume cutoff until the table looks good is curve fitting, not research.
- Over-leveraging a "confirmed" signal. A few percentage points above baseline — if real — cannot carry size that liquidates on a one-ATR wick. Crypto wicks routinely exceed what the pattern's own range suggests.
Combining it with other tools
Context filters are themselves a combination, so think in layers rather than adding more shapes. A trend filter such as a 20- or 50-EMA on the higher timeframe tells you whether a reversal pattern is with or against the larger flow; many traders only consider bullish patterns when the higher timeframe is not in a clean decline, and vice versa.
ATR does double duty: it sets the prior-move threshold and it sizes invalidation distance, so a stop sits outside normal 4h noise rather than inside it. Horizontal structure — prior swing highs and lows, visible high-volume prices — answers the location question more precisely than a 20-bar extreme, which is only a crude proxy for "the edge of the range".
Momentum tools add a different kind of evidence. An RSI reading at an extreme, or a divergence against the pattern's own high or low, is information from a separate construction rather than another candle shape. On perpetuals, funding rates and open interest can flag the crowded positioning that makes liquidation-driven wicks possible in the first place.
Finally, this page is the capstone of a series. If you want the mechanical definitions behind each family, the dedicated pages on engulfing bars, harami and inside bars, morning and evening stars, three white soldiers and three black crows, tweezers, marubozu and pin bars go deeper, and the pages on reading a single candle, the doji and the hammer/shooting star cover the single-bar vocabulary the multi-bar shapes are built from.
Frequently asked questions
Q. Do candlestick patterns work in crypto?
In the pooled test described above — 124,920 four-hour candles across 20 USDT perpetuals from January 2024 to November 2026 — raw reversal patterns resolved in their expected direction 49.2% (bullish) and 50.3% (bearish) of the time after 6 bars, against baselines of 49.0% and 51.1% for a randomly chosen bar. That is indistinguishable from nothing before costs. Academic work on equities and futures has generally reached similar conclusions.
Q. Does adding volume confirmation improve candlestick patterns?
In this test it produced the largest change: combining the prior-trend condition with a last-candle relative volume of at least 1.2 gave 54.0% for up-expecting patterns (n=1,506) and 53.2% for down-expecting ones (n=1,505), versus baselines of 48.9% and 50.9%. Median moves rose to +0.30% and +0.31% over 6 bars. Because events overlap and the 20 assets are correlated, the effective sample is smaller than n suggests, so treat this as a hypothesis to test rather than a proven edge.
Q. What relative volume threshold should I use for candlestick confirmation?
The test here used volume divided by its own 20-bar average with a threshold of 1.2, meaning simply "20% busier than usual". Higher thresholds such as 1.5 or 2.0 select rarer, more dramatic bars but shrink the sample quickly, and results that only appear at one specific cutoff are usually noise. Whatever you choose, fix it before you measure.
Q. What is the best timeframe for candlestick patterns in crypto?
There is no universal answer, but higher timeframes give fewer, cleaner occurrences and a better ratio of signal to microstructure noise. The 4h chart was used here because it yields enough events for meaningful sample sizes while staying slow enough that a single exchange hiccup does not create a pattern. Results do not transfer between timeframes, so test the one you actually trade.
Q. Why do candlestick patterns look so reliable on historical charts?
Because you find them by looking at the turns. Scanning a finished chart, your eye lands on the reversals and finds a shape there, while the same shapes that preceded continuations are invisible. Mechanical detection plus a fixed outcome horizon removes that bias, which is why detected hit rates land near 50% while eyeballed ones feel far higher.
Q. How should I test a candlestick pattern myself?
Write the detection rules and thresholds down first, then log every occurrence on your market and timeframe for at least a month — including the ones you would have skipped. Record the context flags that passed, the outcome at a fixed number of bars, and realistic costs including fees, slippage and perpetual funding. Compare the result with the baseline rate for a random bar over the same window, not with the examples you remember.
Key takeaways
- Context is three mechanical checks on a classic pattern: a prior counter-move of at least 1.5 × ATR over 6 bars, last-candle relative volume of at least 1.2, and formation at a 20-bar swing extreme.
- In the pooled 4h test, raw patterns matched the baseline almost exactly; the prior-trend filter alone cut the sample by roughly 85% without changing the hit rate materially.
- Trend plus volume produced the only visible tilt — 54.0% (up-expecting) and 53.2% (down-expecting) against 48.9% and 50.9% baselines, with median 6-bar moves of +0.30% and +0.31%.
- Overlapping events, correlated assets, excluded fees, slippage and funding, and arbitrary thresholds mean a few percentage points above baseline is a research lead, not an edge.
- The most defensible uses of candles are vocabulary, structure and invalidation levels — and a disciplined log that judges them against a baseline rather than against memorable charts.
Educational material. Charts use real SOL/USDT perpetual prices; past behaviour does not predict future results. Not investment advice.