Indicator & technique library · Candlestick patterns deep dive
Three White Soldiers and Three Black Crows Explained
At a glance
- Three white soldiers is three strong bullish candles in a row, each closing higher, each opening inside the previous body, with short wicks on the side of the move; three black crows is the mirror.
- The pattern can be read two ways: the start of a reversal after a decline, or an over-extended push that is close to exhausting itself.
- In a pooled test on 20 USDT perpetuals over 124,920 4h candles, the raw pattern finished in its expected direction 46.1% of the time after 6 bars against a 49.7% baseline — below chance.
- Adding a prior-trend condition and above-average volume lifted the 6-bar share to 60.0%, but on only 20 overlapping cases — a hypothesis to test, not an edge.
Three white soldiers and three black crows are among the most visually dramatic candlestick formations: three big candles of the same colour marching in a straight line, each one closing beyond the last. They look like conviction made visible, which is exactly why traders remember them and why they are over-interpreted.
This page defines both patterns precisely, shows the arithmetic used to detect them, and then does something most pattern guides skip: it reports what happened after 269 occurrences across 20 liquid crypto perpetuals and 124,920 four-hour candles. The raw result was worse than a coin flip. One context-filtered variant looked better on a very small sample. Both facts matter, and neither is proof of anything.
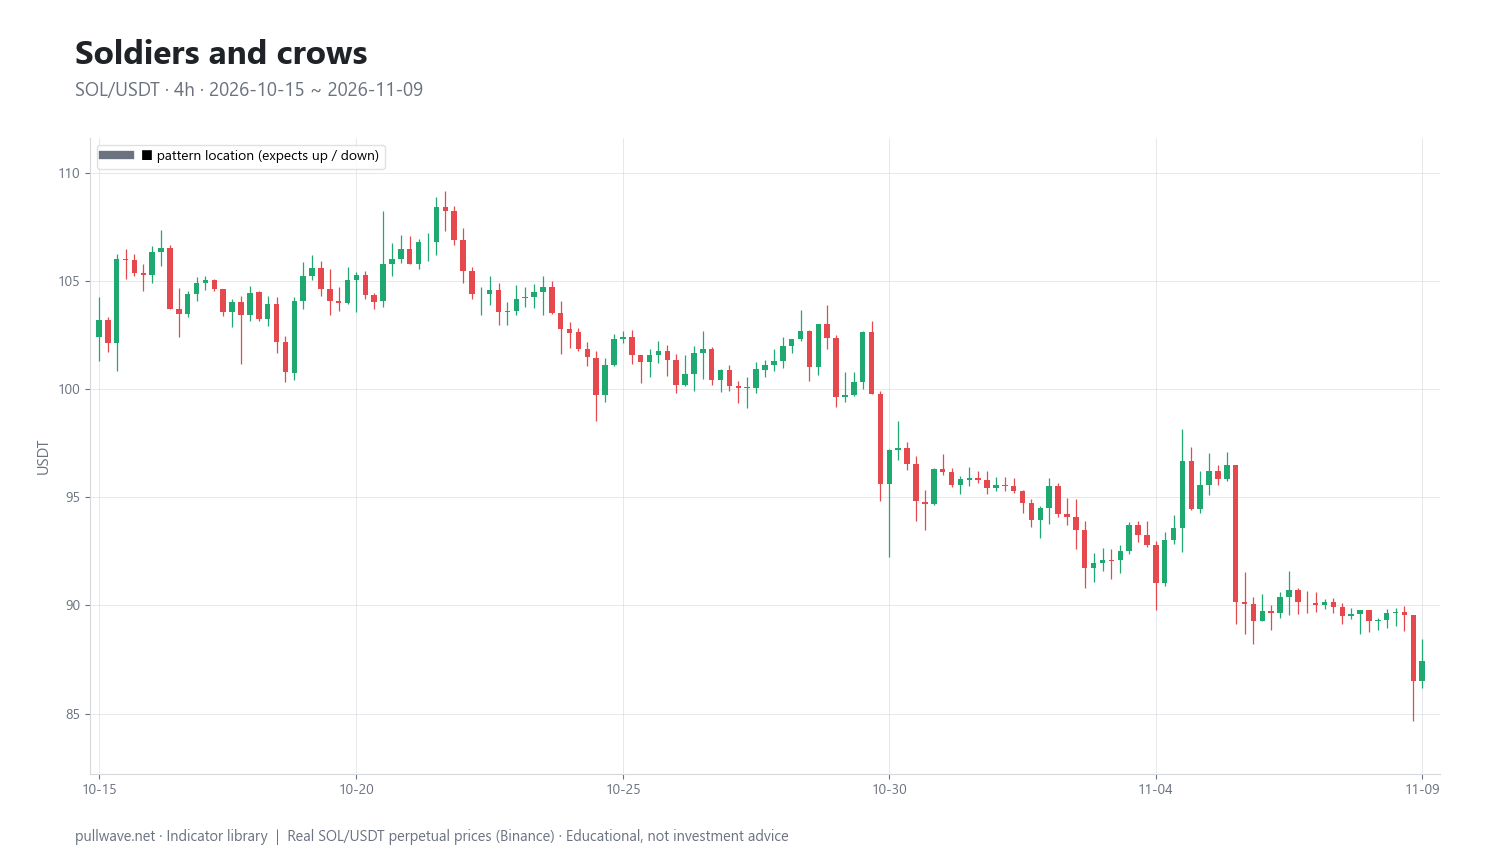
Figure 1 shows SOL/USDT perpetual 4h candles between 23 April 2026 and 9 November 2026 — 1,200 bars — with the qualifying sequences outlined and labelled. Only one met the full definition in that whole window. That scarcity is the first thing to understand about this pattern.
What is Three White Soldiers and Three Black Crows?
Three white soldiers is a bullish three-candle sequence. Each of the three candles closes above its open (white, or green on most charts), each close is higher than the previous close, each candle opens somewhere inside the body of the candle before it, each body is large relative to recent volatility, and the upper wicks are short — price closes near the high of each bar.
Three black crows is the exact mirror: three consecutive candles closing below their opens, each close lower than the last, each opening inside the previous body, each with a substantial body and a short lower wick.
The narrative attached to them is simple. In three white soldiers, every session opens with some giving-back of the prior advance, buyers absorb that pullback, and the bar closes at or near its high. Repeat three times and you have a market where sellers get no traction. Three black crows says the same about sellers. The short wick on the side of the move is the detail that separates this from "three up bars in a row": a long upper wick on a white soldier means the close was rejected, which contradicts the whole story.
This lesson sits in a wider candlestick series alongside engulfing patterns, harami and inside bars, morning and evening stars, tweezers, marubozu, pin bars, the doji, and the hammer and shooting star. Three white soldiers can be thought of as a sequence of three near-marubozu candles pointing the same way.
The idea behind it (theory and history)
Candlestick charting came to Western traders largely through Steve Nison's 1991 book Japanese Candlestick Charting Techniques, which translated and systematised terminology that Japanese chartists had been using for decades. The three-soldier and three-crow formations appear there among the multi-candle continuation and reversal patterns, usually rendered from Japanese terms meaning roughly "three advancing soldiers" and "three crows".
You will often read that candlesticks were invented by Munehisa Homma, an 18th-century rice trader. Homma was a real and successful merchant, but the direct line from him to the modern candlestick pattern vocabulary is poorly documented, and the colourful details of that story are better treated as folklore than as history. The analytical value of the pattern does not depend on who first drew it.
The theoretical argument is about where supply and demand meet within each session. A chart that only shows closes tells you the net result; candles tell you where the fight happened. Three consecutive sessions in which the open concedes ground and the close takes it back plus more is, in theory, evidence of a persistent imbalance rather than a single burst of news flow.
That said, there is an honest counter-argument built into the same tradition. Classical candlestick literature treats a long run of same-colour candles with suspicion when it appears after an extended move: it can mark exhaustion rather than strength. Nison describes two warning variants — the advance block, where successive soldiers have shrinking bodies and lengthening upper wicks, and the stalled or deliberation pattern, where the third candle is small and barely extends the move. Both say the march is losing momentum. So the same three candles support opposite readings depending on what came before them, which is the central difficulty of the pattern and the reason context filters matter so much below.
Finally, the evidence base. Academic work on candlestick patterns in equities and futures has generally found weak predictive power, especially after transaction costs. The best-known study is Marshall, Young and Rose (2006) in the Journal of Banking & Finance, which tested candlestick strategies on Dow Jones stocks and found no value for investors; later work on intraday futures data reached broadly similar conclusions. Crypto is a different market with different microstructure, so those results do not transfer automatically — but they do set the prior you should start from.
How it is calculated
There is no single official definition. Any detector has to make thresholds explicit, and different thresholds produce different patterns. These are the rules used for the statistics on this page:
- Measure a 14-period Wilder ATR on the bar before the first candle of the pattern. This is the volatility yardstick, fixed before the pattern starts so it is not contaminated by the pattern's own candles.
- Candles 1, 2 and 3 must all be the same colour.
- Each close must be beyond the previous close (higher for soldiers, lower for crows).
- Candles 2 and 3 must open inside the previous candle's body — above the previous open and below the previous close for soldiers, with a small tolerance.
- Each body must be at least 0.5 × ATR. This filters out three tiny candles that happen to line up.
- The wick on the side of the move must be no more than 30% of the body: the upper wick for white soldiers, the lower wick for black crows.
``` ATR = Wilder ATR(14), measured on the bar before candle 1 body[i] = |close[i] - open[i]|
THREE WHITE SOLDIERS (i = 1,2,3) close[i] > open[i] close[3] > close[2] > close[1] body[i] >= 0.5 * ATR min(open[i-1], close[i-1]) <= open[i] <= max(open[i-1], close[i-1]) for i = 2,3 (high[i] - close[i]) <= 0.30 * body[i]
THREE BLACK CROWS (mirror) close[i] < open[i] close[3] < close[2] < close[1] body[i] >= 0.5 * ATR open[i] inside the previous body for i = 2,3 (close[i] - low[i]) <= 0.30 * body[i] ```
The context conditions layered on top are also arithmetic, not judgement:
TREND   : the 6 bars before candle 1 moved AGAINST the pattern's expected
          direction by at least 1.5 * ATR
          (so: a decline of >= 1.5 ATR before three white soldiers)
VOLUME  : volume of candle 3 / its own 20-bar average volume >= 1.2
SWING   : the pattern made the lowest low (soldiers) or highest high (crows)
          of the previous 20 bars
Note what "volume" means here. It is the exchange's aggregate OHLCV volume for that market — total contracts or coins traded, not a split between buyers and sellers. Every trade has both. Relative volume of 1.2 says only one thing: this bar was 20% busier than the recent norm.
Default settings and variations
| Parameter | Value used here | Why, and what changing it does |
|---|---|---|
| Number of candles | 3 | The tradition. Two is just a trend; four or more is rarer still and usually late. |
| Minimum body | 0.5 × ATR(14) | Scales to the asset's own volatility. Raise it to 0.8 and you get far fewer, more extreme sequences. |
| Wick on the move side | ≤ 30% of body | Enforces "closes near the extreme". Loosen to 50% and the advance block starts slipping through. |
| Open location | Inside the previous body | The classic requirement. Dropping it turns the pattern into any three same-colour bars. |
| ATR reference bar | Bar before candle 1 | Keeps the yardstick independent of the pattern itself. |
| Timeframe | 4h | Long enough to reduce noise, short enough to give a usable sample. |
Common variations you will meet elsewhere:
- Gap-based open conditions, such as "each candle must open above the previous close". These were written for markets with a daily session break. In continuous crypto trading there is no overnight gap: each bar opens at, or within a tick of, the previous close, so gap conditions lose their meaning — a strict gap-up requirement would reject almost every sequence, while a strict gap-down requirement would reject almost every crow. The practical consequence runs the other way for the classic rule: "open inside the previous body" is satisfied almost automatically, which is why the detector needs a small tolerance around the body boundary rather than a hard gap test.
- Equal or increasing bodies, to exclude the advance block. Stricter, rarer, arguably more faithful to the original intent.
- Volume rising across the three candles, a popular addition with no settled evidence behind it.
- No ATR requirement, just "long" candles judged by eye. This is how most people use it, and it is the hardest version to test because "long" is undefined.
- Different wick tolerances, for example allowing a 50% wick on the third candle only. Every loosening increases the count and dilutes the character of the pattern.
Every one of these choices moves the statistics. Treat the numbers below as results for this definition, not for the pattern in the abstract.
How to read it
Start with what happened before the three candles. The same formation means different things in different places.
- After a clear decline, three white soldiers is read as a potential bottoming sequence: sellers who controlled the last few sessions no longer close the bars in their favour.
- After an extended advance, the same three candles are read as a possible blow-off: buyers who already had control are now paying up, and the move may be entering its late stage.
- Inside a range, the pattern is mostly noise. Three decent bodies can carry price from one side of a range to the other and then stop, because the range boundary — not the candle pattern — is what mattered.
Then look at the internal shape. Bodies of similar size with consistently short wicks on the move side is the textbook version. Shrinking bodies and growing upper wicks is the advance block, and the message flips from strength toward hesitation. A third candle that is dramatically larger than the first two often means the move is being chased.
Finally, note where the pattern finishes. Three white soldiers that end just underneath an obvious prior high or a well-watched level has used up most of its room. The pattern itself contains no target; levels, range boundaries and moving averages do.
In Figure 1, the striking feature is how little there is to see. Across 1,200 SOL 4h candles — more than six months of continuous trading — exactly one sequence passed all the conditions: one bullish, no bearish. Most multi-candle patterns are rare under strict rules, and this one is rarer than most, because requiring three consecutive large bodies with short wicks on the same side is a demanding filter.
How traders use it
1. As vocabulary for describing price action. The most defensible use. "Three large-bodied closes near the highs after a 1.5 ATR decline" is a compact description of a change in who is controlling the closes. It is a label for a condition, not a signal in itself. It works in all regimes because it claims nothing; it fails only if you forget that naming something is not predicting it.
2. As a late confirmation of a turn that began earlier. Some traders use the completion of three soldiers after a decline as evidence that a base identified by other means — a support zone, a divergence, a volume cluster — is being accepted. When this works, it is in markets that trend persistently once they turn, and crypto 4h charts sometimes do. When it fails, it fails because the pattern completes only at the end of three large bars: you are acknowledging the move after most of its first leg is already printed, which is especially punishing in a range.
3. As a caution flag on an extended move. The exhaustion reading. Three black crows arriving after an already-long slide, or three soldiers at the top of a multi-week advance, can be read as a prompt to review exposure, tighten risk parameters, or stop adding. When it works, it is because liquidation cascades and funding-driven squeezes in perpetual markets do produce three violent same-colour bars near the end of a move. When it fails, it is because strong trends print these sequences repeatedly on the way, and treating each as exhaustion means fighting a trend over and over.
4. As a reference for stop placement and structure. The low of candle 1 in a soldier sequence (or the high of candle 1 in a crow sequence) is a concrete, mechanically defined level that the market has not revisited during the pattern. That makes it usable as a structural reference for risk — independent of whether the pattern predicts anything. The weakness is distance: with each body at least 0.5 ATR, the full sequence spans at least about 1.5 ATR, so that level can sit a long way from the completion price and the implied risk per unit is large.
Notice that none of these uses is "the pattern appears, therefore price goes up". Given the statistics below, that framing is not supported.
Example on a real SOL chart
The chart window is SOL/USDT perpetual on Binance, 4h candles, 23 April 2026 to 9 November 2026 — 1,200 bars, with a last close of 87.44. The detector found one qualifying pattern in that entire window: one three white soldiers, no three black crows.
That single event completed on 19 August 2026 at 16:00 UTC, with the third candle closing at 82.34. Six bars later (one day on a 4h chart) price was +6.02% above that close; twelve bars later it was +10.47% higher. In the scorekeeping used here, 1 of 1 events moved in the pattern's expected direction.
It would be easy to present that as a success story. It is not evidence of anything. One occurrence on one market tells you nothing about expectancy — a single coin flip is not a measurement of the coin. What the event does illustrate is the mechanics: a sequence of three large bodies closing near their highs, after a decline, that happened to be followed by continuation.
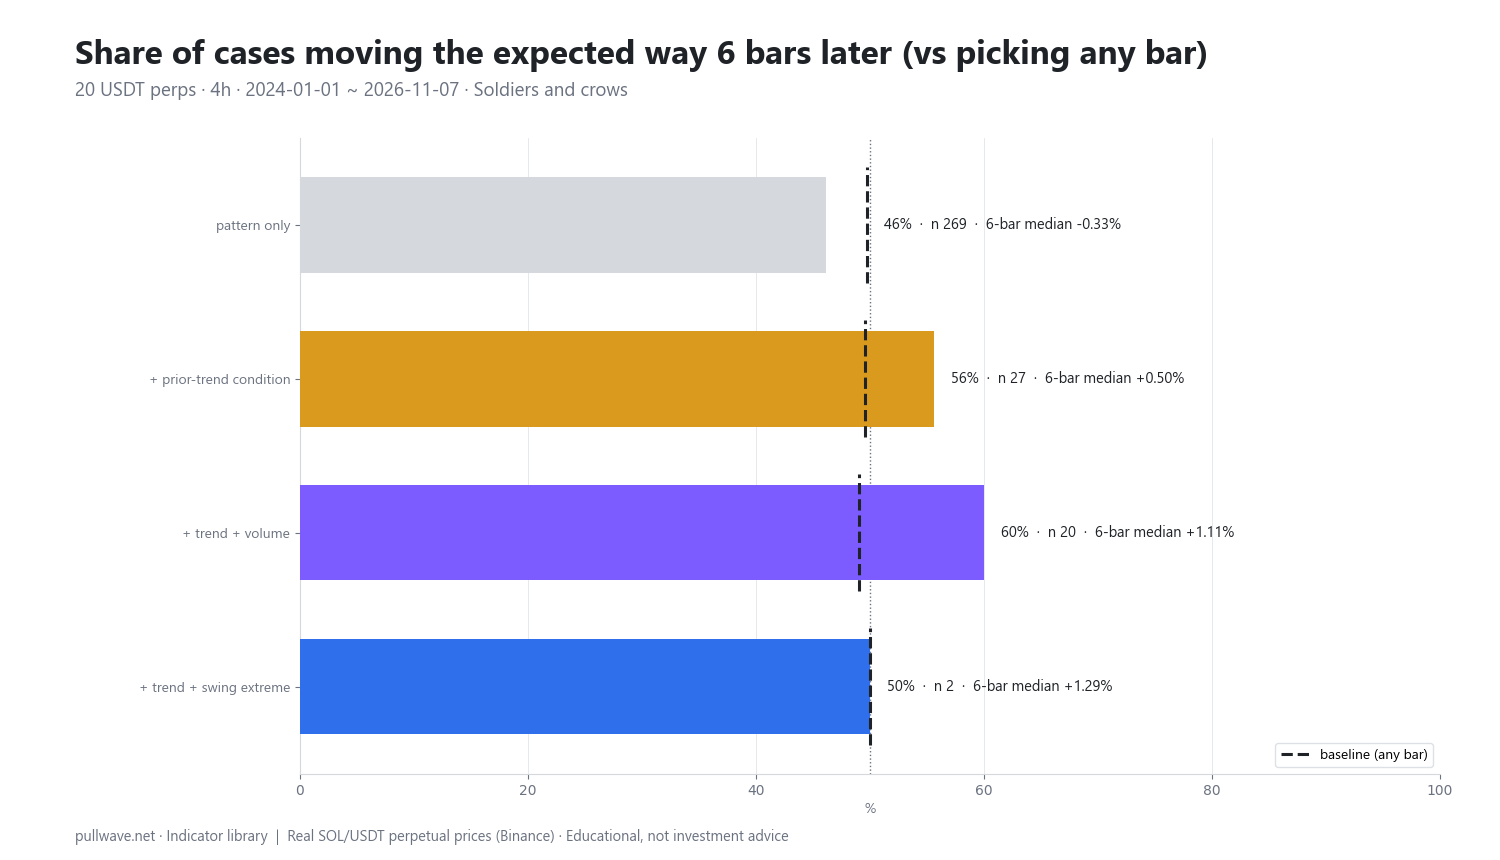
Figure 2 compares the pattern-only result with each context variant against the baseline, showing the sample size and the median move for each. To say anything about frequency, the same detector was run over a pooled sample: 20 liquid USDT-margined perpetuals (BTC, ETH, SOL, BNB, XRP, DOGE, ADA, AVAX, LINK, DOT, LTC, TRX, ATOM, NEAR, APT, ARB, OP, SUI, INJ, FIL), 4h candles, 1 January 2024 to 7 November 2026 — 124,920 candles. It found 269 occurrences: 176 three-white-soldier sequences and 93 three-black-crow sequences. That is roughly one every 460 bars per market.
For every occurrence, the close 6 bars and 12 bars after the pattern's last candle was compared with that candle's close. "Expected direction" is the direction the pattern claims — up for soldiers, down for crows. The baseline is the same share when any bar in the window is picked, weighted to match the mix of up- and down-expecting cases. It sits near 50%, as it should.
| Variant | n | 6-bar in expected dir. | baseline | median 6-bar | 12-bar | baseline | median 12-bar |
|---|---|---|---|---|---|---|---|
| Pattern only | 269 | 46.1% | 49.7% | −0.33% | 46.8% | 49.7% | −0.21% |
| + prior trend | 27 | 55.6% | 49.6% | +0.50% | 51.9% | 49.8% | +0.60% |
| + prior trend + volume | 20 | 60.0% | 49.0% | +1.11% | 55.0% | 49.2% | +1.10% |
| + prior trend + swing extreme | 2 | 50.0% | 50.0% | +1.29% | 50.0% | 50.2% | +0.68% |
Read the top row first, because it is the only one with a usable sample. Taken on its own, with no context, the pattern finished in its claimed direction less often than a randomly chosen bar — 46.1% versus 49.7% after 6 bars, and 46.8% versus 49.7% after 12 — with a slightly negative direction-adjusted median move both times. On this definition, this timeframe and this sample, the bare pattern behaved as a mild contrarian marker rather than a confirmation of continuation. That is consistent with the exhaustion reading, and it is a useful corrective to the "three soldiers means strength" shorthand.
Now the context rows, carefully. Requiring that the six bars before the pattern moved against its expected direction by at least 1.5 ATR cut 269 cases down to 27 and lifted the 6-bar share to 55.6%. Adding the volume condition (relative volume of the last candle ≥ 1.2) left 20 cases at 60.0% with a median move of +1.11%. The swing-extreme variant left just 2 cases, which is a number you should not interpret at all.
Why you should not get excited about the 60%:
- n = 20. The difference between 60% and 50% at that sample size is two or three cases. Random variation produces swings that large routinely.
- Overlapping events are not de-duplicated. Nearby occurrences share outcome windows, so the effective independent sample is smaller than the count suggests.
- Crypto assets are highly correlated. When BTC moves, most of the 20 symbols move together, so several "separate" cases can really be one market event.
- No costs. Fees, slippage and perpetual funding are not deducted. A median 6-bar move of +1.11% is not large relative to round-trip costs plus adverse fills on a busy bar.
- The thresholds are arbitrary. Change 0.5 ATR to 0.6, or the wick limit from 30% to 25%, and both the sample and the percentages move.
- One timeframe, one asset class, one period. Results differ by timeframe and market, and 2024–2026 crypto is a specific regime.
The honest summary: the raw pattern underperformed the baseline, and the filtered version looked better on a sample too small to support a conclusion. That is a hypothesis you could test on your own data — not an edge.
Common mistakes
Hindsight scanning. Three white soldiers are glaringly obvious on a printed chart, and your eye finds them at the bottoms, not at the tops where they failed. This is the single biggest source of false confidence in candlestick work. The only cure is to log occurrences forward, in real time or with a mechanical detector, and keep the losers in the sample.
Calling any three up-bars a soldier pattern. Without the body and wick conditions, you are just labelling a three-bar advance. The strict definition found 269 cases in 124,920 candles; a loose one would find thousands, and the pattern would mean nothing.
Ignoring what came before. The same three candles are a reversal start or an exhaustion warning depending entirely on prior context. The data on this page reflects that: with no prior-trend condition the pattern was below baseline; with it, the small filtered group tilted the other way.
Missing the advance block. Shrinking bodies and lengthening upper wicks across the three candles is the classical warning sign, and most casual detectors do not check for it. If candle 3 is smaller than candle 1 and closes well off its high, the "march" is already stumbling.
Trading every occurrence. 269 events spread across 20 markets in nearly three years is about 13 per symbol — roughly one every two to three months on a given 4h chart, or one every 460 bars. A pattern that rare cannot carry a trading programme by itself, and forcing it to means loosening the rules until it stops being the pattern.
Mixing timeframes carelessly. A three-soldier sequence on a 5-minute chart and one on a daily chart are different phenomena. Lower timeframes produce far more occurrences and far more noise; in 24/7 crypto, low-timeframe sequences frequently reflect a single liquidation cascade rather than any persistent imbalance.
Over-reading volume. Aggregate volume does not tell you who was buying. A 1.2× relative volume bar was busier than usual — it may have been busy with forced liquidations in either direction.
A checklist you can apply bar by bar
| Check | What to look for |
|---|---|
| Three same-colour candles | Each close beyond the previous close |
| Body size | Each body ≥ 0.5 × ATR(14) measured before candle 1 |
| Opens | Candles 2 and 3 open inside the previous body (with tolerance) |
| Wicks | Wick on the move side ≤ 30% of the body |
| Prior move | Did the last 6 bars move against the pattern by ≥ 1.5 ATR? |
| Shape | Bodies steady or growing, or shrinking (advance block)? |
| Location | Mid-range, at a prior high/low, or at a 20-bar extreme? |
| Relative volume | Candle 3 volume ÷ its 20-bar average |
| Room | How far to the next obvious level? |
For a beginner, the most valuable exercise is not finding the next one but building your own record. Scroll back through six months of a chart you follow, mark every sequence that passes the checklist, note the date, the context flags and the close 6 and 12 bars later, and tally the results. Thirty logged observations on your own market and timeframe will teach you more than any list of pattern definitions — including, quite possibly, that the pattern does not do what you were told.
Combining it with other tools
The pattern is a description of three bars. It carries no information about location, trend, or volatility regime, so anything you pair it with should supply that.
- Trend context. A 20- or 50-period EMA, or a simple swing-structure read, tells you whether a soldier sequence is starting from a depressed level or arriving late in an advance. The prior-trend condition used in the statistics above is just a mechanical version of this question.
- Support and resistance. Where the sequence finishes matters more than the sequence. Three soldiers completing into an untested area has room; three completing into a heavily traded prior high does not.
- Volatility measures. ATR already appears in the definition, but it also tells you whether the three bodies are large in absolute terms or whether the whole market has gone quiet. A move that is 0.5 ATR in a compressed regime can be trivial in price terms.
- Volume and open interest. Relative volume says a bar was busy. In perpetual markets, pairing it with open interest and funding gives a richer picture: a sharp sequence accompanied by falling open interest looks more like position closure than new commitment.
- Other candle patterns. Three soldiers often contains near-marubozu candles; what follows it is frequently a doji, an inside bar or a harami, and those sibling patterns describe how the march is losing or keeping momentum. Pin bars, tweezers and engulfing bars at the end of a soldier sequence are the classical signs that it is being rejected.
- Higher-timeframe alignment. A 4h sequence that resolves a question also visible on the daily chart is a different situation from one that is invisible one timeframe up.
Crypto-specific points worth keeping in mind: markets trade continuously, so there are no overnight gaps and each bar opens at the previous close, which both removes gap-based pattern conditions and makes the "open inside the previous body" rule easy to satisfy. On perpetual futures, extended same-colour sequences often coincide with funding extremes and liquidation cascades, which can make three large bodies appear for reasons that have nothing to do with sustained directional demand. And with leverage, a pattern whose structural reference level sits at least about 1.5 ATR away — three bodies of 0.5 ATR or more — implies a position size far smaller than most traders assume when they size by habit rather than by distance.
Frequently asked questions
Q. What do three white soldiers mean?
Three white soldiers means three consecutive bullish candles, each closing higher than the last, each opening inside the previous candle's body, each with a substantial body and only a short upper wick. The conventional reading is that buyers are controlling the close in every session. Depending on where it appears, it is interpreted either as the start of a recovery after a decline or as a late, over-extended push.
Q. Is three black crows a reliable reversal signal?
Not on its own. In a pooled test of 269 occurrences across 20 crypto perpetuals on 4h candles, the pattern finished in its expected direction 46.1% of the time after 6 bars, against a 49.7% baseline — slightly worse than picking a random bar. Academic studies on equities and futures have also generally found weak results for candlestick patterns after costs. Treat it as a description of recent price action, not as a reliable signal.
Q. What is the best timeframe for three white soldiers in crypto?
There is no best timeframe, only trade-offs. Lower timeframes produce many more occurrences but far more noise, and in 24/7 crypto a low-timeframe sequence is often one liquidation cascade. Higher timeframes produce cleaner-looking patterns but so few of them that you can never gather a meaningful sample. The tests on this page use 4h as a compromise; your own logging should use the timeframe you actually trade.
Q. How rare is the three white soldiers pattern?
Under strict rules, very rare. Across 124,920 four-hour candles from 20 liquid perpetuals, only 269 sequences qualified — 176 bullish and 93 bearish, about one every 460 bars per market — and across 1,200 SOL 4h candles over roughly six and a half months, exactly one appeared. Loosening the body and wick thresholds would find many more, but they would be weaker examples of the pattern.
Q. What is the difference between three white soldiers and the advance block?
In three white soldiers the bodies are consistent or growing and the upper wicks stay short. In the advance block, the successive bodies shrink and the upper wicks lengthen, which classical candlestick literature reads as the advance losing momentum rather than confirming it. The two look similar at a glance, so checking body size and wick length across the three candles is worth doing deliberately.
Q. Does adding volume confirmation improve the pattern?
In the pooled test, requiring a prior counter-move of at least 1.5 ATR plus relative volume of 1.2 or more on the last candle raised the 6-bar share in the expected direction to 60.0% with a median move of +1.11% — but on only 20 overlapping cases, with no fees, slippage or funding deducted. That is too small and too fragile to call an edge. It is a hypothesis worth testing on your own data.
Key takeaways
- Three white soldiers and three black crows are strictly defined three-candle sequences: same colour, each close beyond the last, each open inside the previous body, bodies of at least 0.5 ATR, and wicks no longer than 30% of the body on the side of the move.
- The same formation supports two opposite readings — reversal after a decline, or exhaustion after an extended move — so the prior context is not optional background, it is part of the signal.
- In a pooled test of 269 occurrences over 124,920 crypto 4h candles, the unfiltered pattern resolved in its claimed direction 46.1% of the time after 6 bars against a 49.7% baseline, with a median move of −0.33%: below chance.
- Context filters improved the numbers (55.6% with a prior trend, 60.0% adding volume) but shrank the sample to 27 and 20 overlapping, correlated cases with no costs included — a hypothesis to test, not evidence of an edge.
- The pattern's durable value is as vocabulary and structure: a precise way to describe who is controlling the closes, and a mechanically defined level for risk, used alongside trend, location and volatility rather than in place of them.
Educational material. Charts use real SOL/USDT perpetual prices; past behaviour does not predict future results. Not investment advice.