Indicator & technique library · Candlestick patterns deep dive
Morning Star and Evening Star Candlesticks Explained
At a glance
- The morning star is a three-candle bullish reversal shape (long down bar, small pause bar, strong up bar) and the evening star is its bearish mirror image.
- Measured on 124,920 4h candles across 20 USDT perpetuals, 1,259 raw star patterns closed in the claimed direction 50.0% of the time after 6 bars against a 50.1% baseline.
- Adding a prior-trend condition plus above-average volume on the third candle left 123 cases with 62.6% after 6 bars and 65.0% after 12 bars — a small, overlapping sample, so a hypothesis rather than an edge.
- Crypto trades 24/7, so the classic gap requirement disappears and the pattern must be defined by body sizes and closing levels instead.
A morning star is a three-candle formation that shows up after a decline: a long down candle, then a small-bodied candle that stalls near the low, then a strong up candle that pushes back into the first candle's range. The evening star is the mirror image at the top of an advance: a long up candle, a small pause, then a decisive down candle. Both are classified as reversal patterns, which means they claim that control is changing hands.
Traders pay attention to them because, unlike single-bar shapes such as the doji or the hammer, a star encodes a complete three-act story: push, hesitation, rejection. That story is easy to read — and just as easy to over-read. This page gives the exact rules, where the pattern comes from, how it behaves when you measure it across a large sample of crypto perpetuals, and what it is honestly good for.
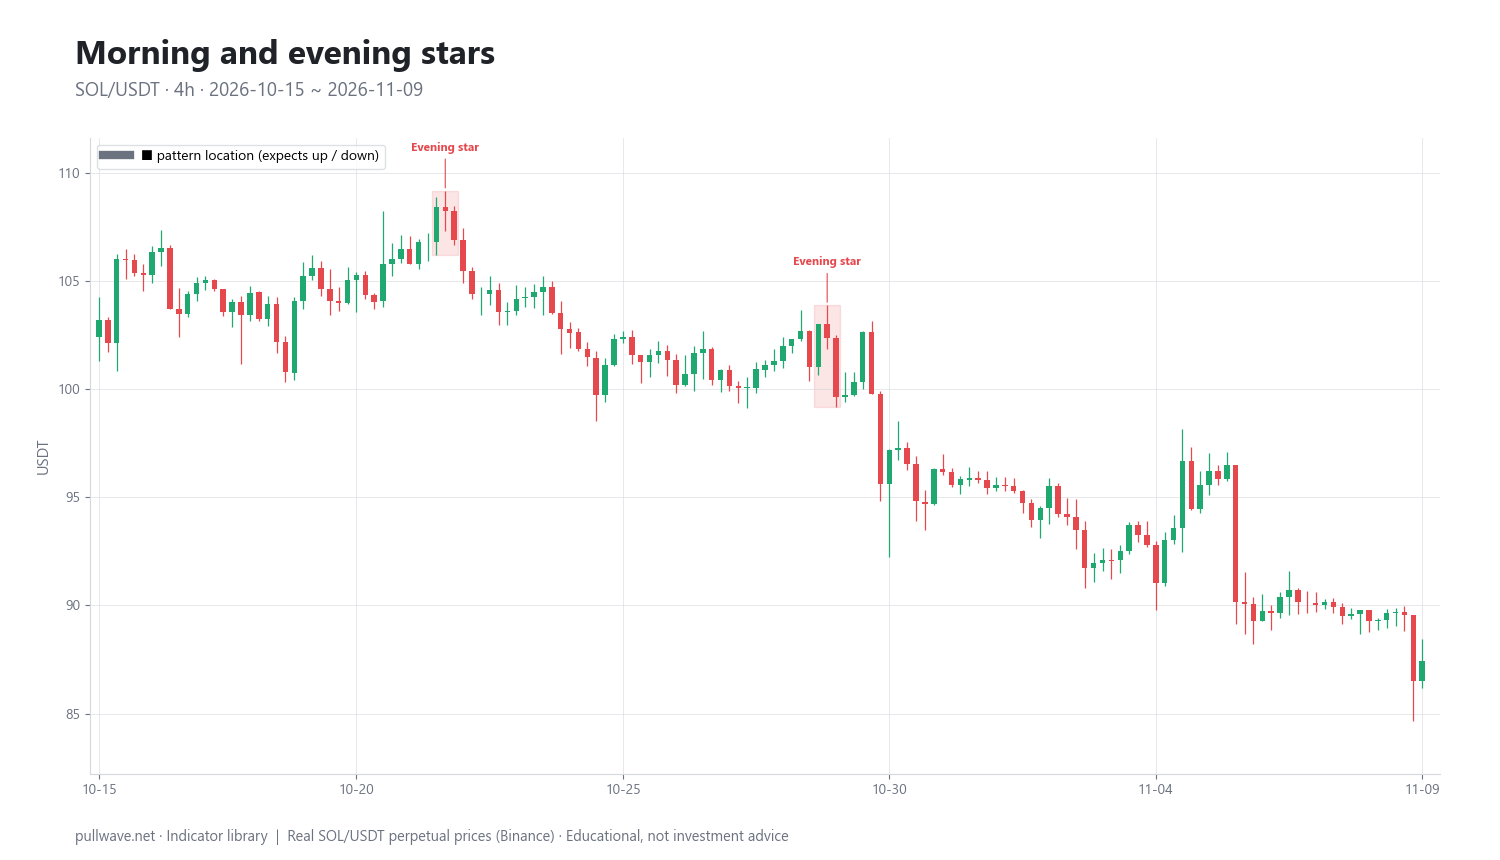
Figure 1 shows real SOL/USDT 4h candles with every detected morning star (bullish) and evening star (bearish) outlined and labelled. Notice two things immediately: the patterns are not rare, and they do not all mark turns. Some sit at genuine swing extremes, others appear in the middle of a range where there was no trend to reverse.
What are the morning star and the evening star?
Both patterns describe the same mechanic in opposite directions. One side of the market makes a strong, committed move (candle 1). The next bar fails to extend it and closes with a small body (candle 2, the "star"). Then the other side takes over and closes a large part of the first candle's move back (candle 3).
- Morning star (bullish): down candle → small body → up candle closing above the midpoint of the first body. It appears after weakness and claims the decline is exhausted.
- Evening star (bearish): up candle → small body → down candle closing below the midpoint of the first body. It appears after strength and claims the advance is exhausted.
The second candle's colour does not matter. What matters is that its body is small relative to the first — that is the hesitation. If the second candle is an actual doji (open and close essentially equal), the pattern is called a morning doji star or evening doji star, traditionally considered a slightly stronger version because the standstill is more complete.
Stars belong to the same family as the other patterns covered in this series: engulfing, harami and inside bars, three white soldiers and three black crows, tweezers, marubozu and pin bars. A star is effectively a slower, three-bar relative of the engulfing pattern, with a pause inserted between the push and the rejection.
The idea behind it (theory and history)
Candlestick charting comes from Japan, and the technique was popularised in the English-speaking world by Steve Nison with Japanese Candlestick Charting Techniques (1991). Nison's books are the reason the Western names — morning star, evening star, doji, harami — exist in their current form, and they remain the standard reference for the pattern definitions.
The frequently repeated story that an 18th-century rice trader named Munehisa Homma invented candlestick charting is popular but poorly documented, and the link between his writings and modern candlestick patterns is much weaker than the retelling suggests. It is safer to say that candlestick notation developed in Japanese commodity markets over a long period and reached the West through Nison's work in the early 1990s.
The names come from astronomy. In the traditional imagery relayed by Nison, the evening star is the planet Venus appearing just before darkness, and the morning star is Mercury appearing just before sunrise — a small light that precedes the change from one state to the other. The "star" is the small middle candle.
The logic behind the shape is about commitment and failure to follow through. A large body means one side closed the bar far from where it opened; participants accepted a sharply different price. A tiny body immediately afterwards means that acceptance stopped spreading — the same effort no longer produces movement. A large body in the opposite direction means the other side not only absorbed that effort but reversed a meaningful part of it. Expressed that way, the pattern is a compact description of momentum decay, not a prophecy.
It is worth knowing what the research literature says. Academic studies on equities and futures have generally found weak or no profitable predictive power from candlestick patterns once transaction costs are included. Marshall, Young and Rose (2006, Journal of Banking & Finance) tested candlestick strategies on Dow Jones stocks and found no value; Fock, Klein and Zwergel (2005) reached similar conclusions on intraday futures data. That does not make the vocabulary useless, but it does mean you should treat any single pattern as a description of recent behaviour rather than as a standalone signal.
How it is calculated
A star pattern is not an indicator with a formula that outputs a line; it is a rule set applied to three consecutive candles. Because "long body" and "small body" are meaningless without a yardstick, the definition used throughout this page measures bodies against the 14-period Wilder ATR taken from the bar before the pattern starts. ATR adapts to volatility, so the same rules work on a quiet range and on a violent trend day.
Step by step, for a morning star:
- Compute ATR(14) on the candle immediately before candle 1.
- Candle 1 must be a down candle (close below open) with a body of at least 0.8 × ATR.
- Candle 2 must have a body no larger than 35% of candle 1's body. Colour is irrelevant; wicks are irrelevant to this test.
- Candle 3 must be an up candle with a body of at least 0.5 × ATR.
- Candle 3 must close above the midpoint of candle 1's body, i.e. above (open₁ + close₁) / 2.
The evening star is the exact mirror: candle 1 up, candle 3 down, closing below the midpoint of candle 1's body. Because crypto trades 24 hours a day, no gap is required between candles — more on that below.
``` ATR = Wilder ATR(14) on the bar before candle 1 body(i) = |close(i) - open(i)| mid1 = (open1 + close1) / 2
Morning star (bullish) close1 < open1 and body(1) >= 0.8 * ATR body(2) <= 0.35 * body(1) close3 > open3 and body(3) >= 0.5 * ATR close3 > mid1
Evening star (bearish) close1 > open1 and body(1) >= 0.8 * ATR body(2) <= 0.35 * body(1) close3 < open3 and body(3) >= 0.5 * ATR close3 < mid1 ```
Three optional context filters are used later on this page. They are not part of the pattern; they are conditions describing where the pattern occurred:
trend  : the 6 bars before candle 1 moved AGAINST the expected direction
         by at least 1.5 * ATR
volume : volume(candle 3) / 20-bar average volume >= 1.2
swing  : the pattern printed the lowest low (morning star) or the
         highest high (evening star) of the previous 20 bars
Note the sequencing: the pattern only completes at the close of candle 3. Everything before that close is provisional. A bar that looks like a decisive third candle two hours into a 4h period can finish as a doji.
Default settings and variations
The thresholds above are one defensible definition, not the definition. Classical texts describe the pattern in words — "a long body", "a small body", "well into the first body" — and every charting package turns those words into numbers differently. Change the numbers and the population of detected patterns changes with them.
| Rule | Value used here | Why | Common variations |
|---|---|---|---|
| Body 1 size | ≥ 0.8 × ATR(14) | Filters out noise bars; ATR scales with volatility | 1.0 × ATR (stricter); or "largest body of last 10 bars" |
| Body 2 size | ≤ 35% of body 1 | Defines the pause without demanding a perfect doji | ≤ 25% (stricter); exact doji only (morning/evening doji star) |
| Body 3 size | ≥ 0.5 × ATR(14) | Requires a real move back, not a token close | ≥ 0.8 × ATR; or body 3 ≥ body 1 |
| Body 3 close | beyond midpoint of body 1 | Nison's classic penetration requirement | beyond 62% of body 1; or a full close past open₁ |
| Gaps | not required | Crypto trades 24/7 | Equity/futures versions often require a gap on both sides |
| Prior move | optional filter | A "reversal" needs something to reverse | 1.5 × ATR over 6 bars (used here); or close below/above a 20-EMA |
Two named variants deserve a word. The doji star version (candle 2 is a doji) is the tightest form of hesitation. The abandoned baby is a rarer, stricter version in which candle 2 gaps away from both neighbours and its entire range, wicks included, stays separated. In 24/7 crypto markets, true abandoned babies essentially do not occur on liquid pairs, because each candle opens where the previous one closed.
That last point is the biggest adaptation crypto requires. In stock and futures markets, the classic star includes a gap down (or up) into the star and another gap away from it; the gap is the visual evidence of overnight repricing. Perpetual futures never close, so there is no overnight session and no gap. The crypto-adapted definition replaces "gap" with body size and closing level, which preserves the economic meaning — effort without follow-through, then reversal — while dropping a structural feature the market cannot produce.
How to read it
Read a star in the order the market produced it, not as a finished picture.
- Candle 1 tells you one side is still in control and still being paid for it. The bigger the body relative to ATR, the more one-sided the bar was.
- Candle 2 tells you the same pressure stopped producing movement. A small body after a large one is the informative part; a small body after another small body is nothing.
- Candle 3 tells you the other side was able to take back a large chunk of the move within a single bar. The further past the midpoint it closes, the more complete the handover.
- Where it happened often matters more than the shape. A morning star at the lowest low of the last 20 bars, after a sharp slide, is a different observation from one printed inside a two-week range.
A practical reading checklist:
| Check | Question to ask |
|---|---|
| Size | Is candle 1 genuinely large for this market's current ATR? |
| Pause | Is candle 2's body ≤ ~a third of candle 1's body? |
| Reversal | Does candle 3 close beyond the midpoint of candle 1's body? |
| Context | Did price actually move against the claimed direction before the pattern? |
| Location | Is this at a 20-bar extreme, a prior level, a range edge — or nowhere? |
| Participation | Was candle 3's volume above its own 20-bar average? |
| Timeframe | Does the same area look like anything on the next timeframe up? |
On volume, be precise about what you are measuring. Exchange OHLCV volume is aggregate traded volume for that market — it is not a buy/sell split, and it says nothing about who was aggressive. Relative volume (volume ÷ its own 20-bar average) only tells you that a bar was busier than the recent norm. That is a useful fact, but it is not "buying pressure".
How traders use it
1. As a location marker inside a trend-following framework. A trader who is already tracking a trend may treat an evening star in an uptrend as a sign that the current leg is tiring, and use it to tighten management of an existing position rather than to flip direction. Works when: the trend has run far enough to be extended and the star forms at an obvious extreme. Fails when: the trend is strong and persistent — stars also print during ordinary pullbacks inside ongoing trends, so a star that appears while a trend is still intact need not mark a turn at all. The pooled test on this page does not break results down by market regime, so treat any regime claim, including this one, as untested.
2. As a structural reference for stop placement. The pattern defines a clean extreme: the low of a morning star, the high of an evening star. Many traders use that level as an invalidation reference for ideas they already had for other reasons. Works when: the extreme is also a swing point on a higher timeframe. Fails when: the wick is tiny and the level sits inside the normal noise band — you are then placing an invalidation inside the market's ordinary breathing range, which in crypto perpetuals can be 1–2% in a single 4h bar.
3. As a confirmation filter for a level-based idea. If you have already identified a prior high, a range boundary or a value area, a star forming there is a second, independent piece of evidence that the level is being respected. Works when: the level was chosen in advance. Fails when: the level is drawn after the pattern appears — that is hindsight, and it is the single most common way candlestick analysis fools people.
4. As the basis for a personal, recorded test. The most valuable use for most retail traders is research. Pick one market and one timeframe, write the rules down as numbers, log every occurrence for three months (date, direction, ATR, prior move, relative volume, location, outcome after 6 and 12 bars), and compare the result to a baseline of random bars. You will usually learn more from 40 logged cases of your own than from a hundred chart screenshots.
In all four uses, the star is context, not instruction. None of the above tells you what to do; they describe how experienced traders fold the observation into a process they already have.
Example on a real SOL chart
All figures below come from one market and one window: SOL/USDT perpetual on Binance, 4h candles, 2026-04-23 to 2026-11-09, 1,200 bars, last close 87.44. In that window the rules detected 14 star patterns — 5 morning stars and 9 evening stars. Ten of them are listed here.
| Date (UTC) | Pattern | Close of candle 3 | After 6 bars | After 12 bars |
|---|---|---|---|---|
| 2026-05-23 12:00 | Morning star | 84.05 | +1.44% | +2.57% |
| 2026-06-03 12:00 | Evening star | 73.24 | −4.96% | −12.34% |
| 2026-06-11 00:00 | Morning star | 65.23 | +2.70% | +2.47% |
| 2026-06-25 20:00 | Morning star | 67.69 | +6.18% | +4.11% |
| 2026-07-29 12:00 | Evening star | 73.08 | +2.09% | −0.03% |
| 2026-08-09 20:00 | Evening star | 76.23 | −0.37% | +0.05% |
| 2026-08-13 16:00 | Morning star | 76.17 | −1.60% | −0.85% |
| 2026-09-27 12:00 | Evening star | 121.68 | −2.49% | −2.89% |
| 2026-10-21 20:00 | Evening star | 106.90 | −3.07% | −3.84% |
| 2026-10-29 00:00 | Evening star | 99.64 | −2.46% | −3.49% |
Across all 14 events in the window, 9 of 14 closed in the pattern's claimed direction six bars later. That is better than a coin flip in this sample, and it is also a sample of fourteen overlapping events on a single asset during one specific market phase. It proves nothing. Look at the misses: the morning star on 2026-08-13 at 76.17 was followed by −1.60% after six bars and was still −0.85% after twelve; the evening star on 2026-07-29 at 73.08 was followed by +2.09%. Both were textbook shapes.
Size matters too. The best bearish case, 2026-06-03 at 73.24, was −4.96% after six bars and −12.34% after twelve. The three evening stars in the autumn down-leg (121.68, 106.90, 99.64) each gave between −2.46% and −3.07% after six bars. Those are real moves, but they occurred inside a market that was already falling — which is exactly what the prior-trend filter is designed to notice.
To get sample sizes worth discussing, the same rules were run over a pool of 20 liquid USDT-margined perpetuals (BTC, ETH, SOL, BNB, XRP, DOGE, ADA, AVAX, LINK, DOT, LTC, TRX, ATOM, NEAR, APT, ARB, OP, SUI, INJ, FIL) on 4h candles from 2024-01-01 to 2026-11-07 — about 124,920 candles. That produced 1,259 star patterns: 598 bullish and 661 bearish. Outcome is the close 6 bars (and 12 bars) after candle 3, compared with candle 3's close; the baseline is the same share measured when any bar in the window is picked.
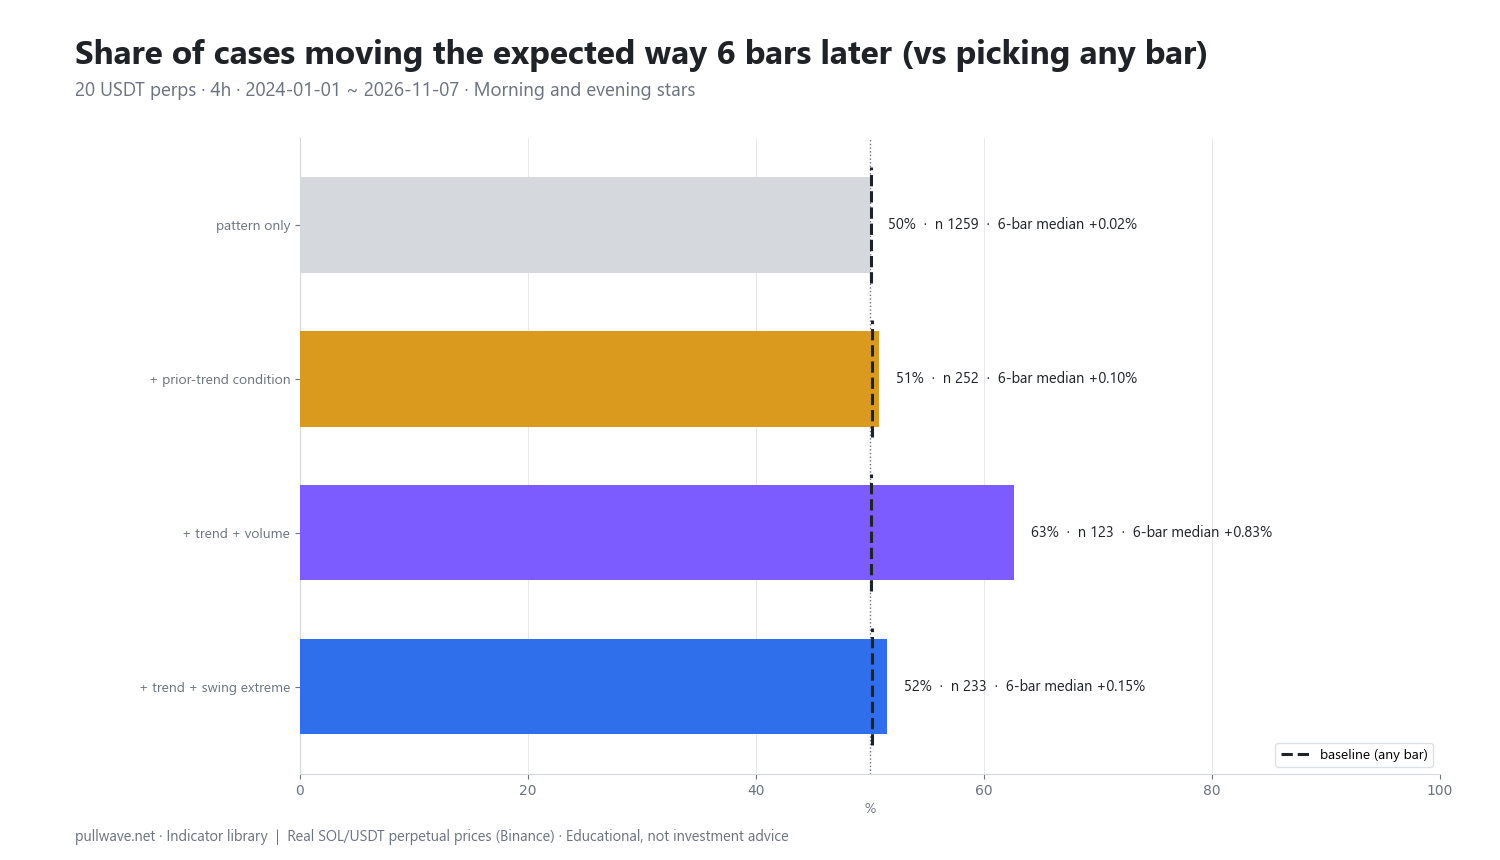
Figure 2 plots each variant against that baseline, with the number of cases and the median direction-adjusted move.
| Variant | n | 6 bars | baseline | median 6b | 12 bars | baseline | median 12b |
|---|---|---|---|---|---|---|---|
| Pattern only | 1,259 | 50.0% | 50.1% | +0.02% | 49.6% | 50.1% | −0.02% |
| + prior trend | 252 | 50.8% | 50.2% | +0.10% | 57.9% | 50.2% | +0.95% |
| + prior trend + volume | 123 | 62.6% | 50.1% | +0.83% | 65.0% | 50.2% | +1.95% |
| + prior trend + swing extreme | 233 | 51.5% | 50.2% | +0.15% | 58.8% | 50.3% | +1.15% |
Read the first row honestly: the raw pattern did nothing. 50.0% versus a 50.1% baseline after six bars, with a median move of +0.02%, is indistinguishable from picking a random bar. After twelve bars it was slightly below baseline. On this definition, timeframe and sample, a star with no context carried no information.
The context rows are more interesting and much smaller. Requiring a genuine prior move against the pattern (6 bars moving at least 1.5 × ATR the other way) cut 1,259 cases to 252 and lifted the 12-bar share to 57.9% with a median of +0.95%. Adding above-average volume on candle 3 (relative volume ≥ 1.2, applied together with the trend condition) left 123 cases at 62.6% after six bars and 65.0% after twelve, median +1.95%. The trend-plus-swing-extreme variant sat in between: 233 cases, 58.8% after twelve bars.
Now the caveats, which matter as much as the numbers:
- 123 cases is small, and events overlap in time. Crypto assets are highly correlated, so a single market-wide reversal can generate a dozen "independent" cases that are really one event. The effective sample is smaller than n suggests.
- No costs. Fees, slippage and perpetual funding are not included. On a median 12-bar move of +1.95%, round-trip costs and funding are not a rounding error.
- The thresholds are arbitrary. 0.8 ATR, 35%, 0.5 ATR, 1.2× volume, 1.5 × ATR over 6 bars — change any of them and the table changes. Testing many variants and reporting the best one is how researchers fool themselves.
- One timeframe, one asset class, one period. 4h crypto perpetuals from 2024 to 2026 is a specific regime, and nothing here says how the same rules behave on other timeframes or markets.
So the correct summary is: the raw star showed nothing, and the trend-plus-volume combination showed a tilt worth investigating as a hypothesis on your own data — not an edge, and certainly not a rule.
Common mistakes
Hindsight scanning. Patterns that preceded big moves jump off a historical chart; the dozens that preceded nothing are invisible. If you only ever look at stars after you already know what happened next, you will conclude the pattern works. Counting every occurrence, including the boring ones, is the only cure — the SOL window above had 14, not 3.
Trading every occurrence. The pooled data is blunt on this point: 1,259 raw patterns, 50.0% versus a 50.1% baseline. Taking every star that appears is, on this definition, equivalent to taking random bars while paying fees.
Ignoring the prior move. A reversal pattern needs something to reverse. A morning star in the middle of a sideways range is a shape without a story. The trend filter is what separated the 252 contextual cases from the 1,007 others.
Acting before candle 3 closes. The pattern is defined by a closing level. An intrabar "forming" star is not a star. On 4h crypto charts, a bar can reverse completely in its last 30 minutes.
Assuming your timeframe doesn't matter. Lower timeframes produce far more occurrences relative to ATR-scaled noise: on 5m or 15m crypto charts, bodies are small compared with spread and single large orders, so star shapes appear constantly. Only 4h candles were measured for this page, so nothing here demonstrates that any particular timeframe performs better — only that the number of occurrences and the outcomes differ by timeframe. Fix one timeframe before you collect statistics, and compare it only with results from the same timeframe.
Treating volume as direction. Relative volume ≥ 1.2 means the bar was busier than its 20-bar average. It does not mean buyers outnumbered sellers; every trade has both sides, and exchange OHLCV volume gives no aggressor split.
Forgetting leverage mechanics. On perpetual futures, a sharp candle 1 is often a liquidation cascade. The small candle 2 can simply be the absence of forced flow rather than considered hesitation, and candle 3 can be the bounce that follows any cascade. The shape is identical; the cause is not.
Confusing the star with its relatives. A two-bar reversal with a large engulfing body is an engulfing pattern. A single bar with a long wick is a pin bar, hammer or shooting star. A single bar with no body is a doji. Mislabelling makes your own statistics meaningless.
Combining it with other tools
The most effective combinations are the ones that supply what the pattern cannot: where you are and how much the market is moving.
- A trend reference (a 20- or 50-period moving average, or simply the net move of the last 6–20 bars in ATR terms) answers whether there is a trend to reverse. This was the single most useful filter in the pooled test.
- ATR is already inside the definition, but it is also how you judge whether the pattern's extreme is a meaningful distance away or inside normal noise. In crypto, where a 4h SOL bar can span 3%, an invalidation level half an ATR away is not an invalidation level.
- Horizontal levels and prior swings drawn before the pattern appears. The swing-extreme filter (lowest low / highest high of the previous 20 bars) is a mechanical version of the same idea: 233 cases, 58.8% at 12 bars.
- Relative volume as a participation check, with the caveats above. In the pooled sample, volume was the filter that moved the numbers most — and also the one that shrank the sample most.
- A higher timeframe as a sanity check. A 4h evening star inside a daily uptrend is a different observation from the same shape at a daily resistance level, even though this test did not measure daily data.
- Momentum oscillators such as RSI can describe whether the move into the pattern was stretched, but remember that in strong crypto trends oscillators stay extended for weeks. Treat a divergence as additional description, not as a second opinion from an independent source.
What stars are genuinely good for is more modest than most tutorials suggest: they give you precise vocabulary for price action ("a large down bar, a stall, and a full recovery past the midpoint, at the lowest low in 20 bars, on 1.4× volume"), a structural reference point for invalidation, and a timing context for ideas generated by other tools. That is a real contribution to a process. It is not a signal generator.
Frequently asked questions
Q. What is the difference between a morning star and an evening star?
They are mirror images. A morning star is bullish and forms after a decline: a long down candle, a small-bodied candle, then an up candle closing above the midpoint of the first body. An evening star is bearish and forms after an advance, with the colours reversed and the third candle closing below the midpoint of the first body.
Q. Is the morning star pattern reliable in crypto?
On its own, the evidence in this test says no. Across 1,259 patterns on 20 USDT perpetuals' 4h candles (2024-01 to 2026-11), price closed in the pattern's claimed direction 50.0% of the time after 6 bars against a 50.1% baseline, with a median move of +0.02%. Only when the pattern was combined with a prior counter-move and above-average volume did the numbers differ (62.6% after 6 bars on 123 cases), and that sample is small, overlapping and before costs.
Q. Does a morning star need a gap?
In the classic stock and futures definition, yes — the star traditionally gaps away from the first candle and sometimes from the third. Crypto perpetuals trade 24/7, so each candle opens essentially where the previous one closed and true gaps do not occur on liquid pairs. The crypto-adapted definition replaces gaps with body-size and closing-level rules, which keeps the economic meaning intact.
Q. What timeframe should I use for star patterns in crypto?
The measurements on this page were made only on 4h candles, so they say nothing about whether any other timeframe works better or worse. What is testable in general is that lower timeframes produce many more occurrences relative to ATR-scaled noise, and that outcomes differ by timeframe, which is why mixed-timeframe statistics are meaningless. Pick one timeframe, keep it fixed while you collect data, and compare results only within that timeframe.
Q. What is a morning doji star or an abandoned baby?
A morning doji star is a morning star whose middle candle is an actual doji — open and close virtually identical — representing a more complete standstill. An abandoned baby is the stricter form where the doji's entire range, wicks included, is separated by gaps from both neighbouring candles. Because crypto markets never close, abandoned babies effectively do not appear on liquid 24/7 pairs.
Q. How can I confirm an evening star before acting on it?
Confirmation is personal, but the measurable conditions used here are: a genuine prior advance (the 6 bars before candle 1 moved up by at least 1.5 × ATR), the pattern printing the highest high of the previous 20 bars, and relative volume on candle 3 of at least 1.2× its 20-bar average. Also wait for candle 3 to actually close, since the pattern is defined by a closing level. None of these guarantees anything; they simply narrow the set of occurrences to those with context.
Key takeaways
- The morning star and evening star are three-candle reversal shapes — push, pause, reversal — best defined numerically: body 1 ≥ 0.8 × ATR(14), body 2 ≤ 35% of body 1, body 3 ≥ 0.5 × ATR closing beyond the midpoint of body 1.
- Crypto's 24/7 trading removes the classic gap requirement, so the pattern must be identified by body sizes and closing levels rather than by visual separation between candles.
- In a pooled test of 124,920 4h candles across 20 perpetuals, the raw pattern performed at baseline: 50.0% versus 50.1% after 6 bars on 1,259 cases, median +0.02%.
- Context changed the picture on much smaller samples — prior trend plus above-average volume gave 62.6% (6 bars) and 65.0% (12 bars) on only 123 overlapping, cost-free cases. Treat that as a hypothesis to test on your own data, not as an edge.
- The pattern's durable value is descriptive: precise vocabulary for price action, a structural reference for invalidation levels, and context for tools you already use — not a standalone signal.
Educational material. Charts use real SOL/USDT perpetual prices; past behaviour does not predict future results. Not investment advice.