Indicator & technique library · Candlestick patterns deep dive
Harami Candle and Inside Bars: Rules, Data and Uses
At a glance
- A harami is a small opposite-colour body sitting entirely inside the previous large body; an inside bar is any candle whose whole high-low range fits inside the previous bar's range.
- Both describe contraction — a pause in range and momentum — rather than a reliable statement about direction.
- In a pooled test of 20 USDT perpetuals on 4h candles (about 125,000 bars, 2024-01 to 2026-11), harami followed through 52.9% of the time after 6 bars versus a 50.0% baseline; with a prior-trend and volume filter, 57.3% on 532 cases.
- Of 21,437 pooled inside bars, 32.3% first closed beyond the mother bar's high within 3 bars, 33.1% beyond its low, and 34.6% stayed inside — close to a coin flip with a large stall rate.
A harami is a two-candle shape: one large candle, then a much smaller candle of the opposite colour whose body sits entirely inside the body of the first. The Japanese name is an old word meaning "pregnant", which is why the two candles are often called the mother and the baby. An inside bar is the broader and simpler cousin: any candle whose entire range — high and low — fits inside the previous candle's range, regardless of colour.
Traders care about these shapes because they mark contraction. A wide, decisive bar is followed by a bar where almost nothing happens: the range narrows, the market stops making progress, and the previous bar's high and low become an obvious reference frame. That is useful as vocabulary and as geometry. Whether it tells you which way price goes next is a separate question, and the pooled numbers further down this page suggest the honest answer is: barely, and only with context.
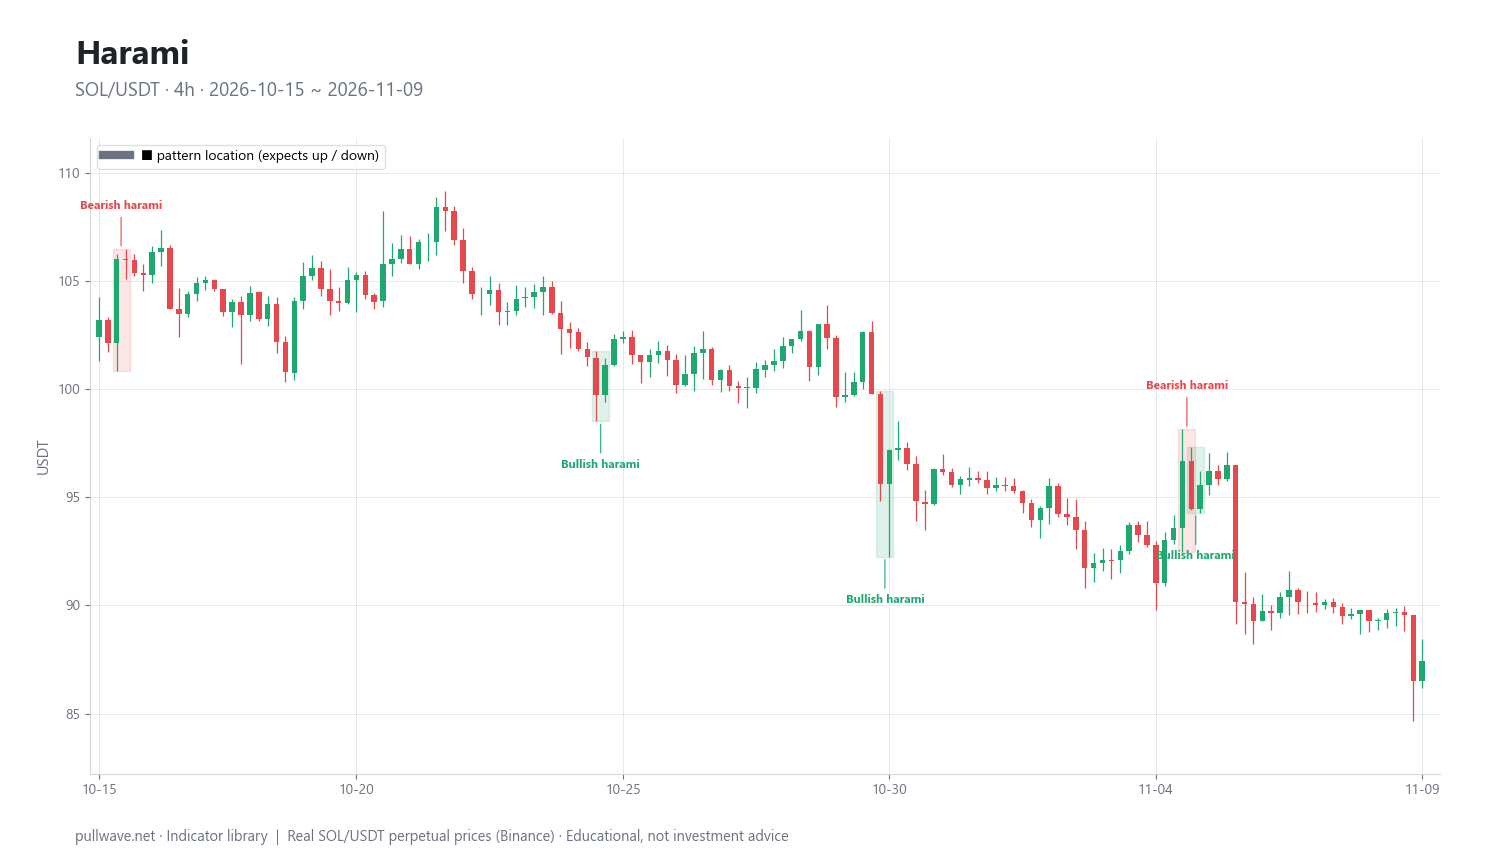
Figure 1 shows real SOL/USDT 4h candles with bullish and bearish harami outlined and labelled. Notice how each one is a wide-range candle followed by a compact candle that is completely swallowed, visually, by the body before it — and how the market's behaviour after each one differs considerably.
What is a harami, and what is an inside bar?
A bullish harami is a large down candle followed by a smaller up candle whose body lies entirely within the body of the down candle. A bearish harami is the mirror image: a large up candle followed by a smaller down candle contained inside it. The "bullish" and "bearish" labels describe what the pattern is claimed to signal — a reversal against the prior move — not what it guarantees.
The classical harami is defined on bodies (open-to-close), not on the full range. The baby candle's wicks may poke outside the mother's body; what matters is that its open and close both sit inside the mother's open-close span. Traditional descriptions also expect the prior candle to be genuinely large relative to recent volatility — a small body followed by a smaller body is just noise.
An inside bar uses the full range instead: the current candle's high is below the previous candle's high and its low is above the previous candle's low. The previous candle is called the mother bar (or harami bar in some texts). Colour is irrelevant. Every harami that also has its wicks contained is an inside bar, but most inside bars are not harami, because they do not require a large opposite-colour mother body.
A harami cross is the special case where the baby candle is a doji — open and close almost identical. Because the second candle shows near-total indecision, many classical texts treat it as a stronger version of the signal. The doji lesson in this series covers how to define "almost identical" sensibly; the same caution applies here.
The idea behind it (theory and history)
Candlestick charting comes from Japanese rice-market practice and was popularised in the English-speaking world by Steve Nison, whose Japanese Candlestick Charting Techniques (1991) introduced most of the pattern names Western traders now use, including the harami. The frequently repeated story that Munehisa Homma invented candlesticks in the 18th century is popular but poorly documented, so treat it as folklore rather than history.
The inside bar has a separate, Western lineage: it is standard bar-chart terminology, and narrow-range concepts such as NR4 and NR7 (the narrowest range of the last four or seven bars) are commonly attributed to Toby Crabel's 1990 work on short-term price patterns and opening-range breakouts. The two traditions converge on the same observation — a sharp contraction of range after expansion is worth noticing.
The logic is about participation, not magic. A wide candle means one side pushed through resting orders. The following small candle means that push has stopped: either the aggressive side is done, or the other side has started absorbing. Range contraction often precedes range expansion, because positions build inside a tight zone and the break of that zone forces adjustment.
That logic cuts both ways, and this is the key point. A pause after a strong move can resolve into a reversal or into a continuation after the market catches its breath. Nothing in the geometry of a harami says which. Academic work on equities and futures has generally found weak results for candlestick patterns once costs are included — the best-known example is Marshall, Young and Rose (2006, Journal of Banking & Finance), who tested candlestick strategies on Dow Jones stocks and found no value for investors; studies on intraday futures data have reached broadly similar conclusions. That does not make the shapes useless, but it does mean you should treat any pattern as context, not as a forecast.
How it is calculated
There is no indicator line to compute — detection is a set of conditions on consecutive candles. These are the exact rules used for the statistics reported on this page.
Step by step, in plain words:
- Compute a 14-period Wilder ATR, measured on the bar before the pattern starts. True range for each bar is the largest of: high minus low, the absolute difference between high and the previous close, and the absolute difference between low and the previous close. Wilder's smoothing updates the average as
ATR = (13 × previous ATR + current TR) / 14. - Measure the previous candle's body as the absolute difference between its open and its close. Require it to be at least 1.0 × ATR. This filters out harami that form inside quiet chop.
- Check that the current candle's body is the opposite colour to the previous candle's body.
- Check containment: the current candle's body top is at or below the previous body's top, and its body bottom is at or above the previous body's bottom.
- Check that the current body is smaller than the previous body.
- For inside bars, ignore all of the above and test only the range: current high below previous high, current low above previous low.
``` ATR14 = Wilder ATR, 14 periods, taken on the bar before the pattern body1 = |close[1] - open[1]| # mother candle body0 = |close[0] - open[0]| # baby candle
HARAMI (bullish): body1 >= 1.0 * ATR14 close[1] < open[1] # mother is a down candle close[0] > open[0] # baby is an up candle max(open[0], close[0]) <= open[1] min(open[0], close[0]) >= close[1] body0 < body1
HARAMI (bearish): mirror the colour and containment conditions
INSIDE BAR (reported separately, colour ignored): high[0] < high[1] low[0] > low[1] ```
Context filters, used to build the variants below, are evaluated at the moment of detection:
- Prior trend: the 6 bars before the pattern's first candle moved against the expected direction by at least 1.5 × ATR. A bullish harami therefore needs a real decline into it.
- Volume: the last candle's relative volume — its volume divided by its own 20-bar average volume — is at least 1.2.
- Swing extreme: the pattern made the lowest low (for bullish) or highest high (for bearish) of the previous 20 bars.
Outcome measurement: the close 6 bars and 12 bars after the pattern's last candle, compared with that candle's close, adjusted for the direction the pattern claims. The baseline is the same share measured when any bar in the window is picked at random, weighted by how many up-expecting and down-expecting cases there were — roughly 50%.
Default settings and variations
| Parameter | Default used here | Why / what changes |
|---|---|---|
| Mother body size | ≥ 1.0 × ATR(14) | Ensures the first candle is genuinely wide for current volatility; raise to 1.5 × ATR for fewer, more dramatic cases |
| ATR reference bar | Bar before the pattern | Avoids letting the pattern itself inflate the volatility estimate |
| Containment | Body inside body, strict | Some traders allow a small tolerance (e.g. equal opens/closes count); that increases counts noticeably |
| Baby body size | Smaller than mother | A harami cross requires the baby body to be near zero |
| Inside bar test | High and low both inside | Variation: body-only inside bars, or NR4/NR7 narrowest-range filters |
| Relative volume | ≥ 1.2 × 20-bar average | 1.5 or 2.0 makes the filter stricter and the sample much smaller |
| Prior trend | 6 bars, ≥ 1.5 × ATR against | Longer lookbacks catch slower trends; shorter ones catch spikes |
| Swing extreme | 20-bar high/low | 50-bar extremes are rarer and arguably more meaningful |
| Outcome horizon | 6 and 12 bars | On 4h candles that is one day and two days |
Every one of these thresholds is arbitrary. Change the mother-body requirement from 1.0 to 1.2 ATR and both the number of events and the hit rates move. That sensitivity is itself a useful finding: it tells you the pattern does not sit on a sharp statistical cliff.
In crypto there is one definitional adaptation worth noting. Classical stock-chart descriptions sometimes involve overnight gaps — an open away from the previous close. Perpetual futures trade 24/7, so the open of each candle sits essentially at the previous close. Any pattern definition that depends on gaps has to be rewritten in terms of bodies and ranges, which is exactly what the rules above do.
How to read it
Read the mother bar first: it tells you who was in control and how far they pushed. Then read the baby: a narrow body and narrow range means that during the whole of the next period, neither side could extend the move. Both tests together say "expansion, then compression".
The practical consequence is that the mother bar's high and low become a reference range. Price will eventually close above it, below it, or spend a while doing neither. The pooled inside-bar counts show how those three outcomes actually distributed across 21,437 inside bars on 4h candles from 20 USDT-margined perpetuals:
| First resolution within 3 bars | Count | Share |
|---|---|---|
| Close beyond the mother bar's high | 6,920 | 32.3% |
| Close beyond the mother bar's low | 7,103 | 33.1% |
| Neither (still inside) | 7,414 | 34.6% |
That is as close to a three-way split as you are likely to see. Upside and downside resolutions are near-identical in frequency, and roughly a third of inside bars simply do not resolve on a closing basis within three candles. Read that honestly: an inside bar is a pause signal, not a direction signal.
The harami numbers point the same way, with a small tilt. Across 4,354 pooled harami (2,252 bullish, 2,102 bearish), price closed in the claimed direction 52.9% of the time after 6 bars against a 50.0% baseline, with a direction-adjusted median move of +0.25%. After 12 bars the edge largely faded: 50.9% versus 50.0%, median +0.12%. Those are small numbers before any cost.
How traders use it
1. As a breakout frame around the mother bar. Instead of calling direction, some traders simply mark the mother bar's high and low and watch which side gets a decisive close first. When it works: in volatility-expansion regimes, when compression is followed by a genuine impulse. When it fails: in ranges, where both sides get broken in turn and the "breakout" level is just the middle of the noise. The 32/33/35 split above is the base rate you are working against.
2. As a continuation pause inside a trend. An inside bar or harami that forms while a trend is intact is often read as a rest rather than a turn. When it works: in strong, one-way markets where pullbacks are shallow. When it fails: near the end of an extended move, where the same shape precedes a reversal — which is precisely the ambiguity that makes the pattern weak on its own.
3. As a reversal candidate with context. This is where the filters matter. Requiring a real move into the pattern (6 bars against the expected direction by at least 1.5 × ATR) lifted the pooled 6-bar follow-through from 52.9% to 56.3% on 910 cases. Adding relative volume ≥ 1.2 gave 57.3% on 532 cases. When it works: after a stretched move into an obvious level, with visible participation. When it fails: when the "trend" is a single liquidation spike that reverses on its own anyway.
4. As stop geometry and sizing input. The most defensible use has nothing to do with prediction. A compressed bar gives a tight, objective invalidation reference — the mother bar's opposite extreme — which lets a trader express an idea with a smaller distance to invalidation. Crypto caveat: tight levels sit inside the range where stop-runs and wick sweeps are routine, especially around funding timestamps and in thin weekend liquidity.
Logging and testing it yourself
You do not need code to build an opinion. Pick one market and one timeframe, scroll back 300 candles, and record every harami or inside bar you can find with: date, direction, mother body size in ATR terms, relative volume, whether a trend preceded it, and the close 6 and 12 bars later. Fifty honest observations will teach you more about the pattern's base rate than fifty articles. The crucial discipline is to write the detection rules down before you scroll, so that hindsight cannot quietly adjust them.
Example on a real SOL chart
The chart window is SOL/USDT perpetual on Binance, 4h candles, 2026-04-23 to 2026-11-09 — 1,200 bars, with a last close of 87.44. Inside that window the rules above detected 47 harami: 22 bullish and 25 bearish, roughly one every 26 bars. Of those 47, 22 moved in the signalled direction at the measurement horizon — that is 46.8%, slightly below a coin flip on this single market and window.
Here are the ten most recent occurrences, with the close of the pattern's last candle and the percentage change 6 and 12 bars later:
| Date (UTC) | Pattern | Close | After 6 bars | After 12 bars |
|---|---|---|---|---|
| 2026-09-25 12:00 | Bearish harami | 120.07 | +1.47% | +1.34% |
| 2026-09-27 08:00 | Bearish harami | 123.86 | −4.20% | −3.05% |
| 2026-10-08 16:00 | Bullish harami | 109.08 | −0.58% | +1.23% |
| 2026-10-11 16:00 | Bearish harami | 111.33 | −2.77% | −3.44% |
| 2026-10-14 16:00 | Bullish harami | 104.17 | +1.74% | −0.65% |
| 2026-10-15 16:00 | Bearish harami | 105.98 | −2.35% | −1.83% |
| 2026-10-24 16:00 | Bullish harami | 101.11 | +0.64% | −0.67% |
| 2026-10-30 00:00 | Bullish harami | 97.19 | −1.06% | −1.68% |
| 2026-11-04 16:00 | Bearish harami | 94.48 | −4.69% | −4.59% |
| 2026-11-04 20:00 | Bullish harami | 95.55 | −6.54% | −5.70% |
Read the table with the chart in mind. This stretch of SOL was a persistent decline, from the 120s down toward the high 80s. The bearish harami mostly "worked" — four of the five fell over the next six bars, two of them by more than 4%. The bullish harami mostly did not: only two of five were followed by a higher close six bars later, and the 2026-11-04 20:00 case was followed by a 6.54% decline. The pattern that agreed with the prevailing direction did better; the pattern that argued against it did worse. That is one window on one asset, and it is a reminder that a "reversal" shape inside a downtrend is frequently just a pause.
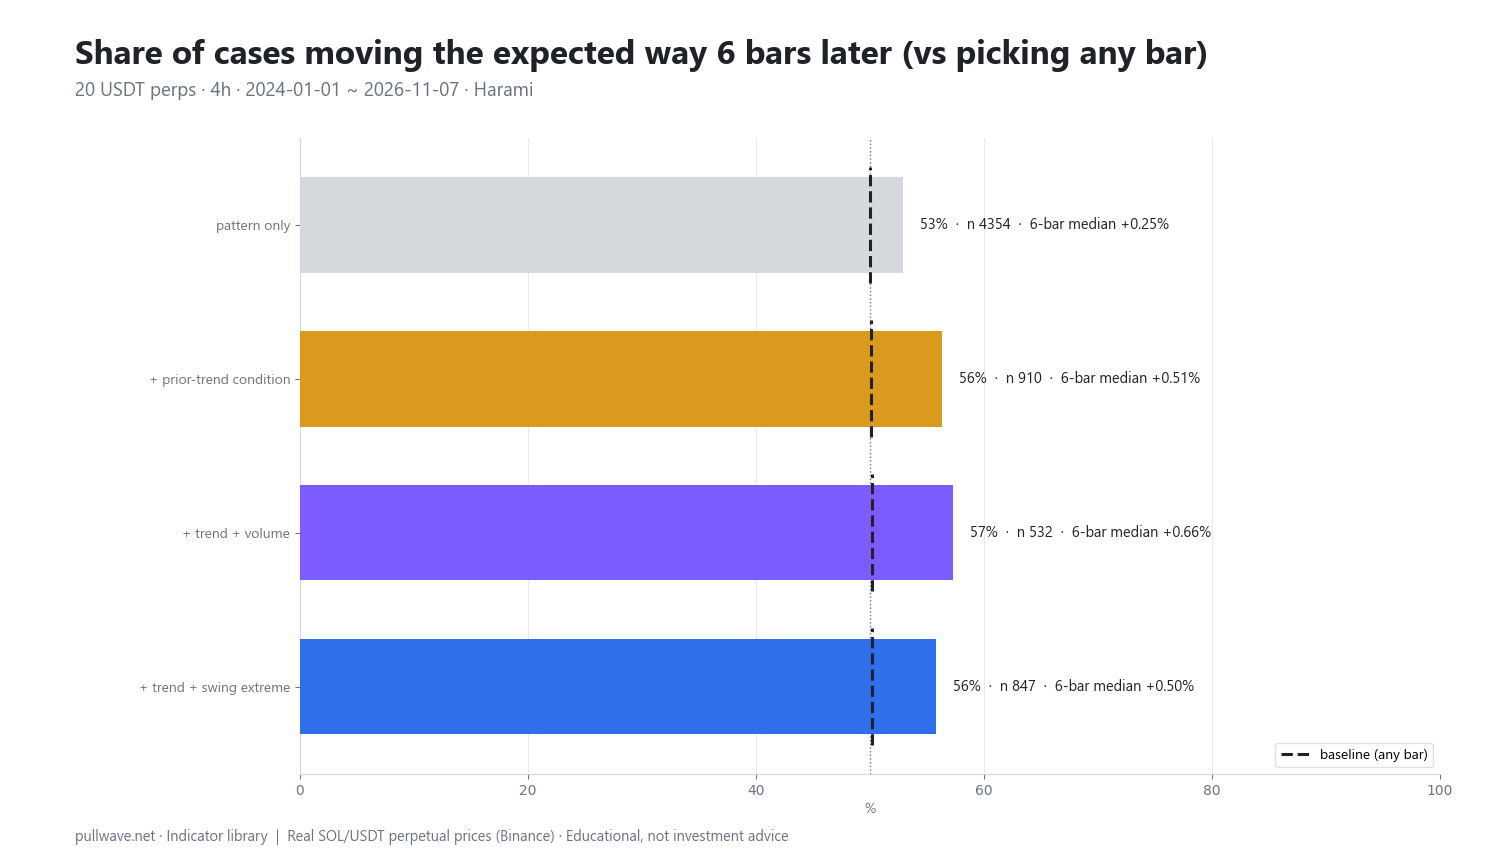
Figure 2 summarises the pooled test behind those observations: for the harami alone and for each context variant, the share of cases closing the expected way 6 bars later, the baseline for comparison, the sample size, and the median direction-adjusted move. The pool is 20 liquid USDT-margined perpetuals (BTC, ETH, SOL, BNB, XRP, DOGE, ADA, AVAX, LINK, DOT, LTC, TRX, ATOM, NEAR, APT, ARB, OP, SUI, INJ, FIL) on 4h candles, about 124,920 bars from 2024-01-01 to 2026-11-07.
| Variant | n | 6-bar expected | Baseline | Median 6-bar | 12-bar expected | Median 12-bar |
|---|---|---|---|---|---|---|
| Pattern only | 4,354 | 52.9% | 50.0% | +0.25% | 50.9% | +0.12% |
| + prior trend | 910 | 56.3% | 50.1% | +0.51% | 55.2% | +0.45% |
| + prior trend + volume | 532 | 57.3% | 50.2% | +0.66% | 54.9% | +0.65% |
| + prior trend + swing extreme | 847 | 55.8% | 50.2% | +0.50% | 55.1% | +0.44% |
The shape of the result is consistent: context helps a little, and the plain pattern barely moves the needle. But the caveats are heavy and you should weigh them properly. Pattern events overlap and crypto assets are highly correlated, so the effective sample is much smaller than n suggests — 532 cases across 20 coins that often move together is not 532 independent experiments. Fees, slippage and perpetual funding are not included, and a median move of +0.66% over 24 hours is the kind of number that costs can erase. The thresholds are one arbitrary definition. Results differ by timeframe and by market, as the SOL window above demonstrates. Treat the "+ volume" tilt as a hypothesis worth testing on your own data, not as an edge.
Common mistakes
Hindsight scanning. Harami and inside bars are trivially obvious once you know what happened next. Scrolling a chart and pointing at the ones that preceded big moves teaches nothing. Define the rules first, then count every occurrence, including the boring ones.
Treating the harami as a direction call. The pooled data say it is primarily a pause marker. Of 21,437 inside bars, resolution up and resolution down were within one percentage point of each other, and a third stalled entirely. If your plan needs the pattern to supply direction, the plan needs a different input.
Ignoring timeframe. A harami on a 1-minute chart in thin liquidity is a microstructure artefact. On a daily chart it summarises a whole session of indecision. The statistics here are 4h-specific and should not be assumed to transfer.
No confirmation and no invalidation. A pattern with no defined level at which you accept you were wrong is not a method. The mother bar's extremes are the natural reference; whether price closes beyond them, and how quickly, is information the pattern itself does not contain.
Trading every occurrence. The pattern alone appeared 4,354 times in the pool — far too often to be special. Filters cut the sample to a fifth, which is the point: the version worth studying is rare.
Misreading volume. Exchange OHLCV volume is an aggregate; it is not a buy/sell split and it does not tell you who initiated. Relative volume only says a bar was busier than its own recent average. A 1.2 reading means "somewhat more active than usual", nothing more.
Forgetting the crypto plumbing. On perpetuals, funding payments accrue while you hold, liquidation cascades can produce a wide mother bar that reflects forced selling rather than any opinion, and 24/7 trading means your 4h candle boundaries are an arbitrary grid. Different exchanges and different candle offsets will not always show the same pattern.
Combining it with other tools
The most useful combinations add the information the pattern lacks — direction and location.
- Trend context. A moving average, market structure (higher highs/lower lows), or the explicit 1.5 × ATR prior-move test used above. The pooled numbers improved only when this was added, which is consistent with the idea that the pattern is about pausing, not turning.
- ATR. Use it twice: once to decide whether the mother bar is genuinely large, and once to judge whether the typical follow-through is big enough to matter relative to the distance to your invalidation level.
- Horizontal levels and prior swings. A compression bar at a 20-bar extreme or an obvious prior high is more interesting than the same shape in the middle of a range. The swing-extreme variant above reached 55.8% at 6 bars on 847 cases.
- Volatility-compression indicators. Bollinger Band width or Keltner-style squeeze measures describe the same contraction over a longer stretch; an inside bar inside an already-compressed regime is a stronger statement about equilibrium.
- Other candlestick lessons. The harami sits naturally next to the engulfing pattern (its structural opposite — the second body swallows the first rather than hiding inside it), the doji, the hammer and shooting star, pin bars, marubozu, morning and evening stars, tweezers and three white soldiers / three black crows. Reading a single candle well is the prerequisite for all of them.
What the harami and the inside bar are genuinely good for: a precise vocabulary for describing price action, an objective frame for stop placement, and a trigger to pay attention when a market stops expanding. That is a modest, honest job description, and it fits the evidence better than any claim about reversals.
Frequently asked questions
Q. What is the difference between a harami and an inside bar?
A harami is defined on candle bodies: a large body (here, at least 1.0 × ATR) followed by a smaller opposite-colour body that lies entirely inside it, with wicks allowed to protrude. An inside bar is defined on the full range: the current candle's high is below the previous high and its low is above the previous low, with colour and body size irrelevant. Inside bars are far more common — about 21,437 appeared in the 124,920-candle pool, versus 4,354 harami.
Q. Is a harami a reversal signal?
Classically it is described that way, but the data here argue it is better understood as a pause. Across 4,354 pooled 4h occurrences, price closed in the claimed reversal direction 52.9% of the time after 6 bars versus a 50.0% baseline, and the advantage shrank to 50.9% after 12 bars. Only when a strong prior move and above-average volume were also required did the 6-bar share reach 57.3%, on 532 cases.
Q. How reliable is the inside bar breakout?
In the pooled sample, of 21,437 inside bars, 6,920 (32.3%) first closed beyond the mother bar's high within 3 bars, 7,103 (33.1%) first closed beyond its low, and 7,414 (34.6%) did neither. Direction is close to a coin flip and roughly a third of cases do not resolve at all on a closing basis within three candles. Any approach built on inside-bar breakouts has to survive that base rate after fees, slippage and funding.
Q. What is the best timeframe for harami and inside bars in crypto?
There is no universally best choice, but higher timeframes filter noise better. The statistics on this page use 4h candles, where a 6-bar horizon equals one day and a 12-bar horizon two days. On 1-minute and 5-minute crypto charts, inside bars are extremely common and are often an artefact of thin liquidity rather than meaningful equilibrium.
Q. What does a harami cross mean?
A harami cross is a harami whose second candle is a doji — open and close essentially equal. Because the baby candle shows almost total indecision, many classical texts regard it as a more emphatic version of the pause. It is rarer than the standard harami, so any statistics you compute on it will rest on a smaller sample and should be read with that in mind.
Q. Do candlestick patterns actually work in crypto markets?
Academic studies on equities and futures have generally found weak or no profitable predictive power from candlestick patterns once trading costs are included; Marshall, Young and Rose (2006, Journal of Banking & Finance) found no value in candlestick strategies on Dow Jones stocks. The crypto numbers on this page are consistent with that: small tilts above a 50% baseline, shrinking with time, before costs. Patterns are most defensible as a description of what price did and as a framework for defining risk, not as a forecasting tool.
Key takeaways
- A harami is a small opposite-colour body fully inside a large previous body (here, at least 1.0 × ATR); an inside bar is any candle whose entire high-low range fits inside the previous bar's range.
- Both describe contraction after expansion. The pooled evidence — 32.3% up, 33.1% down, 34.6% unresolved within 3 bars for inside bars — says the shape marks a pause, not a direction.
- Harami follow-through in the pool was 52.9% at 6 bars versus a 50.0% baseline, rising to 57.3% on 532 cases when a prior 1.5 × ATR move and relative volume ≥ 1.2 were both required; overlapping events, correlated assets and excluded costs mean this is a hypothesis, not an edge.
- On SOL/USDT 4h between 2026-04-23 and 2026-11-09, 47 harami appeared and only 22 moved in the signalled direction — below a coin flip, with bearish signals in a downtrend faring far better than bullish ones.
- The durable value of these patterns is vocabulary and geometry: the mother bar gives an objective reference range for defining where an idea is wrong, which is useful regardless of what the pattern predicts.
Educational material. Charts use real SOL/USDT perpetual prices; past behaviour does not predict future results. Not investment advice.