Indicator & technique library · Candlestick patterns deep dive
Engulfing Candle Pattern: Rules, Context and Evidence
At a glance
- An engulfing pattern is a two-candle formation in which the second real body fully covers the previous, opposite-coloured real body.
- The classic test uses bodies only, with a minimum prior-body size (here 0.30 x ATR) so that engulfing a doji does not count.
- In a pooled test of 10,836 engulfing patterns on 4h candles across 20 crypto perpetuals, 48.9% closed in the expected direction after 6 bars against a 50.0% baseline.
- Adding prior-trend, volume and swing-extreme context moved the numbers only fractionally, so the pattern is better treated as vocabulary and level definition than as a forecast.
An engulfing pattern is a two-candle formation: one candle of a given colour, followed by a candle of the opposite colour whose real body completely covers the previous real body. A bullish engulfing has a down candle followed by an up candle that opens at or below the prior close and closes at or above the prior open; the bearish version is the mirror image. It is one of the first patterns most traders learn, because it is easy to see and easy to describe.
Traders care about it for two different reasons, and it is worth separating them. The first is narrative: a full body reversal looks like a shift of control from sellers to buyers (or the reverse). The second is mechanical: the pattern marks a precise high and low on the chart, which gives you a level to define risk against. The narrative is a story; the levels are real. This page gives the exact rules, the variations, and an honest look at what a large pooled sample of crypto 4-hour candles did after these patterns appeared.
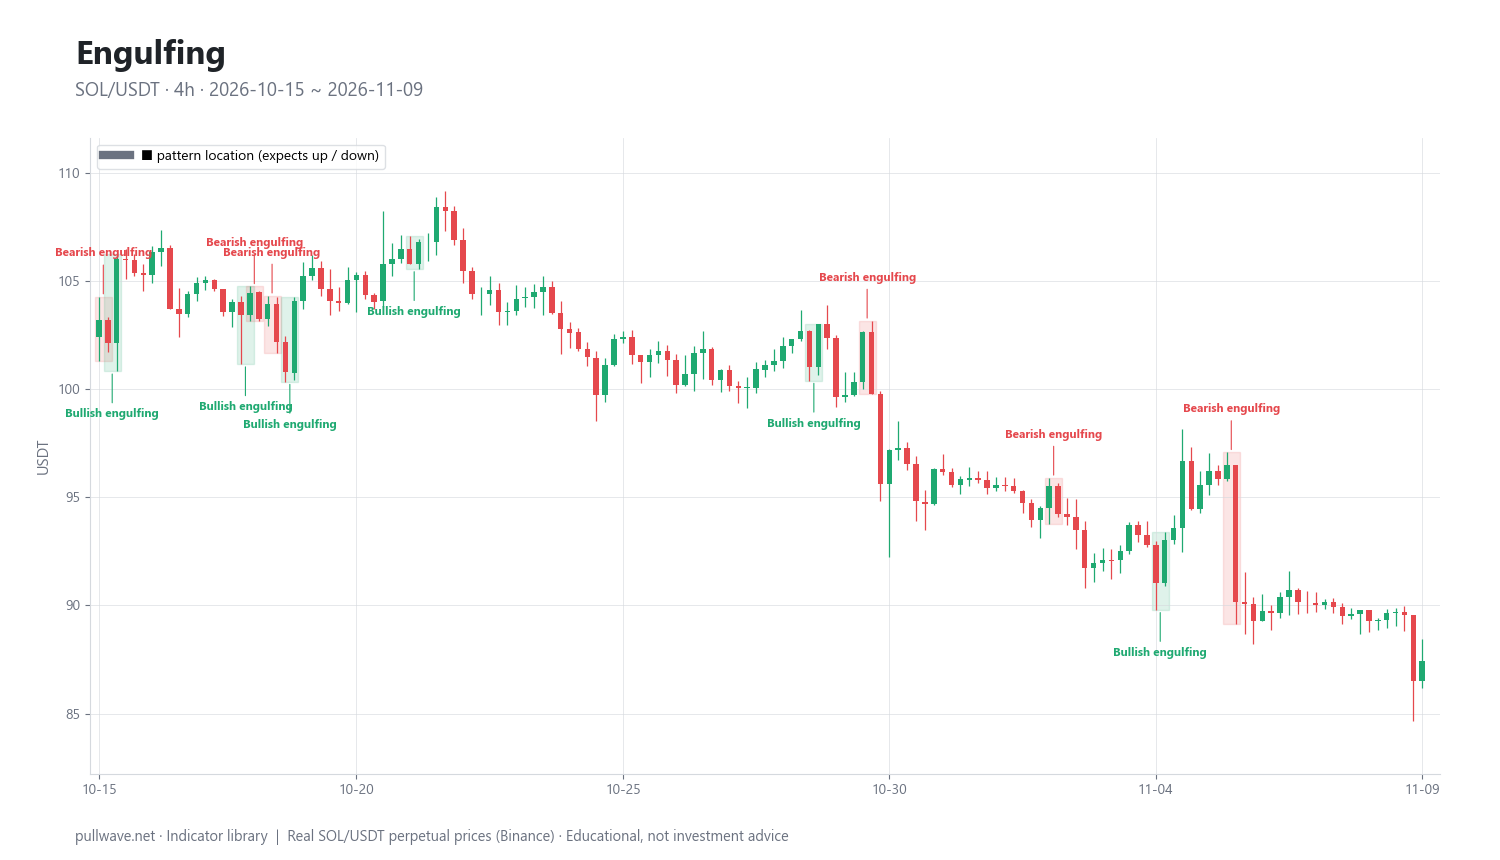
Figure 1 shows real SOL/USDT 4-hour candles with bullish and bearish engulfing patterns outlined and labelled. Notice two things immediately: the patterns appear often, and they appear in both directions within short stretches of chart. That frequency is the first fact any honest treatment of the pattern has to deal with.
What is an engulfing pattern?
The engulfing pattern belongs to the two-candle reversal family of Japanese candlestick charting. It requires:
- Two consecutive candles of opposite colour. A bullish engulfing needs a down (bearish) candle first, then an up (bullish) candle. A bearish engulfing needs an up candle first, then a down candle.
- Body containment. The second candle's real body — the distance between open and close — must cover the first candle's real body completely.
- A prior body worth engulfing. Engulfing a doji or a near-doji is trivial and tells you nothing, so serious definitions require the first body to exceed a minimum size.
The classic definition ignores the wicks. A bullish engulfing candle can have a lower low and a higher high than the previous bar, or it can sit entirely inside the previous bar's range as long as its body wraps the previous body. When the second candle's entire range covers the previous range, you have an outside bar — sometimes called a range engulf or, on Western bar charts, a key reversal. Many traders treat the outside bar as the stronger variant; it is a different (and rarer) condition, and it is worth keeping the two labels separate so you know what you are actually testing.
It helps to place the pattern among its siblings. The harami and inside bar are the logical inverse — a small body nested inside the previous large body. The marubozu is a single candle with almost no wicks. Pin bars, the hammer and the shooting star are single-candle shapes defined by wick-to-body ratios. The doji is the indecision case. Engulfing is simply the two-candle case where the second body dominates the first.
The idea behind it (theory and history)
Candlestick charting comes from Japanese rice and commodity markets and was popularised in the English-speaking world by Steve Nison, whose Japanese Candlestick Charting Techniques appeared in 1991. Nison's book is the reference point for the modern naming and classification of these patterns; the engulfing pattern is usually rendered in Japanese sources as tsutsumi, meaning something like "wrapping". The often-repeated story that an 18th-century rice trader named Munehisa Homma invented candlestick patterns is popular but poorly documented, and the specific "rules" attributed to him in trading books should be treated as folklore rather than history.
The theory behind the pattern is a story about control. In a bullish engulfing, the previous period closed near its low with sellers in charge. The next period opens around that close and then trades all the way up through the prior open, closing above it. Everyone who sold during the previous bar is now underwater; if those positions are covered, their buying adds fuel. The pattern is read as a momentum shift plus a pool of trapped traders.
That story may well be what happened. But you cannot verify it from a candle. OHLCV data shows you where price opened, how far it travelled and where it closed — not who was aggressive, not whether the move came from one large order or a thousand small ones, and not whether positioning actually flipped. The candle is a summary of a time slice, nothing more. Treating the narrative as a mechanism is where most candlestick trading goes wrong.
The academic record is sobering. Studies on equities and futures have generally found weak or no profitable predictive power from candlestick patterns once realistic trading costs are included. Marshall, Young and Rose (2006, Journal of Banking & Finance) tested candlestick strategies on Dow Jones stocks and did not find evidence of value for investors; Fock, Klein and Zwergel (2005) reached similar conclusions using intraday futures data. Crypto is a different market with different microstructure, so those results do not transfer automatically — but they set the prior you should start from: a two-bar shape, on its own, is unlikely to forecast direction.
How it is calculated
There is nothing to compute in the indicator sense — no smoothing, no lookback average in the pattern itself. What you do need is a precise rule set, because "the body covers the previous body" hides several choices. Here are the exact rules used for the statistics on this page, step by step:
- Measure volatility first. Compute a 14-period Wilder ATR and read it on the bar before the pattern starts (the bar preceding the first of the two candles). Using an earlier bar avoids letting the pattern's own size inflate the threshold.
- Check the first candle's direction and size. For a bullish engulfing, candle one must close below its open, and its body — the absolute difference between open and close — must be at least 0.30 x ATR(14). This removes doji and micro-bodies.
- Check the second candle's direction. It must close above its open for a bullish engulfing.
- Check containment. The second candle must open at or below the first candle's close, and close at or above the first candle's open. Wicks are ignored.
- Mirror everything for the bearish case. First candle up and large enough, second candle down, opening at or above the prior close and closing at or below the prior open.
``` ATR14 = Wilder ATR(14), read on bar t-2 body(x) = |close(x) - open(x)|
Bullish engulfing at bar t: close(t-1) < open(t-1) # previous candle is bearish body(t-1) >= 0.30 * ATR14 # previous body is meaningful close(t) > open(t) # current candle is bullish open(t) <= close(t-1) # opens at or below the previous close close(t) >= open(t-1) # closes at or above the previous open
Bearish engulfing at bar t: close(t-1) > open(t-1) body(t-1) >= 0.30 * ATR14 close(t) < open(t) open(t) >= close(t-1) close(t) <= open(t-1) ```
Note the <= and >= on the open. In stock markets, textbooks often require the second candle to open with a gap beyond the previous close. Crypto trades 24/7 on perpetual and spot markets, so each candle opens essentially where the last one closed; a strict gap requirement would almost never trigger. The equal-or-beyond convention is the natural adaptation, and it is effectively a zero tolerance for an adverse open.
Context flags used later are defined just as mechanically:
- Trend: the 6 bars before the pattern's first candle moved against the pattern's claimed direction by at least 1.5 x ATR. A bullish engulfing therefore needs a real decline behind it, not a flat drift.
- Volume: the last candle's volume divided by its own 20-bar average volume is at least 1.2.
- Swing: the pattern printed the lowest low (bullish) or highest high (bearish) of the previous 20 bars.
One caution on volume: exchange OHLCV volume is aggregate traded quantity for that market. It is not a buy/sell split and it does not tell you who initiated. Relative volume above 1.2 only means the bar was busier than its recent norm — which can be caused by a liquidation cascade just as easily as by considered accumulation.
Default settings and variations
| Parameter | Default used here | Why | Common variations |
|---|---|---|---|
| Engulf test | Real bodies only | Matches the classic definition; wicks are noisy in crypto | Full range (outside bar); body plus wicks |
| Prior body size | >= 0.30 x ATR(14) | Stops a doji from being "engulfed" | 0.25-0.50 ATR; or larger than the median body of the last 20 bars |
| ATR reference | Wilder ATR(14) on the bar before the pattern | Avoids the pattern inflating its own benchmark | ATR(20); ATR read on the first candle |
| Open tolerance | Open at or beyond the previous close | 24/7 markets have no overnight gaps | Strict gap (equities); small tolerance in ticks or basis points |
| Second body size | Not filtered | Keeps the sample large and the rule simple | Require second body >= 1.0 or 1.5 x ATR |
| Trend context | 6 bars moved >= 1.5 x ATR against the signal | A reversal needs something to reverse | 20-EMA slope or position; swing structure |
| Volume context | Relative volume >= 1.2 | Flags an unusually busy bar | 1.5 or 2.0; or no volume filter at all |
| Location context | Lowest low / highest high of previous 20 bars | Puts the pattern at an extreme, not mid-range | 10, 50 bars; distance from a prior level |
The two variations that change the character of the pattern most are the range engulf (outside bar) and the multi-candle engulf, where the second body swallows several small previous bodies rather than one. Both are legitimate; both are rarer; both will give you different statistics. The timeframe choice matters as much as any parameter: a 5-minute engulfing on a quiet Sunday is a different object from a weekly engulfing, even though the rules are identical.
How to read it
Read the location before the shape. An engulfing pattern in the middle of a range is a description of noise. The same shape at the low of a multi-day decline, at a prior support shelf, or at the point where a trend pullback stalls is at least a candidate for something. The pattern never supplies its own context.
Then read the size. Compare the second candle's body to recent ATR. A bullish engulfing whose body is 0.4 x ATR is a shrug; one whose body is 2 x ATR is a large displacement that will also sit far from any sensible invalidation level — which is its own problem, because the stop distance grows with the signal.
Then read the close. A second candle that closes just barely past the prior open is a borderline case; one that closes near its own high (effectively a marubozu-like finish) shows price held the move into the bar close. Finally, read what happens next. The bar after the pattern either extends the move or immediately trades back inside the engulfing candle's range. Many discretionary traders treat the engulfing candle's extreme — the low of a bullish engulfing, the high of a bearish one — as the level that defines whether the idea is still alive.
How traders use it
1. As a reversal candidate at a swing extreme. The textbook use: a bullish engulfing after a decline, at or near the lowest low of recent bars, ideally where a prior level sits. When it tends to work: in markets that mean-revert after extended one-way moves, where a visible extreme attracts resting orders. When it fails: in strong, persistent trends, where every counter-trend engulfing is simply the start of another lower high. A pattern that keeps "failing" in the same direction is telling you about the regime, not about the pattern.
2. As a trend-continuation trigger. A bullish engulfing that ends a pullback inside an uptrend is used as a timing tool rather than a reversal call. When it tends to work: in orderly trends with shallow pullbacks, where the pattern simply marks the point the pullback stopped. When it fails: when the "pullback" is actually the first leg of a reversal, or when the trend is so choppy that pullback ends occur every few bars.
3. As a risk-definition device. Even traders who do not treat the pattern as a signal use it to place stops: the engulfing candle's extreme is an objective, visible level, and ATR tells you whether the resulting distance is tolerable. When it tends to work: when the candle is of normal size relative to ATR. When it fails: after liquidation-driven spikes, when the candle's range is several times ATR and a stop beyond it implies a position so small it is pointless, or a risk so large it is reckless.
4. As a confirmation filter for another tool. Some traders will not act on an RSI divergence, a moving-average touch or a support retest until price prints a body reversal on the timeframe they trade. The pattern contributes timing and a level; the other tool contributes the reason. When it tends to work: when the filter genuinely reduces the number of trades taken in the wrong regime. When it fails: when it just delays entry until after the easy part of the move, or when it is added after the fact to rationalise a decision already made.
Example on a real SOL chart
The chart in Figure 1 is SOL/USDT perpetual on Binance, 4-hour candles, from 2026-04-23 to 2026-11-09 — 1,200 bars, ending at a close of 87.44. Applying the rules above, that window contains 89 engulfing patterns: 47 bullish and 42 bearish. That is roughly one every 13 bars, or one every two days. Any pattern that frequent cannot, by itself, be a rare signal of exhaustion.
Here are ten labelled events from the last weeks of the window. "After 6 bars" and "after 18 bars" are the raw percentage changes in price from the pattern's last close; for a bullish pattern a positive number is the claimed direction, for a bearish pattern a negative number is.
| Date (UTC) | Pattern | Close | After 6 bars | After 18 bars |
|---|---|---|---|---|
| 2026-10-18 00:00 | Bullish engulfing | 104.47 | +0.72% | +1.25% |
| 2026-10-18 04:00 | Bearish engulfing | 103.26 | +2.28% | +3.43% |
| 2026-10-18 12:00 | Bearish engulfing | 102.17 | +1.88% | +6.14% |
| 2026-10-18 20:00 | Bullish engulfing | 104.07 | +0.92% | +2.72% |
| 2026-10-21 04:00 | Bullish engulfing | 106.80 | -2.27% | -4.63% |
| 2026-10-28 16:00 | Bullish engulfing | 103.02 | -3.15% | -7.03% |
| 2026-10-29 16:00 | Bearish engulfing | 99.78 | -5.09% | -5.84% |
| 2026-11-02 04:00 | Bearish engulfing | 94.24 | -2.30% | +1.71% |
| 2026-11-04 04:00 | Bullish engulfing | 93.02 | +3.04% | -3.05% |
| 2026-11-05 12:00 | Bearish engulfing | 90.16 | +0.60% | -0.52% |
The single most instructive row group is 18 October: four engulfing patterns in 24 hours, alternating bullish, bearish, bearish, bullish, within a range of about two dollars. Two of them resolved against their claimed direction over the next six bars, two with it. This is what the pattern looks like in chop — it does not stop firing because the market has no direction, and the signals contradict each other.
The cluster from 21 to 29 October is the opposite failure mode: bullish engulfings on 21 and 28 October both preceded further declines (-2.27% and -3.15% after six bars; -4.63% and -7.03% after eighteen), because the market was in a sustained downtrend from roughly 107 toward the low 90s. The bearish engulfing on 29 October was followed by -5.09% and -5.84% — the same environment that punished the bullish signals rewarded the bearish one. Across the whole SOL window, 41 of the 80 events with a measurable outcome closed in the pattern's claimed direction at the first horizon measured — 51%, which is what you would expect from a coin flip on a 1,200-bar sample.
One chart, one asset, one window is never evidence. To get sample sizes worth discussing, the same rules were applied to 4-hour candles on 20 liquid USDT-margined perpetuals (BTC, ETH, SOL, BNB, XRP, DOGE, ADA, AVAX, LINK, DOT, LTC, TRX, ATOM, NEAR, APT, ARB, OP, SUI, INJ, FIL) from 2024-01-01 to 2026-11-07 — about 124,920 candles. That produced 10,836 engulfing patterns (5,516 bullish, 5,320 bearish).
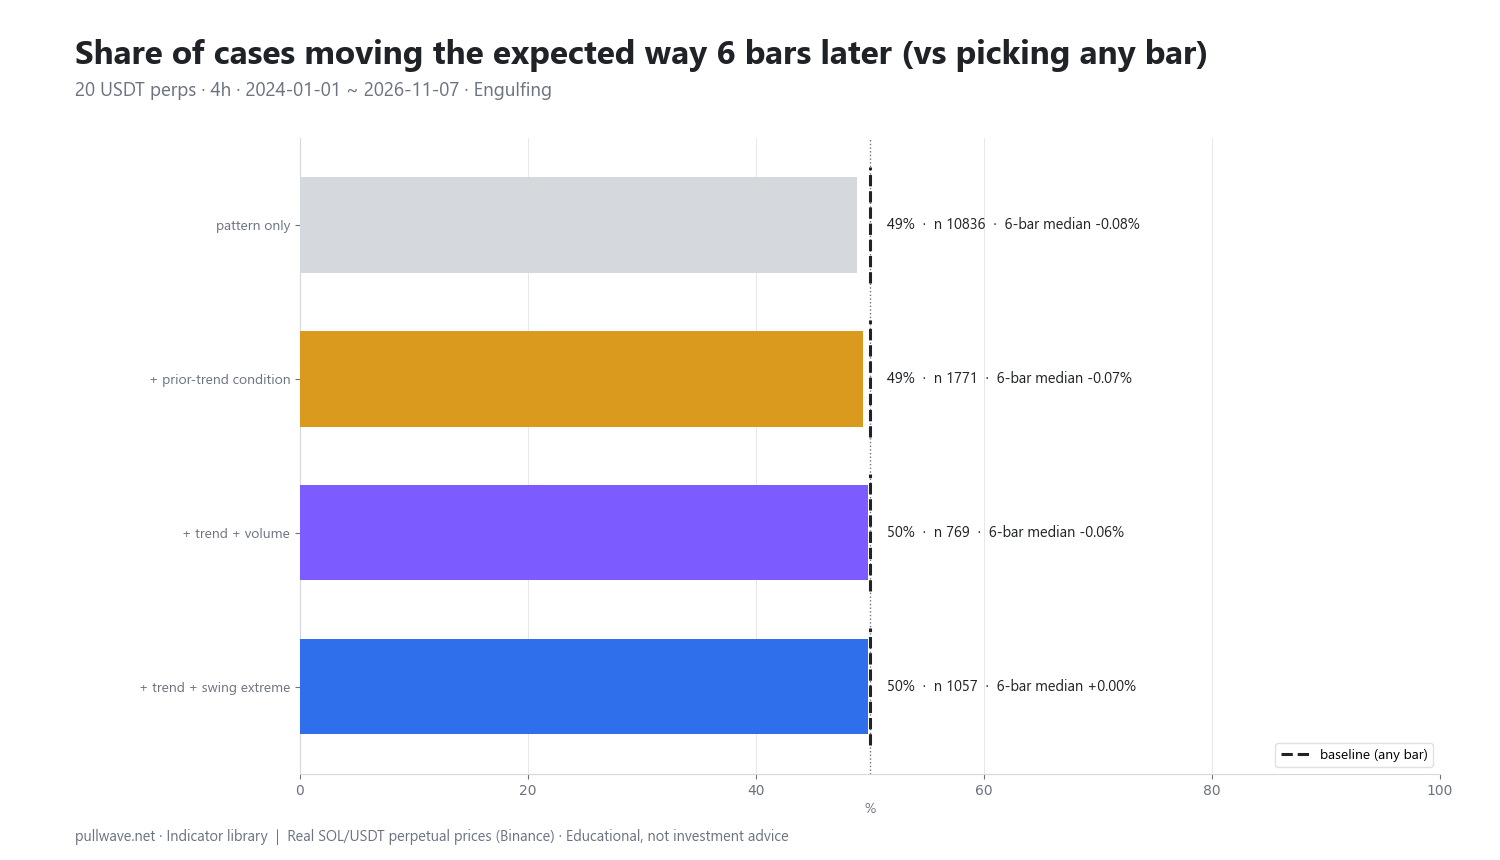
Figure 2 shows the result as bars: the pooled share of cases that closed in the expected direction six bars later for the pattern alone, with the prior-trend condition, with trend plus volume, and with trend plus a swing-extreme location, against the dashed baseline — the share you get by picking any bar in the same window, weighted by how many up- and down-expecting cases there were.
| Variant | n | 6 bars | Baseline | Median 6b | 12 bars | Baseline | Median 12b |
|---|---|---|---|---|---|---|---|
| Pattern only | 10,836 | 48.9% | 50.0% | -0.08% | 50.4% | 50.0% | +0.05% |
| + prior trend | 1,771 | 49.4% | 50.0% | -0.07% | 51.2% | 49.9% | +0.12% |
| + trend + volume | 769 | 49.8% | 50.0% | -0.06% | 50.5% | 49.9% | +0.07% |
| + trend + swing extreme | 1,057 | 49.8% | 50.0% | 0.00% | 50.9% | 50.0% | +0.11% |
Read honestly, this says: on 4-hour crypto candles over this period, the engulfing pattern on its own was slightly worse than a random bar at the six-bar horizon (48.9% versus 50.0%, median move -0.08%) and indistinguishable from random at twelve bars (50.4% versus 50.0%, median +0.05%). Adding a prior-trend requirement nudged the twelve-bar share to 51.2% against a 49.9% baseline with a median of +0.12%; adding a swing-extreme location gave 50.9% with a median of +0.11%. Those are differences of roughly one case in a hundred, on medians of about a tenth of a percent — smaller than round-trip taker fees plus slippage on most perpetual venues, before funding.
Four caveats matter more than the numbers themselves. Events overlap — the 18 October cluster shows four patterns inside 24 hours, so consecutive observations are not independent. Crypto assets are highly correlated, so 20 markets do not give 20 independent samples; the effective sample is far smaller than n suggests. No costs are modelled: no fees, no slippage, no funding, no trading rules, no stops. And the thresholds are one arbitrary definition — change 0.30 ATR to 0.5, require the second body to be large, use the outside-bar variant, or move to a different timeframe, and the numbers will move too. Treat the modest tilt under trend and swing context as a hypothesis worth testing on your own data, not as an edge.
Common mistakes
Hindsight. On a chart you have already read, the engulfing patterns that preceded big moves jump out and the dozens that did not are invisible. The cure is mechanical: mark every pattern that meets your rule, in order, before you know what came next.
Trading every occurrence. At roughly one per 13 bars on a 4-hour chart, taking every engulfing pattern on a handful of markets means dozens of trades per month, each paying fees and crossing the spread. Frequency is the enemy of any signal with a one-tenth-of-a-percent median edge.
Ignoring timeframe. Patterns on a 5-minute chart are mostly microstructure. Patterns on daily and weekly charts are rarer and sit on levels more participants can see. Picking the timeframe after seeing the pattern you like is curve-fitting with extra steps.
No confirmation and no invalidation. "Bullish engulfing, therefore up" is not a plan. Where does the idea stop being valid? Usually the engulfing candle's own extreme, or an ATR multiple beyond it. If you cannot state that level before acting, the pattern is decoration.
Misreading volume. A high-volume engulfing bar in crypto is often a liquidation cascade or a funding-driven flush, not conviction. Aggregate volume cannot distinguish between the two.
Redefining the pattern on the fly. Letting a body "almost" engulf today and requiring strict containment tomorrow destroys any ability to learn from your own records. Write the rule down and keep it fixed long enough to collect data.
Combining it with other tools
The pattern is at its most useful as the last item in a sequence, not the first. A workable order is: regime, level, then candle.
- Trend and regime filter. A 20- or 50-period EMA, or simple structure (higher highs and higher lows), tells you whether counter-trend engulfings are even worth looking at. The pooled numbers improved slightly only when a real prior move against the signal was required.
- Horizontal levels and prior swings. The swing-extreme condition in the test is a crude proxy for "the pattern happened somewhere that matters". Hand-drawn levels, prior range edges and high-volume nodes serve the same purpose with more judgement.
- ATR. Use it twice: to judge whether the candle is large or small for current conditions, and to size the position so that the invalidation level implies a tolerable loss. On leveraged perpetuals, this is where most damage is avoided or done.
- Momentum tools. An RSI divergence or a momentum extreme at the same location gives an independent reason; the candle then supplies the timing and the level. Correlated reasons (two momentum oscillators) add nothing.
- Higher-timeframe alignment. A 4-hour bullish engulfing inside a daily downtrend is a different proposition from the same shape inside a daily uptrend. Checking one timeframe up costs nothing.
- Sibling patterns. Engulfing sits alongside the harami and inside bar, the morning and evening star, three white soldiers and three black crows, tweezers, marubozu and pin bars. They are a shared vocabulary for describing bars, not a set of independent signals — several of them will flag the same bar.
Logging and testing it yourself. Open a spreadsheet with one row per pattern and these columns: date and time, market, timeframe, bullish or bearish, close of the second candle, body size divided by ATR, whether the prior 6 bars moved against the signal by 1.5 ATR, relative volume, whether it printed a 20-bar extreme, and then the close 6 and 12 bars later. Fill it in forward, without skipping the ones that look unconvincing. After 100 or more observations you can compare your hit rate with the simple baseline of picking a random bar — and you will usually learn more from which context columns separate outcomes than from the pattern itself.
Frequently asked questions
Q. What is a bullish engulfing candle pattern?
A bullish engulfing is a two-candle formation in which a bearish candle is followed by a bullish candle whose real body fully covers it: the second candle opens at or below the previous close and closes at or above the previous open. Classic definitions use bodies only and ignore the wicks. Most serious rule sets also require the first body to be a meaningful size — for example at least 0.30 x ATR(14) — so that engulfing a doji does not count.
Q. Is the engulfing candle pattern reliable?
On its own, the evidence here does not support calling it reliable. Across 10,836 engulfing patterns on 4-hour candles from 20 crypto perpetuals (2024-01 to 2026-11), 48.9% closed in the pattern's claimed direction six bars later against a 50.0% baseline, and 50.4% after twelve bars against 50.0%. Academic studies on equities and futures have generally found weak results from candlestick patterns after costs, which is consistent with this.
Q. What timeframe is best for engulfing patterns in crypto?
There is no proven best timeframe, but the trade-off is consistent: lower timeframes produce far more patterns with more noise and proportionally higher costs, while daily and weekly patterns are rarer and sit on levels more participants watch. The 4-hour chart used here produced roughly one pattern every 13 bars per market. Choose a timeframe before you look for patterns, and keep it fixed while you gather data.
Q. Do the wicks have to be engulfed as well?
Not in the classic definition — only the real bodies. When the second candle's entire high-to-low range also covers the previous range, the formation is usually called an outside bar or range engulf, which is a stricter and rarer condition. Both definitions are defensible; what matters is that you pick one, state it, and test that one rather than switching between them.
Q. What is the difference between an engulfing pattern and a harami?
They are geometric opposites. In an engulfing pattern the second body is larger and wraps the first; in a harami the second body is smaller and sits inside the first. The engulfing story is a decisive shift of momentum, while the harami story is a sudden loss of momentum and indecision, which is closer to the inside-bar concept used on Western bar charts.
Q. Does high volume confirm an engulfing candle?
In the pooled test, requiring the second candle's volume to be at least 1.2 times its own 20-bar average, on top of a prior-trend condition, produced 49.8% in the expected direction after six bars and 50.5% after twelve — essentially baseline. Remember also that exchange volume is aggregate turnover, not a buy/sell split: a busy bar can be a liquidation cascade just as easily as accumulation. Treat volume as context, not confirmation.
Key takeaways
- An engulfing pattern is a two-candle body reversal: the second real body fully covers the previous, opposite-coloured body, with a minimum prior-body size (0.30 x ATR here) so that doji do not qualify.
- In crypto's 24/7 markets there are no overnight gaps, so the open sits at the previous close and the classic "gap open" requirement becomes an at-or-beyond condition.
- Across 10,836 pooled cases on 4h crypto perpetuals, the pattern alone produced 48.9% in the expected direction at six bars (baseline 50.0%) and 50.4% at twelve; context conditions shifted this by about one case in a hundred, before any fees, funding or slippage.
- The SOL window illustrated the practical problem: 89 patterns in 1,200 bars, four of them within a single 24-hour chop on 18 October, and 41 of 80 measurable events closing in the claimed direction.
- The honest use of the pattern is as vocabulary and structure — a precise level for invalidation, a timing marker for a reason you already had — rather than as a forecast on its own.
Educational material. Charts use real SOL/USDT perpetual prices; past behaviour does not predict future results. Not investment advice.