Indicator & technique library · Candlestick patterns deep dive
Candlestick Patterns: Full Guide, Rules and Evidence
At a glance
- Candlestick patterns are named shapes made by one, two or three bars that describe how the fight between buyers and sellers resolved inside a period.
- Japanese candle charting was popularised in the West by Steve Nison's 1991 book; the Homma rice-trading origin story is widely repeated but poorly documented.
- In a pooled test on 20 USDT perpetuals and about 125,000 4h candles, 50,510 pattern events closed in the claimed direction 49.7% of the time against a 50.0% baseline.
- Patterns are best treated as vocabulary for price action, location and stop placement — not as standalone signals.
A candlestick pattern is a named shape formed by one, two or three price bars. Each bar already compresses four numbers — open, high, low, close — into a picture of who was in control during that period, and a pattern is simply a recurring arrangement of those pictures that traders have given a label: engulfing, harami, morning star, tweezer, marubozu, pin bar.
Traders care about them because they are the cheapest possible description of order flow you can read off a bare chart, and because they define precise price levels — the extreme of a wick, the edge of a body — that make stop placement objective. They are also the most over-promised tool in retail trading. This page is the hub of our candlestick series: it gives the anatomy, the exact rules we use, and then the measured results of those rules on 20 crypto perpetuals, reported as they came out.
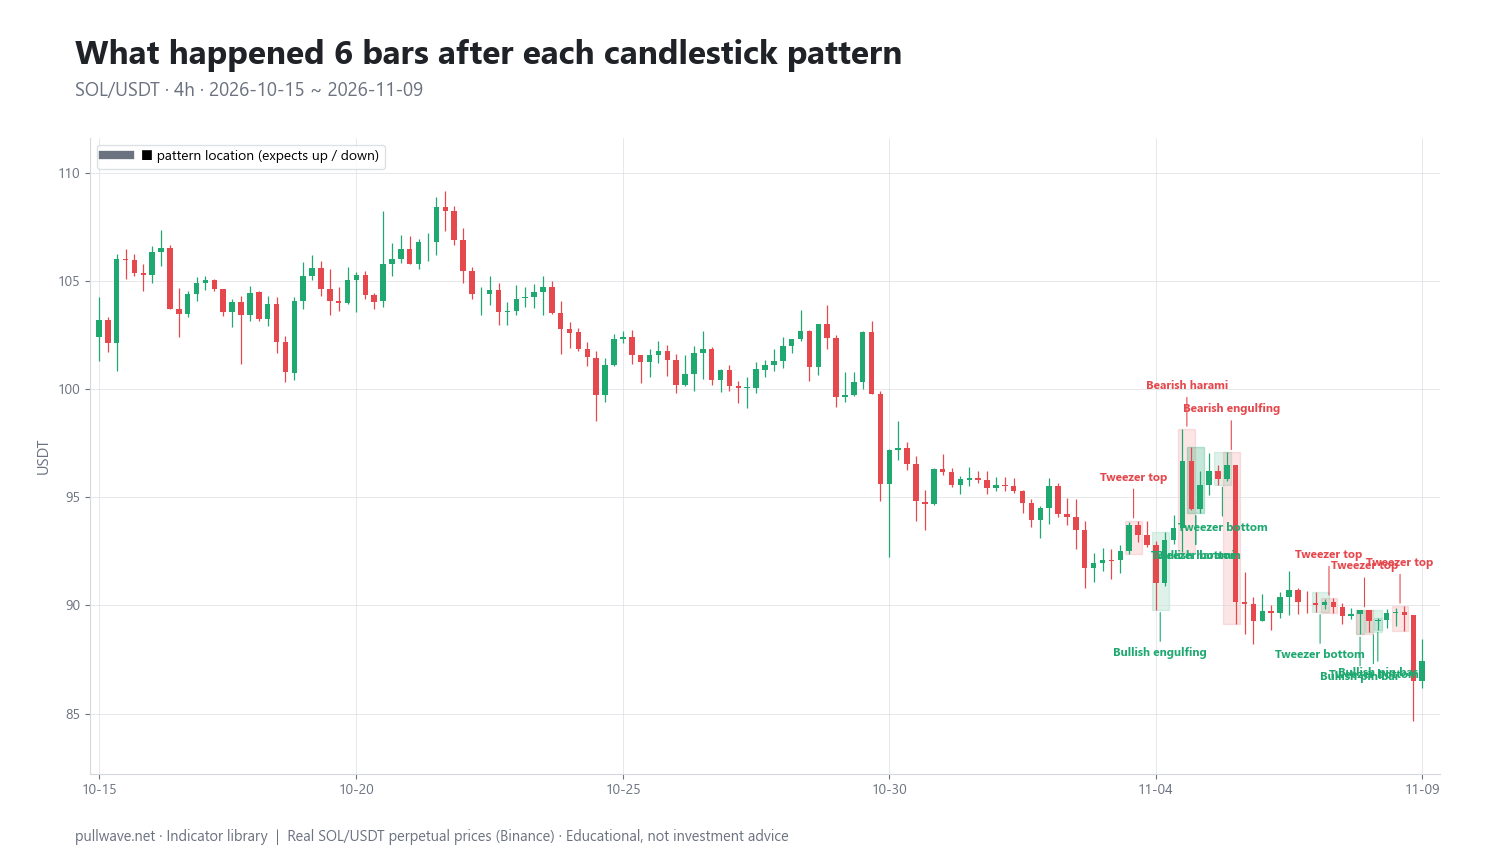
Figure 1 shows SOL/USDT perpetual 4h candles with the most recent pattern occurrences outlined and named — engulfing bars, harami, stars, soldiers and crows, tweezers, marubozu and pin bars. Notice two things immediately: there are a lot of them, and they cluster in choppy areas.
What is Candlestick Patterns: Guide and Evidence?
A candlestick draws the period's range as a thin line (the wick, or shadow) and the distance between open and close as a thick block (the body). If the close is above the open the body is conventionally hollow or green; if below, filled or red. Everything else in candle analysis is built from four measurements:
- Body = |close − open| — how far the period travelled net.
- Upper wick = high − max(open, close) — how far buyers pushed and failed to hold.
- Lower wick = min(open, close) − low — how far sellers pushed and failed to hold.
- Range = high − low — total travel inside the bar.
Patterns are grouped by how many candles they use and by what they claim:
| Family | Members in this series | Claim |
|---|---|---|
| Single candle | Pin bar (hammer, shooting star), doji, marubozu | Rejection, indecision, or one-sided control |
| Two candles | Engulfing, harami / inside bar, tweezer top and bottom | Momentum transfer or stalling |
| Three candles | Morning star, evening star, three white soldiers, three black crows | Reversal or sustained drive |
Most named patterns are reversal patterns: they claim price should turn against the move that preceded them. A few, such as the marubozu and the soldiers/crows sequence, are continuation or momentum patterns: they claim the direction of the pattern itself should persist. That distinction matters for testing, because it defines what "the expected direction" means for each shape.
The idea behind it (theory and history)
The logic is behavioural. A long body with tiny wicks says one side dominated the whole period and the close was accepted at the extreme. A long lower wick with a small body says sellers achieved a lower price and it was rejected before the close. A small body inside a previous large body says the second period could not extend the first — energy went out of the move. Candles do not show buy and sell volume; they show the path of agreed prices, and the pattern is an inference about pressure from that path.
Candle charting comes from Japan, and in the West it was popularised almost single-handedly by Steve Nison with Japanese Candlestick Charting Techniques (1991), followed by Beyond Candlesticks (1994). Nison introduced the vocabulary — doji, harami, marubozu, morning star — that every charting platform now uses. The frequently repeated story that the method was invented by 18th-century rice trader Munehisa Homma is popular but poorly documented; the candle chart in its modern form appears to be considerably later, and you should treat the romantic origin tale as folklore rather than history.
The academic record is less flattering than the folklore. Studies on equities and futures have generally found weak or no profitable predictive power from candlestick patterns once transaction costs are included. The best known is Marshall, Young and Rose, "Candlestick technical trading strategies: Can they create value for investors?", Journal of Banking & Finance (2006), which tested a large set of candlestick rules on Dow Jones stocks and found no value. Fock, Klein and Zwergel (2005) reached a similarly negative conclusion on intraday futures data. That does not make candles useless — it means they are a descriptive language, not a forecasting machine, and the evidence section below is consistent with that.
How it is calculated
There is no indicator formula here: a candle is just OHLC data. What has to be defined precisely is detection — the rule that decides whether a given arrangement of bars counts as a pattern — and evaluation — the rule that decides whether the pattern "worked".
Step by step, detection works like this. First, compute the four measurements for each bar. Second, normalise by volatility, because a 2-dollar body means something different on BTC and on DOGE: in this series we use a 14-period Wilder ATR measured on the bar before the pattern starts, so the yardstick is not contaminated by the pattern itself. Third, apply the shape rule. Fourth, record the context in which the shape appeared.
``` body = abs(close - open) upper = high - max(open, close) lower = min(open, close) - low range = high - low ATR = Wilder ATR(14), taken on the bar before the pattern's first candle
Bullish engulfing : candle1 red, candle2 green, body2 fully covers body1 Harami : body2 fully inside body1, opposite colour Tweezer bottom : lows of two adjacent candles equal within a small tolerance expressed as a fraction of ATR Pin bar (bullish) : lower >= k * body and lower >= most of range, upper small Marubozu : body >= most of range (wicks negligible) and body large relative to ATR Morning star : long red, small-bodied middle candle, long green closing well into the first body Three white soldiers : three consecutive green candles, each closing higher, each opening inside the previous body ```
Evaluation is deliberately mechanical. The expected direction is the direction the pattern claims: for reversal patterns, against the prior move; for a marubozu, the direction of its own colour. The outcome is the close a fixed number of bars after the pattern's last candle, compared with that candle's close. The baseline is the same share measured when any bar in the window is picked, weighted by how many up-expecting and down-expecting cases there were — on 4h crypto data that baseline sits very close to 50%. The median move reported later is direction-adjusted, so a positive number means price moved the way the pattern claimed.
Two different horizons appear on this page, and it is worth separating them before you read the tables. The pooled statistics across 20 perpetuals are measured at 6 bars and 12 bars after the pattern's last candle. The labelled events on the SOL chart are measured at 6 bars and 18 bars, because that example was generated with a longer second horizon. Six bars is one day on a 4h chart; 12 bars is two days; 18 bars is three. They are not the same measurement, so do not compare the SOL "+18 bars" column with the pooled "12 bars" column.
Three context flags are recorded alongside every event, because the sibling page on trend and volume context uses them:
- Trend: for reversal patterns, the 6 bars before the pattern's first candle moved against the expected direction by at least 1.5 × ATR (for a marubozu, the close is on the same side of a rising or falling 20-EMA).
- Volume: relative volume of the last candle — its volume divided by its own 20-bar average — is at least 1.2.
- Swing: the pattern made the lowest low (or highest high) of the previous 20 bars; for a marubozu, a close beyond the previous 20-bar range.
One honesty note on volume: exchange OHLCV volume is a single aggregate number per bar, not a buy/sell split. Relative volume only tells you a bar was busier than its recent average. It says nothing about who was buying.
Default settings and variations
| Parameter | Value used here | Why |
|---|---|---|
| Timeframe | 4h candles | Enough bars for statistics, long enough to filter microstructure noise |
| Volatility yardstick | Wilder ATR(14), prior bar | Standard ATR length; measured before the pattern to avoid contamination |
| Pooled outcome horizons | 6 bars and 12 bars | One day and two days on a 4h chart (used for all pooled statistics) |
| SOL chart event horizons | 6 bars and 18 bars | One day and three days (used only for the labelled events in the example) |
| Relative volume threshold | 1.2 × 20-bar average | A mild "busier than usual" filter, not an extreme one |
| Prior-move threshold | 1.5 × ATR over 6 bars | Ensures there is actually a move to reverse |
| Swing lookback | 20 bars | A short-term extreme, not a cycle high or low |
Every one of these is arbitrary. Loosen the tweezer tolerance and the count explodes; tighten the pin-bar wick ratio and it collapses. Common variations you will meet in other sources: requiring the engulfing candle to engulf the whole previous range rather than just the body; requiring the harami's second candle to be a doji (a harami cross); requiring a morning star's middle candle to gap away from its neighbours.
That last one matters in crypto. Classic three-candle star definitions were written for markets that close overnight and reopen with a gap. Crypto trades 24/7, so the open of each candle sits essentially at the previous close and true gaps barely exist. In this series the gap requirement is replaced by a body-separation condition — otherwise morning and evening stars would almost never be detected at all. Timeframe choice has a second crypto quirk: there is no official daily close, so a chart set to UTC and a chart set to New York time will produce different daily candles, and therefore different patterns, from identical price data.
How to read it
Read a candle in three layers: where the close is inside the range, how big the range is relative to recent ATR, and where the whole thing sits in the chart.
- Close position. A close in the top fifth of the range means buyers held the gains into the close; a close in the middle means neither side resolved anything.
- Relative size. A body of 0.3 × ATR is noise. A body of 2 × ATR is an event. The same shape at two different sizes is not the same information.
- Location. An identical bullish pin bar is a different animal at the low of a 20-bar range than it is in the middle of a sideways drift. Location is doing more work than shape.
A short checklist you can apply to any candle or pattern before you draw a conclusion:
| Check | Question | Why it matters |
|---|---|---|
| Size | Is the pattern's range at least ~1 ATR? | Sub-ATR shapes are mostly noise |
| Location | Is it at a 20-bar extreme or a tested level? | Context carries more weight than shape |
| Prior move | Was there a real move to reverse (≥ 1.5 × ATR)? | A reversal needs something to reverse |
| Participation | Is relative volume ≥ 1.2 × its 20-bar average? | Only says the bar was busy, not who traded |
| Invalidation | Where exactly does the idea stop being valid? | The wick or body edge gives a concrete level |
| Frequency | How often does this shape appear here? | 199 tweezers in 1,200 bars is not a rare signal |
The practical reading of the common shapes: engulfing = the second period erased and exceeded the first period's net move; harami/inside bar = the second period could not leave the first period's body, so range is contracting; tweezer = two adjacent candles stalled at the same price, marking a level that was tested twice; marubozu = one side controlled open to close; pin bar = a push that was fully rejected inside the period; star = a drive, a pause, then a drive the other way. None of these is a forecast. Each is a compact statement about what already happened.
How traders use it
1. As a timing trigger inside an existing thesis. The thesis comes from somewhere else — a trend, a level, a higher-timeframe structure — and the candle decides when and where risk is defined. This works best in a clean trend on a pullback to a prior level, because the pattern only has to confirm something already supported by context. It fails in chop, where every third bar produces a shape and the "triggers" simply alternate.
2. For stop placement and risk sizing. A pin bar's wick extreme or an engulfing bar's low gives a non-arbitrary invalidation point, and ATR tells you whether that distance is affordable at your position size. This is arguably the most durable use of candles and it does not require the pattern to predict anything. The failure mode is placing the stop one tick beyond an obvious wick that thousands of others also see — in leveraged crypto, liquidity clusters there and gets swept.
3. For reading exhaustion at swing extremes. A long rejection wick at a 20-bar extreme on relative volume above its average is a legitimate observation: a lot of activity happened at a price that was not accepted. It works when the prior move was extended and one-sided; it fails during liquidation cascades, where a huge wick is a mechanical artifact of forced closures rather than a considered rejection, and price often continues after a pause.
4. As a journaling vocabulary. Logging "inside bar after a 2-ATR drive into the prior high" makes your own history searchable and testable. This is how you find out whether a pattern does anything in your market, on your timeframe, with your rules — and it is the only route to a personal answer rather than a borrowed one.
To test one yourself: pick a single pattern and a single market, write the detection rule in one sentence, scroll back 300 bars, mark every occurrence without skipping any, and record the close 6 and 12 bars later against the pattern's claim. Fifty unfiltered cases will teach you more than fifty curated screenshots.
Example on a real SOL chart
The chart in Figure 1 is SOL/USDT perpetual on Binance, 4h candles, from 2026-04-23 to 2026-11-09 — 1,200 bars — with a last close of 87.44. Within that window the detector found 199 tweezers, 89 engulfing patterns, 83 pin bars, 47 harami, 14 stars, 11 marubozu and 1 soldiers/crows sequence. That distribution is itself a lesson: the shapes you read about most are not the shapes that occur most.
Sixty labelled events fall in the window. Measured at the 6-bar horizon, 30 of 60 closed in the signal's direction — exactly half. Here are the last ten, with the raw percentage change in price 6 bars and 18 bars after the pattern's final candle (positive = price rose, regardless of what the pattern claimed):
| Date (UTC) | Pattern | Price | +6 bars | +18 bars |
|---|---|---|---|---|
| 2026-11-04 20:00 | Tweezer bottom | 95.55 | −6.54% | −6.05% |
| 2026-11-05 08:00 | Tweezer bottom | 96.48 | −6.32% | −7.07% |
| 2026-11-05 12:00 | Bearish engulfing | 90.16 | +0.60% | −0.52% |
| 2026-11-07 04:00 | Tweezer bottom | 90.18 | −0.96% | −3.04% |
| 2026-11-07 08:00 | Tweezer top | 89.93 | −0.30% | −2.77% |
| 2026-11-07 20:00 | Bullish pin bar | 89.77 | −3.64% | −2.60% |
| 2026-11-08 00:00 | Tweezer top | 89.28 | −2.06% | −2.06% |
| 2026-11-08 04:00 | Tweezer bottom | 89.31 | −2.09% | −2.09% |
| 2026-11-08 04:00 | Bullish pin bar | 89.31 | −2.09% | −2.09% |
| 2026-11-08 16:00 | Tweezer top | 89.54 | −2.35% | −2.35% |
Read this cluster honestly. SOL was falling through early November, and in a falling market the bullish patterns — four tweezer bottoms and two pin bars — were followed by further declines, while the bearish tweezer tops were "right" for the trivial reason that the market kept going down. The two bullish signals on 2026-11-04 and 11-05 were followed by moves of −6.54% and −6.32% at six bars. Several of the later rows show identical 6-bar and 18-bar numbers because the measurement window runs into the end of the data at 87.44 — another reason not to read much into the last few events. Overlapping detections at the same timestamp (the pin bar and tweezer bottom at 11-08 04:00) are counted separately and are not independent observations.
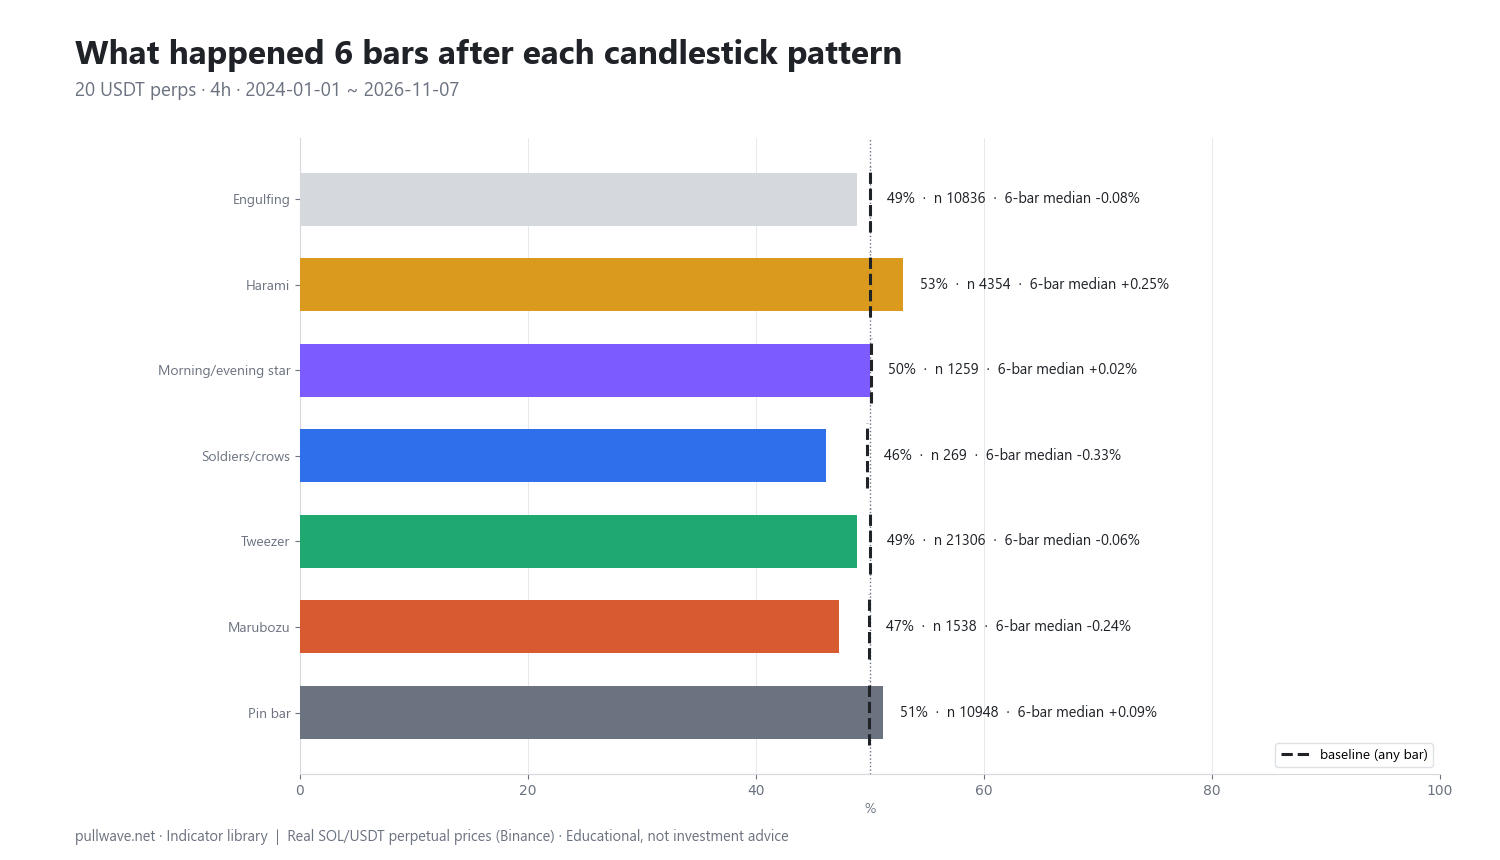
Figure 2 widens the lens. To get sample sizes worth discussing, the same rules were run over 20 liquid USDT-margined perpetuals — BTC, ETH, SOL, BNB, XRP, DOGE, ADA, AVAX, LINK, DOT, LTC, TRX, ATOM, NEAR, APT, ARB, OP, SUI, INJ, FIL — on 4h candles from 2024-01-01 to 2026-11-07, about 124,920 candles. The bars show, for each family, the share of cases that closed in the expected direction 6 bars later, with the any-bar baseline as a dashed line. These pooled columns use the 6-bar and 12-bar horizons, not the 18-bar horizon from the SOL table above.
| Pattern family | Cases (n) | Expected direction, 6 bars | Baseline | Median 6-bar move | 12 bars | Baseline |
|---|---|---|---|---|---|---|
| Engulfing | 10,836 | 48.9% | 50.0% | −0.08% | 50.4% | 50.0% |
| Harami | 4,354 | 52.9% | 50.0% | +0.25% | 50.9% | 50.0% |
| Morning/evening star | 1,259 | 50.0% | 50.1% | +0.02% | 49.6% | 50.1% |
| Soldiers / crows | 269 | 46.1% | 49.7% | −0.33% | 46.8% | 49.7% |
| Tweezer | 21,306 | 48.9% | 50.0% | −0.06% | 49.2% | 50.1% |
| Marubozu | 1,538 | 47.3% | 49.9% | −0.24% | 47.6% | 49.9% |
| Pin bar | 10,948 | 51.1% | 49.9% | +0.09% | 50.7% | 49.9% |
| All patterns | 50,510 | 49.7% | 50.0% | −0.01% | — | — |
Across all 50,510 events the share is 49.7% against a 50.0% baseline, with a median direction-adjusted move of −0.01%. No family clearly beats the baseline when used alone. Harami is the one visible positive (52.9%, median +0.25%); with n = 4,354 the naive standard error of a proportion is about 0.76 percentage points, which would make that look significant — but the naive number is wrong, because pattern events overlap in time and the 20 assets are highly correlated, so the effective sample is far smaller than n suggests. The tilt also decays to 50.9% by 12 bars. Soldiers/crows at 46.1% looks bad, but with n = 269 the standard error is about 3 points, so that is noise.
What this does not mean: it does not mean candles are meaningless, that these rules are the only reasonable ones, or that a discretionary trader reading context does the same thing as a mechanical detector. What it does mean: a bare pattern, taken without context, on 4h crypto data, with these thresholds, gave no measurable directional edge — and fees, slippage and perpetual funding are not even included. Change the timeframe, the market or a ratio and the numbers move. This is one illustration on one data set, not proof in either direction.
Common mistakes
- Hindsight. Every textbook example is chosen after the outcome is known. Scroll a live chart and you will find the same shape at tops, bottoms and in the middle of nothing. The counts above — 199 tweezers in 1,200 SOL bars — are the honest picture.
- Trading every occurrence. High-frequency shapes like tweezers and inside bars appear constantly in chop. Without a location or context filter you are paying spread and funding to sample noise.
- Ignoring the timeframe and the clock. A pattern on the 5-minute chart is a different statistical object from the same pattern on the daily, and because crypto has no official close, your chart's timezone setting changes which patterns exist at all.
- Comparing different horizons. The SOL events were measured at 6 and 18 bars, the pooled study at 6 and 12. Mixing horizons is one of the easiest ways to fool yourself about how durable a result is.
- Demanding no confirmation. Acting on the shape at the exact moment it completes removes the cheapest filter available: waiting for the next bar to hold or reject the level.
- Treating a long wick as information in a cascade. In leveraged perpetual markets, forced liquidations print enormous wicks that reflect a thin book, not a change of mind.
- Counting overlapping signals as independent evidence. Two detectors firing on the same bar is one event, not two confirmations.
Combining it with other tools
Candles are most useful when something else has already answered "where" and "which way", and the candle only answers "when" and "how much risk".
- Trend filters (a 20- or 50-period moving average, or higher-timeframe structure) narrow patterns to the direction with the wind behind it and filter out counter-trend reversal shapes in strong moves.
- Horizontal levels and prior swing extremes supply the location. A rejection wick at a twice-tested level is a different observation from one in open space.
- ATR turns every pattern into a sized decision: is the distance to the invalidation point one quarter of an ATR or three ATRs?
- Relative volume adds the "was anyone there" dimension — with the caveat that aggregate volume cannot tell you who was buying.
- Momentum oscillators such as RSI can flag when a reversal shape appears after an extended one-sided run, which is precisely the condition the prior-trend flag tries to capture.
For the specific shapes, the sibling pages in this series go deeper, each with its own pooled numbers: engulfing patterns; harami and inside bars; morning and evening stars; three white soldiers and three black crows; tweezer tops and bottoms; the marubozu; pin bars; and patterns with trend and volume context. They build on the basics covered in reading a single candle, the doji, and the hammer and shooting star.
Frequently asked questions
Q. Do candlestick patterns actually work in crypto?
In the pooled test described above — 20 USDT perpetuals, about 125,000 4h candles, 50,510 pattern events — price closed in the pattern's claimed direction 49.7% of the time versus a 50.0% baseline, with a median move of −0.01% six bars later. On that evidence, bare patterns on 4h crypto data showed no directional edge before costs. They remain useful as a description of price action and as a way to define invalidation levels.
Q. What is the most reliable candlestick pattern?
In this test no family clearly beat the baseline alone. Harami scored highest at 52.9% over 6 bars against 50.0% (n = 4,354), and pin bars 51.1% against 49.9% (n = 10,948), but both tilts shrink by 12 bars and the effective sample is smaller than the raw counts because events overlap and crypto assets move together. Treat "most reliable" claims — including this one — as hypotheses to test on your own data.
Q. What timeframe is best for candlestick patterns in crypto?
Higher timeframes (4h and above) produce fewer, larger patterns and less microstructure noise, which is why this study used 4h. Because crypto trades 24/7 with no official close, daily candles depend on your chart's timezone, so pick one convention and stay with it. Whatever you choose, statistics from one timeframe do not transfer to another.
Q. Do candlestick patterns need volume confirmation?
Volume is worth recording — in this series a bar is flagged when its volume is at least 1.2 times its own 20-bar average — but be clear about what it tells you. Exchange OHLCV volume is a single aggregate figure, not a buy/sell split, so relative volume only says the bar was busier than usual. It adds context about participation, not about direction.
Q. How many candlestick patterns should I learn?
Few. Understanding candle anatomy — body, wicks, close position, size relative to ATR — covers most of what the named patterns encode, and three or four shapes you can define in one sentence each are more useful than a chart of fifty. Depth of definition and consistent logging beat breadth of vocabulary.
Q. Why do classic patterns like the morning star behave differently in crypto?
Many three-candle definitions were written for markets that close overnight and reopen with a gap, and 24/7 crypto almost never gaps: each candle opens essentially at the previous close. Detectors therefore replace the gap requirement with a body-separation rule, which changes both how often the pattern is found and what it means. Perpetual funding and liquidation cascades also produce large wicks for mechanical reasons.
Key takeaways
- A candlestick pattern is a named arrangement of bodies and wicks; its value is as a compact description of who was in control, not as a forecast.
- Japanese candle charting was popularised in the West by Steve Nison's 1991 book; the Homma rice-trading origin story is poorly documented, and academic work on equities and futures has generally found weak results after costs.
- In a pooled test of 50,510 events across 20 perpetuals on 4h candles, patterns closed in the expected direction 49.7% of the time against a 50.0% baseline — no family clearly beat chance on its own.
- Definitions and horizons are arbitrary: the pooled study used 6 and 12 bars, the SOL example 6 and 18, and changing a wick ratio, a tolerance or the timeframe changes both the counts and the results.
- Used sensibly, patterns earn their place through location, confirmation and risk definition — they tell you where you are wrong, which is worth more than telling you where price is going.
Educational material. Charts use real SOL/USDT perpetual prices; past behaviour does not predict future results. Not investment advice.