Indicator & technique library · Smart money deep dive
Sweep, CHoCH and Entry: The SMC Entry Model Explained
At a glance
- The sweep → CHoCH → entry setup is the standard smart money concepts sequence: price takes out a swing level, then breaks structure the other way, and the trade is placed in the imbalance or order block left behind by that break.
- The stop normally sits beyond the sweep's extreme wick, which makes invalidation objective and lets you express targets in R multiples.
- Mechanized on SOL/USDT 1h over roughly seven months, 219 sweeps produced 57 sequences with a valid zone, 51 triggered entries, and 20 of 48 resolved trades (41.7%) reached a 2R target first.
- That sits above the 33.3% break-even share for a 2R target before fees, funding and slippage — one market, one window, one arbitrary parameter set, and not evidence of an edge.
The sweep, CHoCH and entry setup is the sequence most smart money concepts (SMC) traders have in mind when they say "entry model." Price pushes beyond an obvious swing high or low, closes back inside, then reverses hard enough to break the opposite side of the recent swing structure on a closing basis. The trade is then placed on the pullback into the imbalance or order block created by that break, with the stop beyond the extreme of the sweep wick.
Traders care about it because, unlike most chart patterns, it packages four decisions into one repeatable sequence: direction, entry location, invalidation and target. That structure is genuinely useful for risk discipline. It is also the most over-sold pattern on the internet, so this page does two things: state the rules precisely, and then show what happens when they are turned into mechanical code and run on real data.
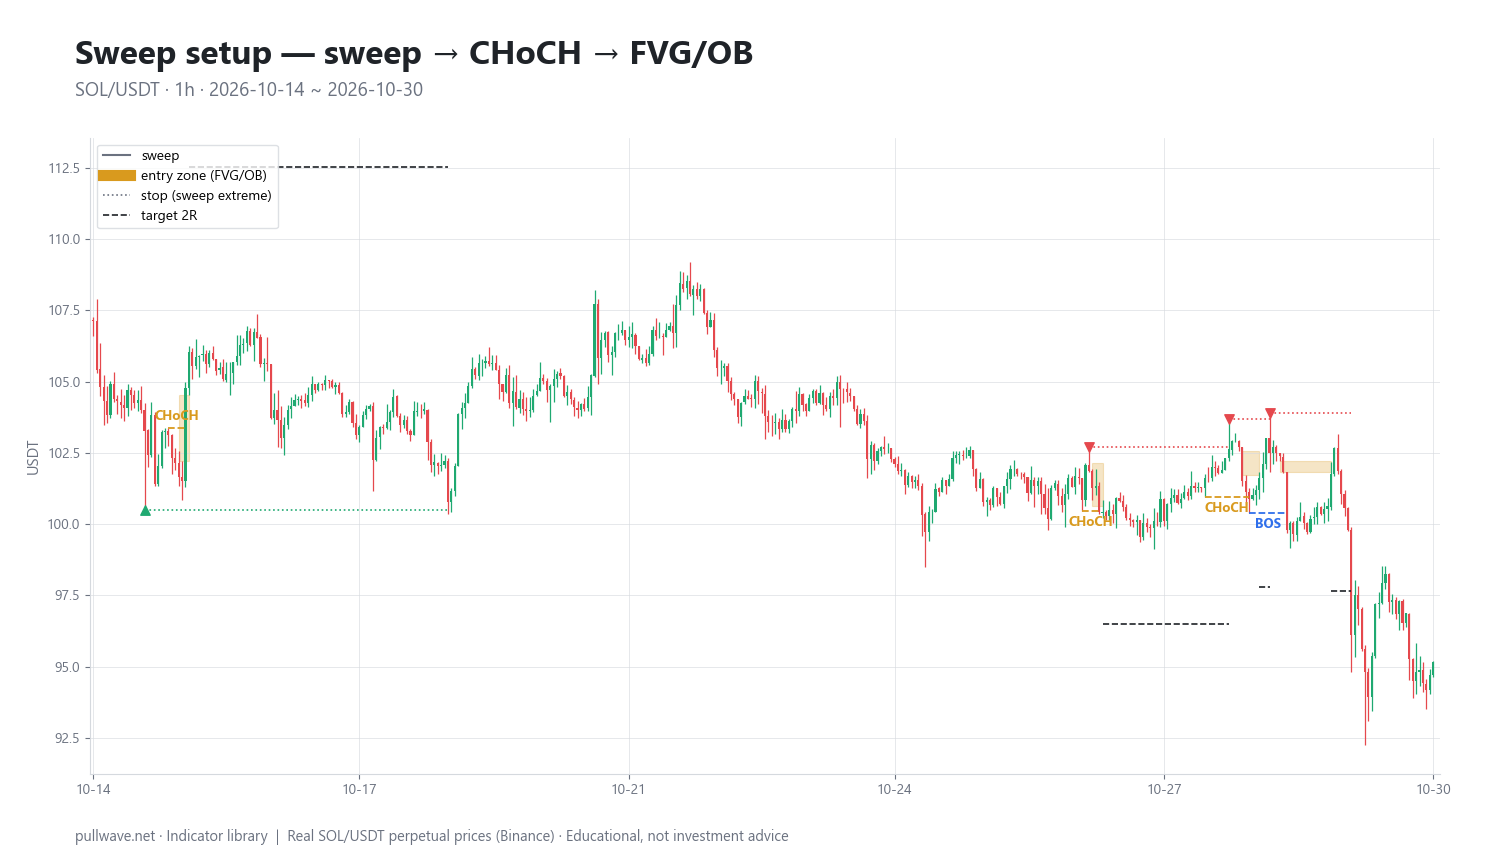
Figure 1 shows four recent setups on SOL/USDT 1h candles. On each one you can see the sweep marker where price poked through a prior swing level, the bar where structure broke in the opposite direction, the entry zone (a fair value gap or, when none formed, an order block) drawn as a gold box, the stop level at the sweep's extreme as a dotted line, and the 2R target as a dashed line.
What is the sweep, CHoCH and entry setup?
It is a three-stage sequence, not a single signal:
- The sweep. A wick trades beyond an unbroken prior swing high or low — a level where resting stop orders and breakout orders are assumed to sit — and the same candle closes back inside the old range. Proponents call this "taking liquidity"; older literature would call it a failed breakout, a Wyckoff spring (below support) or upthrust (above resistance).
- The CHoCH. "Change of character" is the first closing break of the swing structure in the opposite direction to the preceding leg. After a sweep of a low in a downtrend, a close above the most recent minor swing high is the CHoCH. It is the evidence, in the framework's terms, that the sweep was not just noise inside the trend.
- The entry. Rather than chasing the break, the trader waits for price to retrace into the inefficiency the break left behind: the first fair value gap (FVG) formed between the sweep and the break, or, if there is none, the order block that produced the break. Stop goes beyond the sweep's wick; the target is usually a fixed multiple of that risk or the next opposing liquidity pool.
Vocabulary varies by teacher. In material derived from ICT, the same break is more often called a market structure shift (MSS); in the broader SMC community, CHoCH is standard, and BOS (break of structure) is reserved for a continuation break in the direction of the existing trend. Some traders use CHoCH and MSS interchangeably. Before you copy anyone's rules, check which definition they are using.
The idea behind it (theory and history)
The modern packaging comes from online trading education rather than from books or journals. The ICT material published by Michael J. Huddleston ("Inner Circle Trader") has circulated in free video form since roughly the mid-2010s, and a wider community vocabulary — order blocks, fair value gaps, liquidity sweeps, CHoCH, premium and discount — spread from there across YouTube, Discord and social media. Precise first-use dates for individual terms are not well documented, so treat any confident origin story with caution.
The narrative attached to the pattern is that large institutional participants need resting liquidity to fill size, so price is deliberately driven into clusters of stops above highs and below lows before the real move begins. This is the framework's hypothesis about order flow. There is no peer-reviewed or independent evidence that "smart money" engineers these moves as described, and no public dataset ties these chart shapes to institutional order flow. The pattern can be useful as a description of price behaviour without the story being true.
What is well documented is that each component has an older ancestor:
- Swing structure (higher highs/higher lows, and the significance of their failure) comes from Dow theory, as compiled by writers such as William Hamilton and Robert Rhea in the first decades of the 20th century.
- Springs and upthrusts — a break beyond support or resistance that immediately reverses — are core to Richard D. Wyckoff's method, also early 20th century.
- Gaps and imbalances have been studied in technical analysis for a century; an FVG is simply a three-bar gap in traded range.
- Order blocks are, functionally, a refined support/resistance zone chosen by the candle that preceded a strong move.
- Premium/discount and the "optimal trade entry" are Fibonacci retracement levels with new labels.
So the sequence is best understood as a disciplined restatement of failed-breakout-plus-structure-break trading, with strict rules about where to enter and where invalidation sits. That restatement has value. The claim that it reveals institutional intent does not follow from it.
How it is calculated
Normally this setup is discretionary — a human decides which swing matters. To study it honestly you have to mechanize it, which is exactly what the example later on this page does. Here is the full rule set in plain words:
- Find swing levels. Mark fractal-5 swing highs and lows: a bar whose high is the highest of the two bars either side (or whose low is the lowest). Keep only levels that have not yet been closed through.
- Detect the sweep. A bullish sweep is a bar whose low trades below an unbroken swing low while the same bar closes back above that level. A bearish sweep is the mirror image above a swing high. The close-back-inside condition is what separates a sweep from a genuine breakout.
- Wait for the CHoCH. Within the next 12 bars, require a close beyond the nearest opposite minor swing (fractal-3, i.e. one bar either side) in the direction implied by the sweep: a close above the minor swing high after a bullish sweep, below the minor swing low after a bearish one. No close, no setup.
- Define the entry zone. Take the first same-direction fair value gap created between the sweep bar and the break bar. A bullish FVG exists where the low of bar j+1 is above the high of bar j−1. If no FVG formed, fall back to the order block of the break: the last opposite-colour candle before the impulse that broke structure.
- Place the entry. A limit order at the zone's near (proximal) edge — the boundary price will touch first on the pullback. If that edge is not touched within 30 bars, the setup expires untriggered.
- Place the stop and target. Stop at the extreme of the sweep wick. Risk = distance from entry to stop. Target = entry ± 2 × risk.
- Resolve. Whichever level is touched first decides the outcome. If a single bar touches both, it counts as the stop (the pessimistic assumption). If neither is touched within 80 bars, the trade is recorded as unresolved.
``` swing_high[i] = high[i] == max(high[i-2 .. i+2]) # fractal-5 swing_low[i] = low[i] == min(low[i-2 .. i+2])
bull_sweep[t] = low[t] < swing_low_level and close[t] > swing_low_level bear_sweep[t] = high[t] > swing_high_level and close[t] < swing_high_level
choch_up[k] = close[k] > last_minor_swing_high # k - t <= 12 choch_down[k] = close[k] < last_minor_swing_low
bull_FVG[j] = low[j+1] > high[j-1] -> zone = [high[j-1], low[j+1]] entry_long = low[j+1] # proximal edge stop_long = low[sweep_bar] risk = entry_long - stop_long target_long = entry_long + 2 * risk ```
Default settings and variations
Every number above is a choice, not a law. These are the defaults used in the test on this page and the reasons behind them.
| Parameter | Default here | Why | Common variation |
|---|---|---|---|
| Swing definition for the sweep | Fractal-5 | Filters out micro-wiggles so the swept level is visually obvious | Fractal-3 (more setups, more noise); session or daily high/low |
| Swing definition for the CHoCH | Fractal-3 | The confirming break should be allowed to be small and fast | Fractal-5 (fewer, larger breaks) |
| Sweep → break window | 12 bars | A reversal that takes much longer is a new trade, not a reaction | 5–10 bars (stricter), 20+ (looser) |
| Entry zone | First same-direction FVG, else order block | The imbalance is the freshest unfilled price area in the impulse | Order block only; FVG 50% (consequent encroachment); breaker block |
| Entry price | Near edge of the zone | Highest fill rate, worst average price | Zone midpoint; far edge (better price, lower fill rate) |
| Entry validity | 30 bars | A pullback that takes longer usually means momentum died | 10–20 bars on lower timeframes |
| Stop | Sweep extreme | Beyond that wick, the premise is simply wrong | Sweep extreme + a fraction of ATR as buffer |
| Target | 2 × risk | Fixed R makes results comparable across trades | 1R partial then runner; opposing liquidity pool; trailing stop |
| Timeout | 80 bars | Prevents a trade sitting open forever | 40–120 bars |
Discretionary filters that many traders add: a higher-timeframe directional bias (only longs while the 4h structure is bullish), a requirement that the break be accompanied by displacement (an unusually large candle), a preference for sweeps of equal highs or lows, and a requirement that the entry sits in the discount half of the leg for longs. Each filter reduces trade count. Each one also adds a parameter you can overfit.
Time-of-day filters ("kill zones") deserve a crypto caveat: they were designed for markets with fixed sessions and overnight gaps. Crypto trades continuously, so there is no gap and no official close, and session windows mean less than they do in futures on equity indices.
How to read it
Work left to right and refuse to skip a step. Marking the chart after the fact is where most of the self-deception happens.
- Mark the last few unbroken swing highs and lows. Prefer levels that are obvious: double tops, equal lows, the high of a multi-day range.
- Wait for a bar to wick through one of them and close back inside. Note the extreme of that wick — that is your future stop level, and it is fixed from this moment.
- Identify the nearest opposite minor swing. Mark it. This is the CHoCH trigger, and you mark it before the break, not after.
- If a candle closes beyond that trigger within your window, scan the impulse from the sweep to the break for a three-bar gap. Draw the first same-direction FVG as a box. If there is none, use the last opposite-colour candle before the impulse.
- Measure: near edge of the zone to the sweep extreme is your risk. Project 2R the other way. If the 2R target sits inside a wall of obvious opposing structure, the setup is poorly located even if every rule is met.
Pre-trade checklist
| Check | Pass condition |
|---|---|
| Swept level was unbroken and visible | Yes/No |
| Sweep bar closed back inside the range | Yes/No |
| Structure break was a close, not a wick | Yes/No |
| Break happened within the time window | Yes/No |
| A zone exists between sweep and break | FVG, else order block |
| Risk distance acceptable in % terms | Compare to recent ATR |
| 2R target has room before major structure | Yes/No |
| Risk per trade fixed before entry | Yes/No |
How traders use it
1. Reversal entries at range extremes. The classic application: price runs the high of a multi-day range, fails, breaks structure down, and the trader works a limit order into the FVG left by the break. Works when the market is rotating inside a defined range with clear liquidity on both sides. Fails in strong trends, where the "sweep" is simply the trend continuing and the structure break is a one-bar pullback.
2. Continuation entries inside a trend. In an uptrend, a pullback sweeps a minor low, then structure breaks back up. Many traders argue that trend-aligned versions of the sequence are the more reliable ones because the trade sits with the dominant leg rather than against it — a reasonable belief, but not something the data on this page or any independent study establishes. Works when a higher-timeframe trend is intact. Fails at the end of extended trends, where the last pullback sweep turns into the actual reversal.
3. As a location filter rather than a signal. Many discretionary traders already have a directional bias from elsewhere — higher-timeframe structure, funding, a macro view — and use the sweep→CHoCH sequence only to decide where to enter and where invalidation sits. This is arguably the most defensible use: the pattern contributes trade location, not prediction. Fails when the bias itself is wrong; good entry mechanics do not rescue a bad premise.
4. As an invalidation framework. Even if you never trade the model, the sweep wick is a clean, non-arbitrary stop level, and expressing results in R multiples makes a journal comparable across markets and timeframes. Fails when volatility makes the sweep wick so far away that the required stop is larger than your risk budget — a common problem on crypto's violent candles.
Example on a real SOL chart
The rules above were coded exactly as written and run on SOL/USDT perpetual (Binance), 1h candles, from 2026-04-14 to 2026-11-09, a window that ended with price at 86.57. Everything ran on the 1h chart alone, with no higher-timeframe bias filter and no discretionary selection. This is counting only: no position sizing, no fees, no funding, no compounding.
The funnel matters as much as the result:
- 219 sweeps met the wick-beyond-and-close-back-inside condition.
- 57 sequences produced a confirmed structure break within 12 bars and a usable entry zone — about one in four sweeps.
- 51 entries triggered (price touched the zone's near edge within 30 bars).
- 20 reached the 2R target first, 28 hit the stop first, 3 were unresolved after 80 bars.
That is 41.7% target-first among the 48 resolved trades. The break-even share for a 2R target is 33.3% (one winner at +2R pays for two losers at −1R). The median stop distance was 1.54%, meaning a typical target sat roughly 3% away — modest moves by SOL standards, which is part of why they resolved reasonably often.
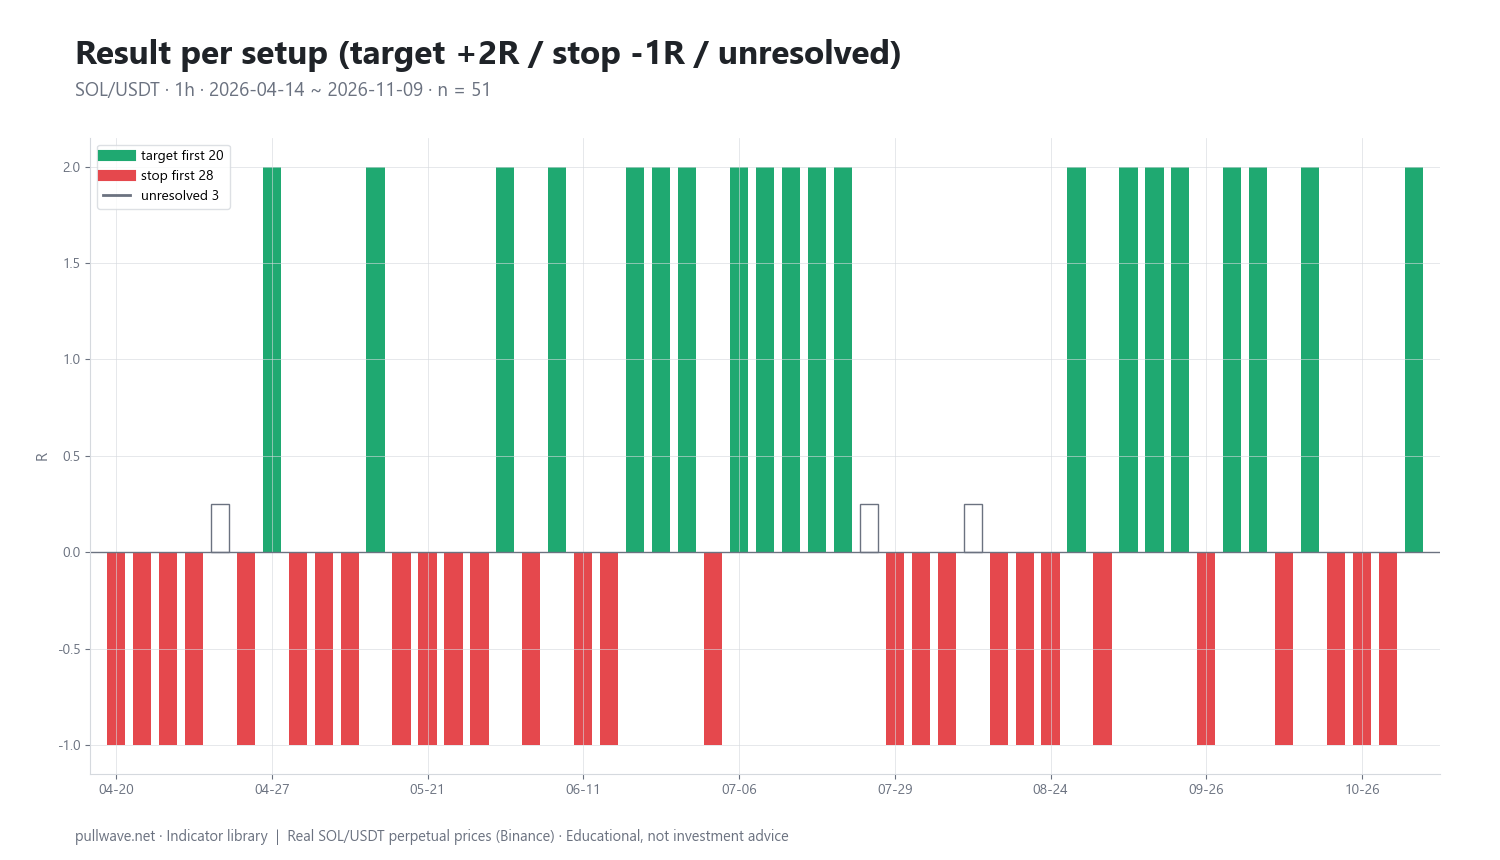
Figure 2 plots one bar per triggered setup in time order: +2R when the target came first, −1R when the stop came first, and a small hollow bar for the three unresolved cases. The visual point is the clustering — winners and losers arrive in runs, not in a tidy alternation, which is what a sequence of a few dozen trades normally looks like.
Ten of the 51 setups, with the raw price change 6 bars and 18 bars after the entry (positive = price went up):
| Date (UTC) | Setup | Entry | Result | +6 bars | +18 bars |
|---|---|---|---|---|---|
| 2026-09-16 23:00 | long | 98.62 | target first | +0.88% | +2.91% |
| 2026-09-26 04:00 | short | 120.61 | stop first | −0.02% | +0.39% |
| 2026-10-02 18:00 | long | 118.07 | target first | +0.75% | +1.14% |
| 2026-10-05 04:00 | short | 120.44 | target first | +0.13% | +0.42% |
| 2026-10-06 14:00 | long | 121.71 | stop first | −0.62% | −2.92% |
| 2026-10-14 10:00 | short | 107.15 | target first | −2.07% | −3.11% |
| 2026-10-15 15:00 | long | 106.04 | stop first | −0.05% | +0.22% |
| 2026-10-26 19:00 | short | 100.43 | stop first | +0.18% | −0.33% |
| 2026-10-28 17:00 | short | 101.63 | stop first | +0.74% | −1.27% |
| 2026-10-29 14:00 | short | 101.75 | target first | −5.55% | −4.34% |
Two things in that table are worth reading carefully. First, the fixed-horizon columns do not decide outcomes: the 2026-10-05 short was target-first even though price was marginally higher 6 and 18 bars later, because the resolution window runs up to 80 bars and the 2R level was touched intrabar before the stop. Second, the 2026-10-28 short was a stop-first loss even though price was 1.27% lower 18 bars later — the stop came first, and the subsequent move was irrelevant to the trade. Across all 51 triggered setups, only 22 of 51 had moved in the signal direction at the first checkpoint.
Now the honesty section. 41.7% is above 33.3%, and that is interesting, not conclusive. It ignores exchange fees, slippage on limit fills, perpetual funding paid while a trade is open, and any position sizing. It covers one market, one timeframe and one seven-month window — a window with its own volatility character that will not repeat. It uses one arbitrary parameter set; change the fractal length, the 12-bar window or the entry edge and the numbers move. 48 resolved trades is a small sample: a handful of different outcomes would push the share below break-even. And a discretionary trader would have filtered many of these setups out and taken others this code never saw. This is an illustration of how the rules behave, not evidence that the model is profitable.
Common mistakes
- Drawing it on a finished chart. Every sweep and CHoCH is obvious in hindsight. If you cannot mark the swept level and the CHoCH trigger before the break happens, you have not tested anything.
- Redefining structure after the fact. When a trade goes wrong, it is tempting to decide the "real" swing was somewhere else. Fix the swing definition in writing and keep it fixed for at least a few dozen trades.
- Treating a wick break as a CHoCH. The model's entire logic rests on a close beyond the level. Wick-based breaks produce far more signals and far more noise.
- Trading every sweep. In this test only about a quarter of sweeps ever produced a valid sequence with a zone. The filtering is the method.
- Stops too tight. Moving the stop inside the sweep wick to improve the R multiple removes the one thing that defines invalidation, and in crypto it makes stop-outs on ordinary wicks far more likely.
- Ignoring regime. During a strong trend, counter-trend sweeps fire constantly and fail. During news-driven spikes and thin-liquidity hours, levels are taken out mechanically with no follow-through.
- Ignoring costs. With a median stop of 1.54%, fees plus slippage plus funding are not rounding errors; on a 2R target they can consume a meaningful share of the result, whatever edge may or may not exist.
Risk control comes before any of this
Risk a small, fixed percentage of account equity per attempt and keep it constant — varying size by "conviction" makes your results uninterpretable. Write down the invalidation price before the entry order is live; the sweep extreme gives you that for free. Journal every attempt, including the ones that never triggered, because the untriggered setups tell you whether your entries are too greedy.
Judge a method over at least a few dozen trades, not five. With a hit rate anywhere near 40%, four losses in a row is unremarkable, and so is three wins in a row — neither tells you anything.
Perpetual futures change the arithmetic. A 1.54% stop at 10× leverage is about 15% of the margin posted on that position, and your liquidation price may sit closer than your stop if the position is sized aggressively on isolated margin — in which case the exchange, not your plan, decides when you exit. Funding is charged while you hold, so a trade that sits open for dozens of hours waiting to resolve has a running cost. Liquidation cascades also produce exactly the kind of long wick this model calls a sweep, with no "smart money" involved at all.
Combining it with other tools
The sweep→CHoCH→entry sequence is the capstone of a stack, and most traders find it easier to apply when the earlier layers have already narrowed the field:
- Market structure and top-down multi-timeframe analysis: take the setup only in the direction of the higher-timeframe structure. On a 1h entry chart, that usually means a 4h or daily bias.
- Liquidity sweeps and equal highs/lows: sweeps of obvious, repeatedly tested levels are the cleanest version of stage one; random intrabar wicks are the vaguest.
- Displacement and imbalance: requiring the break candle to be unusually large relative to recent range is a simple, testable filter on the character of the CHoCH.
- Order blocks, fair value gaps and breaker blocks: these define stage three. Which one you use should be decided in advance, not chosen after seeing where price went.
- Premium/discount and OTE: a Fibonacci retracement of the leg tells you whether your entry zone sits at a relatively good or poor price within the move.
- Volume and open interest: a sweep on a volume spike that is immediately absorbed reads differently from one on thin volume. In perpetuals, a drop in open interest through the wick suggests forced closing rather than fresh positioning.
- ATR: use it to sanity-check the stop distance against current volatility and to size the position accordingly.
Non-SMC confirmation is allowed and encouraged. Nothing stops you from requiring that the entry zone overlaps a classical support level, a volume-profile node or a prior daily close.
Frequently asked questions
Q. What is the difference between CHoCH and BOS?
A break of structure (BOS) is a close beyond a swing point in the same direction as the existing trend — it confirms continuation. A change of character (CHoCH) is the first close beyond a swing point against the existing trend, suggesting the swing sequence may be reversing. Some ICT-derived material calls the same event a market structure shift (MSS), so always check which definition an author is using.
Q. Is a liquidity sweep the same as a stop hunt?
Mechanically, a sweep is just a wick beyond a prior high or low that closes back inside — a failed breakout. The "stop hunt" label adds an assumption about intent, namely that large participants deliberately triggered resting orders. That assumption is the framework's hypothesis about order flow, not a demonstrated fact, and the pattern can be traded without believing it.
Q. What timeframe works best for the sweep, CHoCH and entry model in crypto?
There is no proven best timeframe. Many discretionary traders read bias on a 4h or daily chart and look for the sequence on a 15m–1h chart, though the test on this page ran entirely on 1h candles with no higher-timeframe filter at all. Lower timeframes generate far more setups but smaller stop distances, so fees, funding and slippage consume a larger share of each trade.
Q. Should I enter at the fair value gap or at the order block?
The common convention is to prefer the first same-direction FVG inside the impulse and to fall back to the order block of the break only when no FVG formed — which is exactly the rule tested here. What matters more than the choice is making it in advance and applying it consistently, since switching between zones after the fact is a reliable way to fool yourself in a backtest.
Q. Does the SMC entry model actually work?
There is no peer-reviewed or independent evidence that smart money concepts patterns produce a trading edge. In the single mechanical test described on this page, 20 of 48 resolved SOL/USDT 1h setups (41.7%) reached a 2R target before the stop, against a 33.3% break-even share — above break-even on that sample, but before costs, on one market, one window and one parameter set. Treat it as an illustration, not a verdict.
Q. How can I test this on my own charts without risking money?
Write the rules down with exact numbers — swing definition, break window, zone choice, entry edge, stop, target — then step through historical charts bar by bar in replay so you cannot see the future, and log every attempt including untriggered ones. Record the R outcome, not a feeling. A few dozen logged attempts will teach you more about whether you can execute the model than any amount of reading.
Key takeaways
- The setup is a sequence, not a signal: an unbroken level is swept, structure breaks the other way on a close, and the entry is placed in the FVG or order block left by that break, with the stop at the sweep's extreme.
- Its strength is structural — objective invalidation and clean R multiples — rather than predictive; the "smart money hunts stops" story is a hypothesis, and the components have older ancestors in Dow theory, Wyckoff and classical support/resistance.
- Every number in the rules is a parameter. Fix them in writing before testing, and expect results to change when you change them.
- In one mechanical SOL/USDT 1h test, 219 sweeps produced only 57 valid sequences and 51 entries; 41.7% of resolved trades reached a 2R target first versus a 33.3% break-even share — interesting, small-sample, cost-free and not proof of profitability.
- With a median stop near 1.5%, leverage and funding in perpetual futures dominate the outcome: fix risk per trade, know your liquidation price, and judge the method over dozens of logged attempts, not a handful.
Educational material. Charts use real SOL/USDT perpetual prices; past behaviour does not predict future results. Not investment advice.