Indicator & technique library · Smart money deep dive
Top-Down Multi-Timeframe Analysis in SMC Explained
At a glance
- Top-down analysis means reading context on a high timeframe, locating zones on an intermediate one, and timing entries on a lower one.
- The method is far older than SMC: Dow theory's primary/secondary/minor movements and Elder's Triple Screen say much the same thing in different words.
- A bias rule is only honest if it is causal — here the daily structure direction is taken as of the previous daily close, never from the candle still forming.
- In the SOL window studied, 4h breaks aligned with the daily did not clearly outperform those against it (5/11 vs 4/11 follow-through), which is a reminder that alignment is a filter, not an edge.
Top-down multi-timeframe analysis is the habit of reading a chart from the largest timeframe you care about down to the one you actually click on. You establish context first — is the daily making higher highs or lower lows, where are the obvious levels — then drop down to find a zone, then drop again to time an entry and define risk. Nothing is traded until the lower timeframe agrees with the picture you built above it.
Traders care about it because the same candlestick pattern means different things in different contexts, and because most of the damage in discretionary trading comes from acting on a 5-minute impulse inside a daily range that has been chopping for three weeks. In smart money concepts (SMC) and ICT-flavoured material this workflow is usually the organising frame for everything else: order blocks, fair value gaps, liquidity sweeps and equal highs are all supposed to be read in the direction of the higher-timeframe narrative. Whether that frame adds edge is an open question — this page will show you how to build it mechanically, and then show you a window where the filter did not help.
What is Top-Down Multi-Timeframe Analysis?
Top-down analysis is a workflow, not an indicator. There is no line on the chart called "top-down"; there is a sequence of questions you answer in a fixed order, from the slowest chart to the fastest. The usual three-layer version looks like this:
- Context layer (highest timeframe): daily or weekly. Direction of structure, major swing highs and lows, the range the market is living in. Output: a bias — up, down or none.
- Zone layer (intermediate): 4h or 1h. Where price would have to trade for a setup to exist at all: an unmitigated order block, a fair value gap, a premium or discount area, a pool of equal highs or lows. Output: one or two levels, not a forecast.
- Execution layer (lowest): 15m, 5m, sometimes 1m. Confirmation and risk definition: a liquidity sweep followed by a change of character, a displacement candle, a retest. Output: an entry price, an invalidation price and a size.
In SMC vocabulary the layers are often called HTF bias, POI (point of interest) and LTF entry model. The vocabulary is community vocabulary and it drifts: what one teacher calls a market structure shift (MSS) another calls a change of character (CHoCH), and some use MSS only for the first break after a liquidity sweep. When you read any material on this subject, check the author's definitions before assuming yours match.
The key constraint — and the part beginners skip — is direction of information flow. Context flows down: the daily tells the 4h what to look for. Signals do not flow up: a 5-minute break does not change your daily bias. The moment you let a fast chart rewrite the slow chart, you have stopped doing top-down analysis and started doing timeframe shopping.
The idea behind it (theory and history)
The underlying claim is simple: price movement is nested. A daily uptrend is built out of 4h advances and 4h pullbacks; each 4h pullback is itself a small downtrend on the 15m. If that is true, then the probability distribution of the next few 4h bars should depend on where you are inside the larger swing, and trading the smaller swing that runs with the larger one should be less punishing than fading it.
This is old. Charles Dow's editorials in the Wall Street Journal around the turn of the twentieth century described three simultaneous movements in the market — a primary tide, secondary reactions and daily ripples — and the idea was collected and systematised after his death by writers including S. A. Nelson and later Robert Rhea. Dow theory's "confirm the primary trend, trade the secondary reaction" is top-down analysis in pre-chart-software language. Richard Wyckoff's work in the same era pushed the same logic: read the larger campaign first, then look for the spring or upthrust that starts the next leg.
The modern retail formulation most people meet first is Alexander Elder's Triple Screen trading system, presented in Futures magazine in the 1980s and explained in detail in Trading for a Living (1993). Elder's structure is explicitly three screens — a long-term trend filter, an intermediate oscillator used only in the direction of that filter, and a short-term entry technique — and he suggested stepping between timeframes by a factor of roughly five. If you have ever been told "use the daily for trend, the 4h for the pullback, the 15m for entry", you are using a restatement of Triple Screen.
SMC and ICT material arrived much later. The ICT framework is associated with Michael J. Huddleston, who teaches under the name "Inner Circle Trader" and whose material spread largely through online video from about the mid-2010s; "smart money concepts" is the broader community repackaging of those ideas. Its contribution to top-down analysis is mostly vocabulary and a specific causal story: proponents argue that large institutional participants must accumulate positions against retail liquidity, that resting stop orders above equal highs and below equal lows are the fuel for that process, and that the higher-timeframe "narrative" is a plan being executed across sessions. That is a hypothesis about order flow, not an established fact. There is no peer-reviewed or independent evidence that BOS/CHoCH labelling, order blocks or higher-timeframe alignment produce a trading edge, and much of what the framework describes overlaps with well-documented older ideas: swing structure (Dow), support and resistance, price gaps, Wyckoff springs and upthrusts, and Fibonacci retracement zones.
So treat top-down analysis as what it demonstrably is — a discipline for organising discretionary decisions and for not contradicting yourself across charts — rather than as a mechanism that forces price to move.
How it is calculated
The workflow is discretionary, but you can mechanise it well enough to test. Here is the exact procedure used in the example later on this page, which you can reproduce on any symbol.
Step 1 — mark daily swings. Use a fractal with two bars on each side: a bar is a swing high if its high is the highest of the five-bar window centred on it, and a swing low if its low is the lowest. Note that a swing is only confirmed two bars after it printed. That lag is real and you must respect it.
Step 2 — define daily direction by close-based breaks. If a daily candle closes above the last confirmed swing high, direction becomes up. If a daily candle closes below the last confirmed swing low, direction becomes down. Direction is simply the last break; it persists until the opposite break occurs. Using closes rather than wicks removes a lot of single-print noise at the cost of a few hours of lag.
Step 3 — apply the bias without look-ahead. Every 4h bar inherits the daily direction as of the previous daily close. Today's unfinished daily candle contributes nothing. This single rule is what separates an honest study from a chart that looks magical because it quietly used tomorrow's information.
Step 4 — mark lower-timeframe structure. On the 4h, use the same fractal logic with a wider window (three bars each side) and track the current 4h structural direction. A close beyond the relevant swing in the same direction as current 4h structure is a BOS (break of structure, continuation). A close beyond the swing in the opposite direction is a CHoCH (change of character, the first break that argues for a turn).
Step 5 — tag and measure. Each 4h break is tagged with the daily if its direction matches the inherited daily bias, otherwise against the daily. Follow-through is defined mechanically: the close six bars later must be beyond the break bar's close in the break direction.
```
Higher timeframe bias (daily)
swing_high[i] = high[i] == max(high[i-2 .. i+2]) swing_low[i] = low[i] == min(low[i-2 .. i+2])
if close_D > last_confirmed_swing_high -> daily_dir = up if close_D < last_confirmed_swing_low -> daily_dir = down
daily_dir holds its last value until the next break
No look-ahead
bias(4h bar t) = daily_dir as of the previous daily close
Lower timeframe events (4h, k = 3)
BOS = close beyond swing, same direction as current 4h structure CHoCH = close beyond swing, opposite direction
Tag and outcome
tag = "with" if break_dir == bias(t) else "against" follow_through = close[t+6] beyond close[t] in break_dir ```
None of these choices is canonical. They are one defensible set, written down so the results can be checked.
Default settings and variations
| Choice | Common default | Why | Variations |
|---|---|---|---|
| Timeframe stack | 1D → 4h → 15m | Roughly 6x and 16x steps; each layer holds ~5–20 bars of the one below | 1W → 1D → 1h for swing trading; 4h → 15m → 1m for intraday |
| Step ratio | 4x to 6x | Elder's "factor of five"; smaller steps give near-duplicate charts | 3x is noisy, 10x+ leaves a context gap |
| Swing detection | Fractal, k = 2 or 3 | Larger k = fewer, more meaningful swings, more lag | ZigZag by % threshold; ATR-based swings |
| Break definition | Candle close | Filters wick-driven false breaks | Wick break (earlier, noisier); close + displacement filter |
| Bias source | HTF structure direction | Keeps the whole method in one language | 200 EMA slope, HTF candle direction, premium/discount of the dealing range |
| Bias timing | Previous HTF close | Prevents look-ahead | Intrabar HTF — convenient live, invalid in backtests |
| Outcome horizon | 6 bars on the entry TF | Short enough to be about the signal, not the month | 12–24 bars for swing holds |
Two crypto-specific notes. First, the "daily close" is a convention, not a fact: spot and perpetual markets trade 24/7 with no session gaps, and most exchanges and data providers close the daily candle at 00:00 UTC. If your charting platform uses exchange-local time or your broker uses 17:00 New York, your daily swings — and therefore your bias — will differ from someone else's. Pick one convention and stay with it.
Second, weekends do not stop anything. Liquidity thins, spreads widen and a single large order can push a daily level that would not have moved on a Wednesday. Many traders widen their swing parameter (k = 3 instead of k = 2) on the daily for exactly this reason.
How to read it
Reading top-down is reading a chart twice: once for the environment, once for the event. Start by shading the environment. If the daily structure direction is up, the background is "up" until a daily close breaks the last confirmed swing low; then it flips. You are not predicting anything — you are recording which side of the structure the market most recently chose.
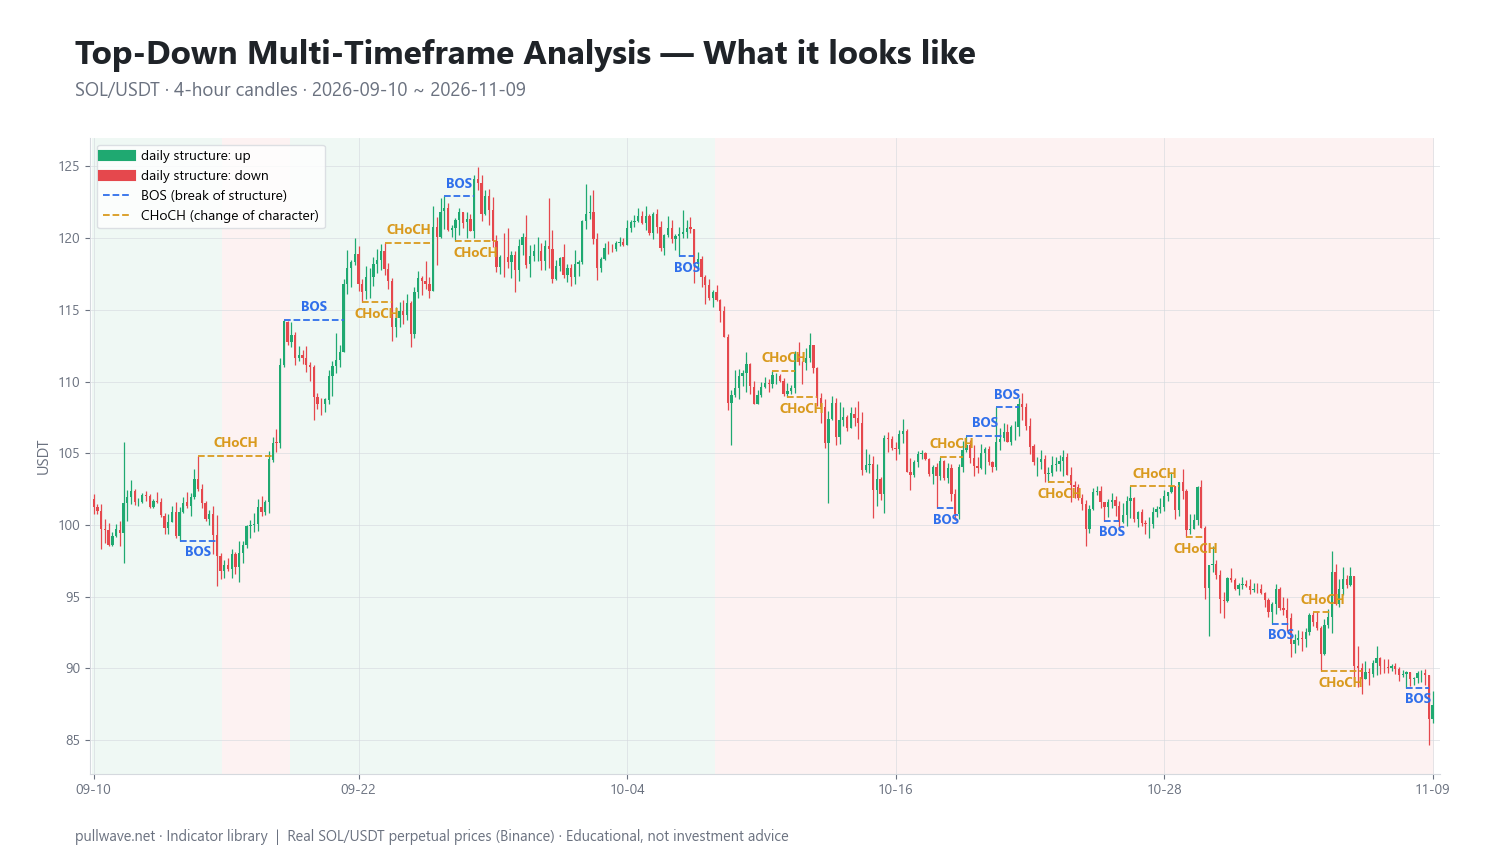
Figure 1 shows SOL/USDT 4h candles with the background shaded by daily structure direction as of the previous daily close, and each 4h BOS or CHoCH drawn as a dashed line. Three things are visible immediately: the shading changes rarely compared to the dashed lines, the shading lags the turn (it flips only after a confirmed daily break), and plenty of dashed lines sit inside shading of the opposite colour. That last point is the whole subject of this lesson.
Once the environment is shaded, read each break with three questions. What kind of break is it — a BOS continuing the existing 4h leg, or a CHoCH that contradicts it? Where did it happen — into fresh territory, or right back into a level the market has already visited four times? Does it agree with the shading? A 4h CHoCH to the upside inside down-shaded background is the classic conflicted signal: the fast chart says one thing, the slow chart has not confirmed it yet.
A practical reading convention: a BOS with the shading is a continuation event, a CHoCH against the shading is a warning that the higher-timeframe bias may be about to lag badly, and a CHoCH with the shading after a pullback is the configuration most SMC traders describe as their core setup — the lower timeframe resuming in the direction the higher timeframe already chose.
How traders use it
1. As a directional filter. The most common use: only take lower-timeframe entries whose direction matches the higher-timeframe bias, and ignore the rest. When it works: in sustained trends, where the HTF direction persists for weeks and most counter-trend breaks are pullback noise. When it fails: in ranges, where the daily flips bias every few days and the filter simply alternates which half of the chop you are allowed to trade; and at genuine turns, where the HTF lags by definition and the filter blocks the first — often best — leg of the new move.
2. Zone on the middle chart, trigger on the bottom chart. Mark a 4h order block, fair value gap or equal-highs pool, wait for price to reach it, then drop to 15m and require a sweep followed by a change of character before acting. This is the sweep → CHoCH → entry model covered separately in this series. When it works: when the zone is unmitigated and the approach is impulsive rather than grinding. When it fails: in slow drift, where price nibbles at the zone for twenty bars and every 15m CHoCH is noise; and during news or funding-driven spikes, where the lower timeframe gives three contradictory signals in an hour.
3. To split risk from reward. The higher timeframe defines invalidation ("below this daily swing low, my read is wrong"), while the lower timeframe defines the entry. The gap between a tight LTF stop and a distant HTF target is where favourable reward-to-risk ratios come from. When it works: when volatility is calm enough that a tight stop survives normal noise. When it fails: in high-volatility crypto regimes, where a 15m stop is inside the average 4h wick and you are stopped out repeatedly while being "right" on the daily. Sizing from an ATR-based distance rather than from a pretty chart level is the usual remedy.
4. To manage an open position. Many discretionary traders hold while the higher-timeframe structure is intact and reduce or exit on the first HTF CHoCH rather than on lower-timeframe wobbles. When it works: for multi-day swings where the point is to avoid being shaken out. When it fails: with leveraged perpetuals, where "ignore the noise" and "survive a liquidation cascade" are incompatible; a 12% wick on thin weekend liquidity closes the position for you regardless of your daily structure read.
A working checklist:
| # | Chart | Question | What you write down |
|---|---|---|---|
| 1 | Daily | Direction of last confirmed structural break? | up / down / unclear |
| 2 | Daily | Nearest untouched swing high and low? | two prices |
| 3 | 4h | Is price in a zone (OB, FVG, equal highs/lows, premium/discount)? | zone high & low |
| 4 | 4h | Last break: BOS or CHoCH, with or against the daily? | tag |
| 5 | 15m | Sweep, then CHoCH, then displacement? | yes / no |
| 6 | 15m | Invalidation price and distance in ATR? | stop and size |
| 7 | Any | Funding, scheduled news, weekend liquidity? | go / stand aside |
Example on a real SOL chart
The market is SOL/USDT perpetual on Binance, 4h candles, from 2026-09-10 to 2026-11-09, last close 87.44. The rules are exactly the ones above: daily swings with a two-bar fractal and close-based breaks, each 4h bar inheriting the daily direction as of the previous daily close, 4h swings with k = 3, and follow-through defined as the close six bars after the break being beyond the break bar's close in the break direction. Outcomes are also reported 18 bars later.
Across the window the daily structure pointed up 41.4% of the time and down 58.6% — a mildly down-skewed, not cleanly trending, environment. The 4h chart produced 22 structural breaks, which is roughly one every two and a half days: 11 with the daily bias and 11 against it. That even split is itself informative. If a filter removes half your signals, it needs to improve the remaining half materially to be worth the lost sample.
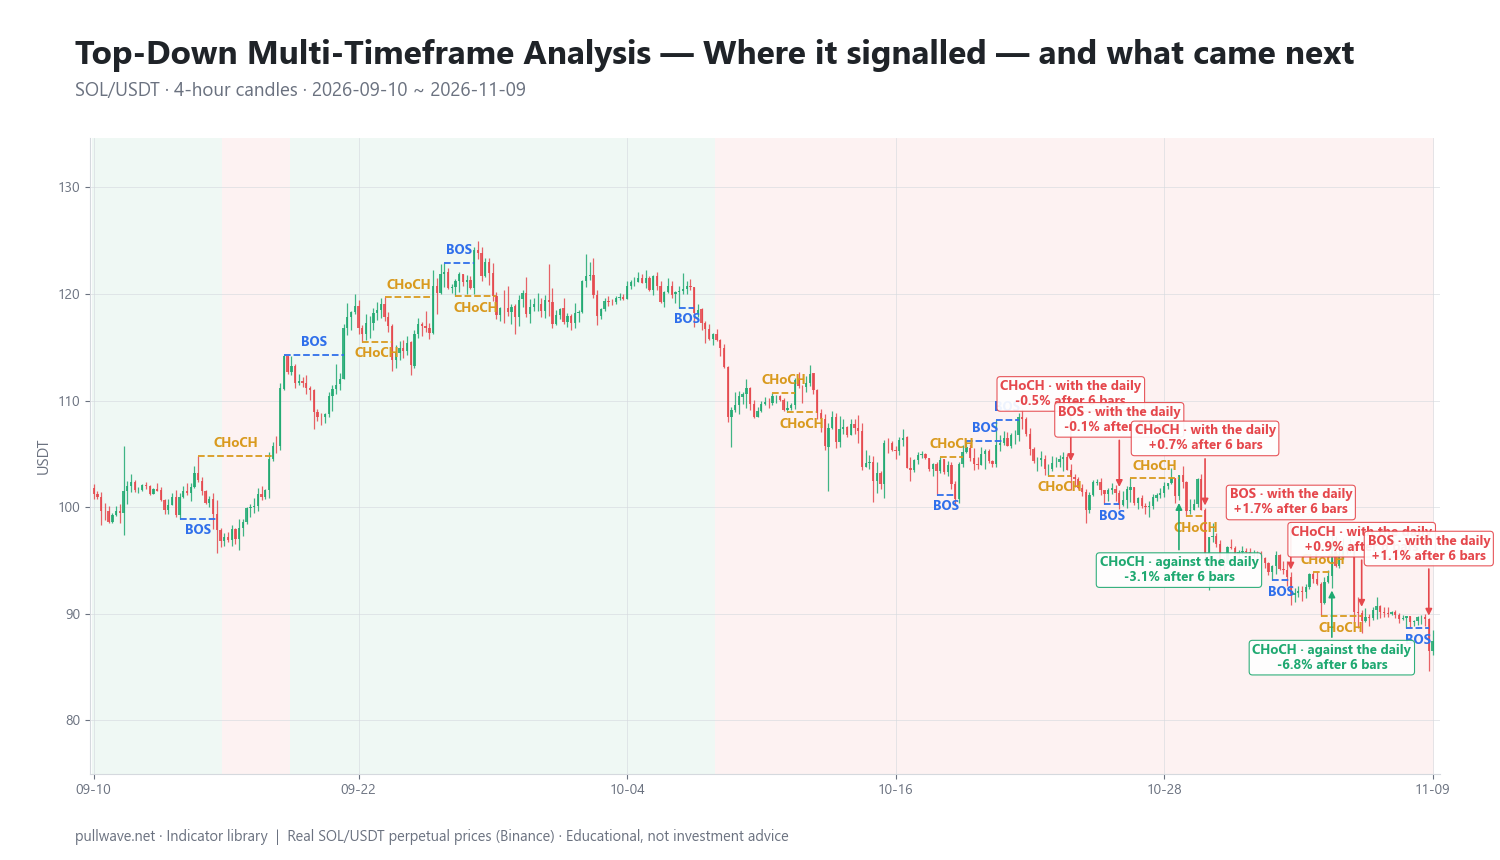
Figure 2 repeats the chart with every 4h break labelled with the daily or against the daily and the percentage price move six bars later. Here are ten of the twenty-two events, in sequence:
| Date (UTC) | Event | Price | Move after 6 bars | Move after 18 bars |
|---|---|---|---|---|
| 2026-10-20 20:00 | BOS · against the daily | 106.47 | +0.40% | −3.46% |
| 2026-10-21 12:00 | BOS · against the daily | 108.44 | −3.56% | −8.04% |
| 2026-10-23 20:00 | CHoCH · with the daily | 102.79 | −0.45% | −1.83% |
| 2026-10-26 00:00 | BOS · with the daily | 100.18 | −0.05% | −0.54% |
| 2026-10-28 16:00 | CHoCH · against the daily | 103.02 | −3.15% | −7.03% |
| 2026-10-29 20:00 | CHoCH · with the daily | 95.62 | +0.71% | −1.16% |
| 2026-11-02 16:00 | BOS · with the daily | 91.74 | +1.66% | −1.84% |
| 2026-11-04 12:00 | CHoCH · against the daily | 96.69 | −6.75% | −7.43% |
| 2026-11-05 20:00 | CHoCH · with the daily | 89.30 | +0.90% | −3.14% |
| 2026-11-08 20:00 | BOS · with the daily | 86.50 | +1.09% | +1.09% |
Read the table carefully. These percentages are raw price moves, not direction-adjusted: a −3.56% figure after a bearish break is follow-through, after a bullish break it is failure. The last row shows both horizons at +1.09% because the 18-bar window ran past the end of the data — a small reminder that the final events in any sample are measured on a truncated horizon.
The direction-adjusted result is the one that matters, and it is unimpressive. Follow-through occurred in 5 of 11 breaks that agreed with the daily and 4 of 11 that opposed it — 9 of 22 overall, about 41%, below a coin flip. The median six-bar move was −0.71% for the with-the-daily group and −1.26% for the against group; both are negative because the window itself drifted lower, so those medians describe the environment more than the signal.
The honest conclusion: in this window, on this market, with these rules, breaks aligned with the daily did not clearly outperform breaks against it. Five out of eleven versus four out of eleven is a difference of one event; with a sample this small it is indistinguishable from noise. Nor does it prove the filter is worthless — one symbol over two months cannot establish anything in either direction. What it does establish is that "trade with the higher timeframe" is not self-evidently profitable, and that anyone presenting it as obvious has probably not measured it. Notice also that the two largest adverse moves in the table (−6.75% and −3.56% at six bars) came within two days of a structural break, which is the practical point: in leveraged crypto, the size of the wrong-way move matters more than the hit rate.
Common mistakes
Timeframe shopping. Opening the 1h, then the 2h, then the 30m until one of them shows the structure you want. If the rule is "daily and 4h", the 2h does not get a vote. Decide the stack before you look.
Hindsight marking. Structure is trivially obvious on a finished chart. Every swing is where it belongs, every break was clean. The only way to know whether you can mark structure in real time is to mark it bar by bar — hide the right-hand side of the chart with a replay tool and advance one candle at a time.
Look-ahead in the bias. Using the daily candle that is still forming to set today's bias is the single most common way to produce a study that looks excellent and performs terribly. The rule used above — bias as of the previous daily close — is deliberately conservative.
Too many layers. Weekly, daily, 12h, 4h, 1h, 15m, 5m. At some point every chart contradicts another one and you have built a machine for inaction. Three layers is plenty; two is often enough.
Treating bias as prediction. The daily being "up" is a record of the last break, not a forecast. In this SOL window the daily flipped often enough that 11 of 22 4h breaks fought it, and the filter would have removed half the sample without improving the half it kept.
Ignoring the crypto plumbing. Perpetual funding paid every eight hours, thin weekend books, and liquidation cascades that run stops in both directions in twenty minutes are not part of the structural model at all. A valid daily read plus 20x leverage is still a position that can be closed by a wick.
Mismatched daily close. If you build bias on a 00:00 UTC daily and your chart platform uses a different boundary, your swing highs and lows are literally different bars from everyone else's. This matters most near month-end and around large scheduled macro releases.
Confusing confluence with confirmation. Stacking an order block, a fair value gap, a Fibonacci level and a higher-timeframe bias on the same price does not multiply probabilities; these inputs are highly correlated with each other and with plain support and resistance. Four views of the same level is still one level.
Combining it with other tools
Top-down analysis is the scaffolding the rest of this series hangs on. Market structure supplies the BOS/CHoCH definitions used at each layer. Order blocks and fair value gaps are what you look for on the middle chart once the bias is set. Liquidity sweeps and equal highs and lows explain why price reaches those zones in the first place, and the sweep → CHoCH → entry model is the execution layer in its most common form. Premium/discount and OTE tell you where inside the higher-timeframe range a with-bias entry is being taken — buying the top of a daily range while calling it "with the trend" is a frequent error. Displacement and imbalance give a severity measure for the break itself, and volume confirmation is a useful independent check since it comes from a different data column than price structure.
Outside the SMC vocabulary, two cross-checks are worth having. A long moving average on the context chart (200-period, for instance) is a crude but non-discretionary trend proxy; if it disagrees with your structural bias, you are probably in a range and your bias is noise. And ATR on the execution chart turns "where is my stop" from an aesthetic judgement into a volatility measurement, which matters more in crypto than in almost any other market.
If you want to test the idea yourself without risking money: pick one symbol, pick one stack (1D → 4h), write the rules down, mark every break for three months in replay mode, tag each one with or against, and record the move six bars later. A hundred events across several symbols starts to be informative. Twenty-two, as in the example above, is a story — not evidence.
Frequently asked questions
Q. What timeframes should I use for top-down analysis in crypto?
A stack of daily → 4h → 15m suits swing trading, and 4h → 15m → 1m suits intraday work. The useful guideline, going back to Alexander Elder's Triple Screen, is a step of roughly four to six times between layers, so each chart holds a meaningful number of bars from the one below. More than three layers usually produces contradictions rather than clarity.
Q. What is the difference between BOS and CHoCH?
A break of structure (BOS) is a close beyond a swing point in the same direction as the current structural trend — a continuation. A change of character (CHoCH) is a close beyond a swing point in the opposite direction, the first structural evidence that the trend may be ending. Usage varies between teachers, and some use "market structure shift" (MSS) for one or both, so always check how a given source defines the terms.
Q. Should I only trade in the direction of the higher timeframe?
Many discretionary traders use alignment as a filter, and it does reduce the number of trades taken against a dominant trend. But it is a filter, not an edge: in the SOL window measured on this page, breaks with the daily showed follow-through in 5 of 11 cases versus 4 of 11 against, which is not a meaningful difference. Alignment also blocks the first leg of every genuine reversal, because higher-timeframe structure confirms late by construction.
Q. When does the daily candle close in crypto?
Most exchanges and charting platforms close the daily candle at 00:00 UTC, since crypto trades 24/7 with no session breaks. Different platforms may use exchange-local time or a trading-session convention, which will shift your daily highs and lows to different bars and change your bias. Fix one convention before you mark anything, and keep it consistent between live trading and backtests.
Q. How do I avoid look-ahead bias when marking structure?
Two rules cover most cases: use only the higher-timeframe information available at the previous higher-timeframe close, and remember that a fractal swing is not confirmed until k bars after it printed. Verify by replaying the chart candle by candle with the right-hand side hidden — if you cannot mark the same structure forward that you marked backward, your study is measuring hindsight.
Q. Does SMC top-down analysis actually work?
There is no independent or peer-reviewed evidence that SMC labelling or higher-timeframe alignment produces a trading edge, and the "institutions hunt retail stops" narrative is the framework's hypothesis about order flow rather than a documented fact. What top-down analysis demonstrably provides is consistency: a fixed order of questions, a written bias, and a defined invalidation. Treat it as a decision process to be tested on your own data, not as a mechanism.
Key takeaways
- Top-down analysis is a workflow — context on the highest timeframe, zones on the intermediate, timing and risk on the lowest — and information must flow downward only.
- The idea long predates SMC: Dow theory's primary, secondary and minor movements and Elder's Triple Screen (Futures magazine, 1980s; Trading for a Living, 1993) describe the same discipline.
- Mechanise the bias so it can be tested: close-based structural breaks on the daily, applied to each lower-timeframe bar as of the previous daily close, with no look-ahead.
- In the SOL/USDT 4h window from 2026-09-10 to 2026-11-09 the daily pointed down 58.6% of the time, 22 4h breaks split 11 with and 11 against the daily, and follow-through was 5/11 versus 4/11 — alignment did not clearly help in that sample, and one sample proves nothing either way.
- The real-world failure modes are timeframe shopping, hindsight marking, correlated "confluence", and crypto-specific risks — funding, thin weekend liquidity and liquidation cascades — that no structural model accounts for.
Educational material. Charts use real SOL/USDT perpetual prices; past behaviour does not predict future results. Not investment advice.