Indicator & technique library · Smart money deep dive
Volume Confirmation for SMC Setups: RVOL, Profile, POC
At a glance
- Volume confirmation means testing SMC markings — order blocks, FVGs, BOS/CHoCH and sweeps — against how much actually traded.
- Relative volume (bar volume ÷ its own 20-bar average) only says a candle was busier than usual; it cannot identify who traded.
- A volume profile re-sorts the same volume by price to give the POC, the 70% value area, and high- and low-volume nodes.
- In one SOL/USDT 4h window, break bars ran at 1.64× average volume versus 0.84× for all candles, yet high-volume breaks followed through 3 of 9 times and quiet ones 3 of 6.
Volume confirmation is not an indicator with a settings box. It is the habit of testing the lines you have already drawn on price — order blocks, fair value gaps, break of structure (BOS), change of character (CHoCH), liquidity sweeps — against a second data series: how much was actually traded while price did that. Two tools do the work. Relative volume reads volume along the time axis, bar by bar. A volume profile re-sorts exactly the same volume along the price axis, showing where business was done rather than when.
Traders care because a chart marked up after the fact is extremely persuasive and almost unfalsifiable: every finished move has a tidy order block behind it. Volume adds a number the exchange recorded that you cannot redraw — this bar traded 2.0 times its recent average, that one 0.7 times. That is useful context, and it is also weaker evidence than most tutorials imply, because aggregate exchange volume contains no buyer/seller split, no order-book depth and no information about who was on either side.
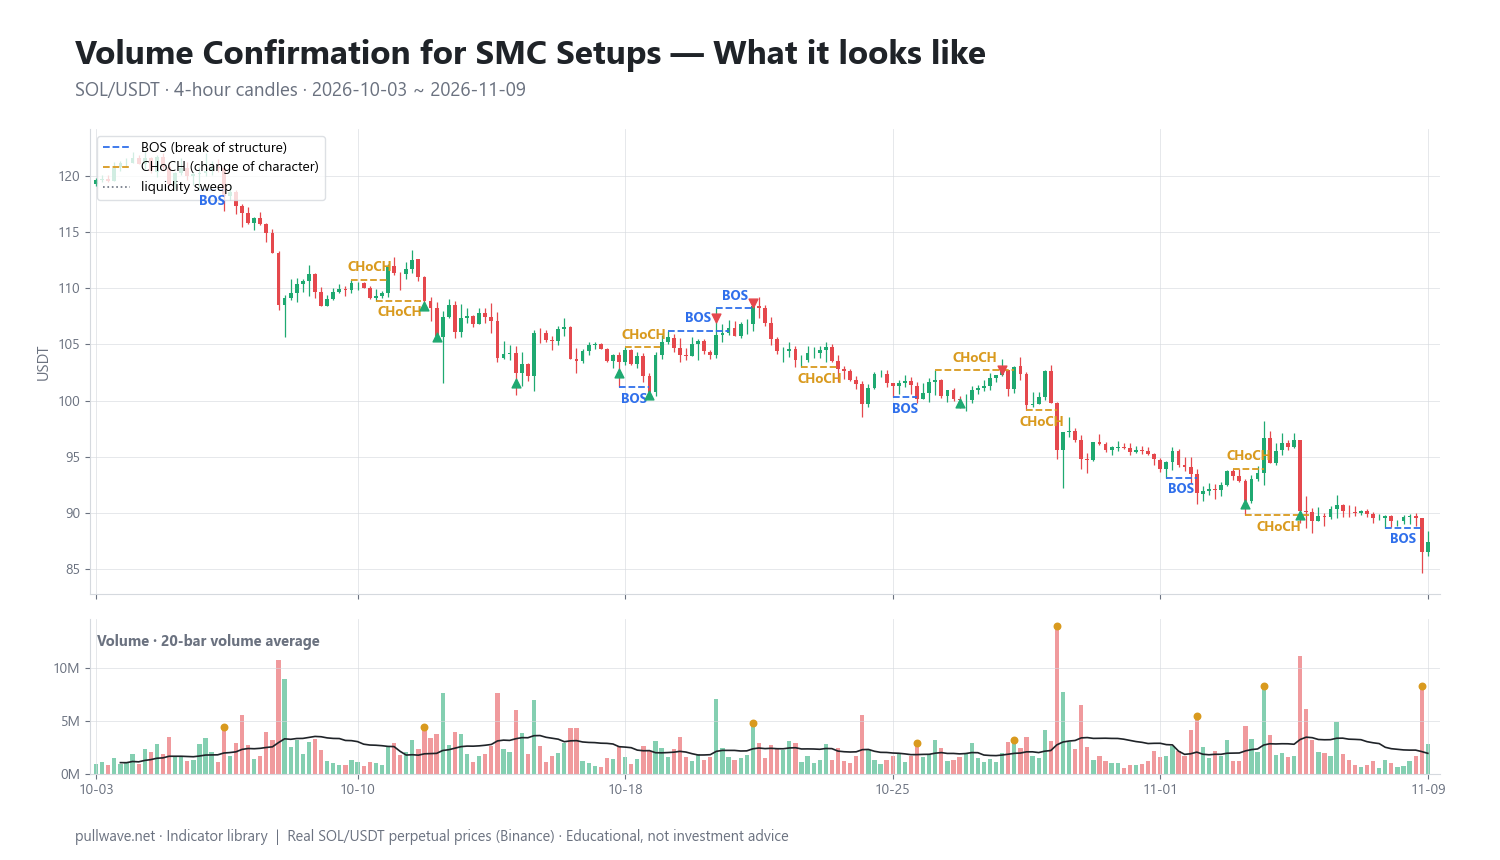
Figure 1 shows the raw material: SOL/USDT 4-hour candles with each structure break labelled BOS or CHoCH plus its relative-volume multiple, liquidity sweeps marked as triangles, and a lower panel with volume bars against their 20-bar average.
What is Volume Confirmation for SMC Setups?
Smart money concepts (SMC) is a discretionary chart-reading vocabulary — structure, order blocks, imbalance, liquidity — that says a great deal about price and almost nothing about participation. Volume confirmation is the add-on step: before treating a marking as meaningful, you check whether the bar or the price region behind it was busy or quiet relative to its own recent history.
There are two distinct measurements, and mixing them up causes most of the confusion:
- Time-based volume. How much traded during one candle, expressed as relative volume (RVOL): the bar's volume divided by the average of the previous bars. This is what people mean by "the break happened on volume."
- Price-based volume. How much traded at each price level over a window, regardless of when. This is the volume profile, from which you derive the point of control (POC), the value area and high- and low-volume nodes. This is what people mean by "that order block sits in heavily traded price."
Be clear about the underlying data. Crypto chart volume is one exchange's aggregate traded volume for one market over one interval. It is not a buy/sell split, not resting order-book depth, not open interest and not "institutional flow." The same candle on another venue shows different volume, perpetual-futures volume and spot volume behave differently, and on smaller venues reported volume can be inflated. A high-RVOL bar tells you more changed hands than usual — not who, why, or which side was the aggressor.
The idea behind it (theory and history)
The oldest version is Richard D. Wyckoff's "effort versus result," taught in his 1930s course material: volume is effort, the price range is result, and the interesting cases are mismatches. Wyckoff's springs and upthrusts — a push beyond a range extreme that immediately reverses — are the direct ancestor of what SMC calls a liquidity sweep, and he already discussed them in volume terms.
Price-based volume has a different lineage. J. Peter Steidlmayer, working with the Chicago Board of Trade in the early 1980s, developed Market Profile, which organised trade into time-price opportunities at each price and introduced the vocabulary of value area and point of control. The modern volume profile is the volume-weighted cousin: instead of counting time units at each price, it sums traded volume. The 70% value area convention comes from Market Profile's use of roughly one standard deviation of a normal distribution. VWAP, meanwhile, grew up as an institutional execution benchmark in the transaction-cost literature of the late 1980s before charting software turned it into a line traders trade against.
SMC itself is far newer and far less documented. It is associated above all with Michael J. Huddleston, who publishes as "Inner Circle Trader" (ICT), and spread mainly through online videos from roughly the mid-2010s. Definitions vary between teachers — "market structure shift" and "change of character" are often the same event — and there is no peer-reviewed or independent evidence that these patterns confer an edge. The story that banks deliberately hunt retail stops is the framework's hypothesis about order flow, not an established fact. Proponents argue that volume spikes at swing extremes show large participants filling against trapped traders; ordinary volatility clustering and leveraged liquidations explain the same data equally well. Aggregate volume cannot distinguish the two.
What volume does add is an older, better-documented layer underneath the new vocabulary. A high-volume node is a price where a lot of business was done, which is the classical definition of support and resistance. A low-volume node is a thin area price crossed quickly, overlapping with the price-gap literature and with the SMC idea of imbalance.
How it is calculated
Step 1 — relative volume. Divide the candle's volume by the simple average of the previous 20 candles' volume. 1.00 is an average bar, 2.00 twice the norm, 0.70 quieter than usual.
Step 2 — locate structure breaks. Mark swings with a fractal rule: a bar is a swing high if its high is the highest of the three bars on each side (k = 3), mirrored for lows. A break is recorded when a candle closes beyond the most recent relevant swing. Closing beyond, rather than wicking beyond, is what separates a break from a sweep. Label it BOS when it extends the existing direction, CHoCH when it breaks the other way for the first time.
Step 3 — record the break bar's RVOL. That is the number after the × in the chart labels.
Step 4 — define follow-through in advance. Here a break "followed through" if the close 6 bars later was beyond the break bar's close in the break direction; 18 bars is recorded as a longer horizon. Fixing the horizon first is what stops hindsight from deciding which breaks worked.
Step 5 — build the profile. Split the window's price range into 48 equal bins. For each candle compute a typical price (H + L + C) ÷ 3 and add that candle's whole volume to the containing bin. Then take the POC, the value area, and the top- and bottom-quartile bins.
``` RVOL[i] = volume[i] / mean(volume[i-20 .. i-1]) swing high = high[i] > high[i±1..±3] (k = 3) break = close[i] beyond last swing level (close-based) follow-through = sign(close[i+6] - close[i]) == break direction
profile over window W: bins = 48 equal-width price bins, min(low) .. max(high) tp(c) = (high(c) + low(c) + close(c)) / 3 bin[tp(c)] += volume(c) for every candle c in W POC = bin with the most volume value area = smallest set of bins holding >= 70% of total volume HVN / LVN = top / bottom quartile of non-empty bin volumes
VWAP = sum(tp * volume) / sum(volume) over the anchor period ```
Step 5 is deliberately crude: it assigns a candle's entire volume to one price. Better implementations spread each candle's volume across the bins its range covers, or build the profile from lower-timeframe data. The shape changes slightly; the POC rarely moves far.
Default settings and variations
| Parameter | Used here | Why | Variations |
|---|---|---|---|
| RVOL lookback | 20 bars | Long enough to smooth, short enough to adapt | 10, 30, 50; median instead of mean |
| "High volume" | RVOL ≥ 1.5 | A visible step above normal | 1.2 loose, 2.0–3.0 strict |
| Swing strength | k = 3 | Filters noise, keeps 4h structure readable | k = 2 faster, k = 5 higher-timeframe |
| Break rule | Close-based | Separates a break from a wick | Wick-based; close beyond by an ATR fraction |
| Outcome horizon | 6 and 18 bars | Fixed in advance, not chosen in hindsight | Any fixed horizon; ATR target/stop pair |
| Profile bins | 48 | Resolution without noise | 24 coarse, 100+ fine |
| Value area | 70% | Market Profile convention | 68%, 80% |
| HVN / LVN | Top / bottom quartile | Objective, not eyeballed | % of POC volume |
| Profile range | Whole window | Structure of one regime | Fixed-range, visible-range, anchored |
Crypto trades 24/7 with no session gaps, so the daily-session profile used in futures has no natural equivalent. Most crypto traders anchor a fixed-range or visible-range profile to something structural — a trend start, a major high, an unwind — rather than to a clock.
How to read it
Read ratios, not raw volume. Absolute volume drifts with the whole market; the ratio to its own recent average carries the information. Roughly 1.5–2× is clearly busy; above 3× usually means an event — a macro print, a funding flush, a liquidation cascade — and event bars often mark exhaustion rather than a start.
Read the break bar's character. A break with an expanded range and elevated volume says many participants transacted while price left the level. A break on a small body at 0.7× says price drifted past a line that exists only on your chart. Neither predicts anything; they are different qualities of evidence.
Read sweeps differently from breaks. A sweep is a wick beyond a prior extreme with a close back inside. A spike-and-reject on heavy volume is consistent with stops and liquidations being triggered; a quiet drift beyond and back is consistent with nothing much happening. Consistent with — not proof of.
Read the profile as a map of acceptance. The POC is the price where the most volume changed hands over your window — the market's revealed fair price for that period — and the value area holds 70% of it. Inside the value area price tends to rotate, and many traders treat the POC as a magnet on a return. Low-volume nodes are the opposite: price crossed them quickly, and moves back through those pockets often travel fast. Staying outside the value area for many bars is called acceptance; poking out and returning is called rejection.
How traders use it
1. As a filter on structure breaks. Only treat a BOS or CHoCH as context if its bar printed RVOL above a threshold, typically 1.5 or 2.0. Works best when the market has been compressed and the break is the first expansion out of the range. Fails in chop, where every touch of the edges prints respectable volume, and in cascades, where the heaviest volume often appears at the end of the move.
2. As a quality check on sweeps. Traders separate sweeps on a volume spike from sweeps on a quiet drift. Works best at long-standing equal highs or lows where stop clusters plausibly sit. Fails around scheduled news and in thin hours, where one large market order creates both the wick and the volume — and it fails as proof of intent, because you cannot see the aggressor side.
3. As a way to rank zones by location in the profile. Two order blocks can look identical on price and differ completely in volume terms: one inside a high-volume node where price has repeatedly stalled, one inside a thin pocket crossed in two candles. Works best when the profile window matches the regime you trade. Fails when the window is arbitrary — move the start date and the POC moves — or after a genuine re-pricing.
4. As directional and target context. The value area gives an objective, volume-derived version of "expensive versus cheap," overlapping with the premium/discount idea in SMC, and the POC is a natural first reference on a mean-reversion move. Works best in balanced markets; fails in strong trends that leave the value area and never return.
| Check | Supportive | Cautionary |
|---|---|---|
| Break bar RVOL | ≥ 1.5 with expanded range | < 1.0, small body |
| Sweep bar RVOL | Spike with close back inside | Quiet drift beyond the level |
| Zone in profile | At or inside an HVN | Mid-LVN with nothing nearby |
| Price vs value area | Clear, held position | Oscillating across VAL/VAH |
| Event risk | No scheduled release in the bar | Spike caused by a news print |
VWAP. VWAP is the volume-weighted average price over a chosen period. With no session reset in crypto, traders use an anchored VWAP — started at a swing high, a capitulation candle or an event — and read it as the average price paid since that moment, so price above it means the average participant since the anchor is in profit. The weakness is obvious: the anchor is discretionary, and a different anchor gives a different line.
Cumulative volume delta. CVD sums volume executed into the ask minus volume executed into the bid, the closest a retail trader gets to a buy/sell split. It needs trade-level data with an aggressor flag, cannot be derived from OHLCV candles, and is not available in the dataset below. Where you have it, the classic reading is divergence — but CVD is venue-specific and still says nothing about resting liquidity.
Example on a real SOL chart
The window is SOL/USDT perpetual on Binance, 4-hour candles, 3 October to 9 November 2026, ending at a last close of 87.44. All markings come from the mechanical rules above. Another trader using slightly different rules would mark different levels: this is one illustration on one market and window, not evidence that the method works.
Breaks versus ordinary candles. The window contained 15 structure breaks with a median relative volume of 1.64, against 0.84 for all candles. Break bars were roughly twice as busy as a typical bar — but that is partly mechanical, since breaks happen on expansion candles and expansion candles are busy by construction.
Did high volume predict follow-through? Nine breaks had RVOL ≥ 1.5, and 3 of 9 closed beyond the break bar's close in the break direction six bars later. Six breaks were quiet, and 3 of 6 followed through. Across all 15, 6 of 15 moved in the signal direction after six bars. In this sample the volume filter selected the worse group. With samples this small, 33% versus 50% is noise — but it is the honest answer to "does volume confirm the break?" here.
Individual events (moves in the break direction after 6 and 18 bars):
- 20 Oct, BOS ×0.7 at 106.47 — a quiet break: +0.40%, then −3.46%.
- 21 Oct, BOS ×2.0 at 108.44 — a busy break that failed: −3.56%, then −8.04%.
- 29 Oct, CHoCH ×5.1 at 95.62 — the heaviest bar in the set: +0.71%, then −1.16%.
- 4 Nov, CHoCH ×3.0 at 96.69 — high volume, poor outcome: −6.75% and −7.43%.
- 8 Nov, BOS ×3.9 at 86.50 — positive at both horizons: +1.09% and +1.09%.
The context explains more than the volume: this window was a downtrend from the high-100s to the mid-80s, breaks in both directions tended to get faded, and the 18-bar column is negative for almost every event.
Sweeps. There were 11 liquidity sweeps with a median relative volume of 1.95, and 7 of 11 printed RVOL ≥ 1.5. That is consistent with the SMC claim that swing extremes attract transacting, and equally consistent with plain volatility clustering. With no delta and no order-book data, the two cannot be separated.
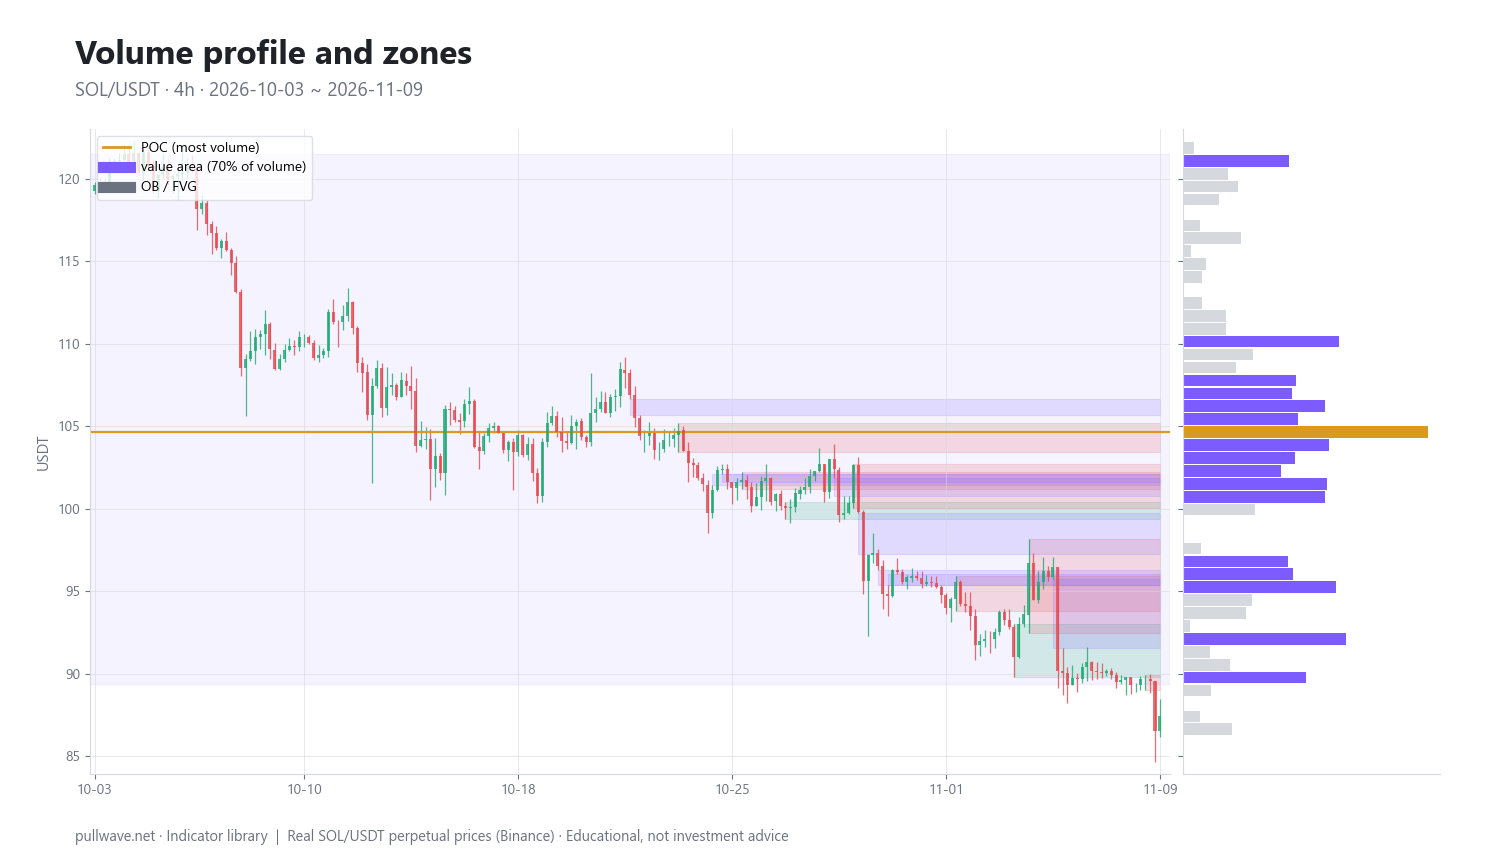
The volume profile. Figure 2 shows the same window rotated: volume by price as a horizontal histogram, with the POC line, the shaded 70% value area and the recent order-block and fair-value-gap zones overlaid. The POC was 104.64, with the value area from 89.36 (VAL) to 121.49 (VAH). The last close of 87.44 sits below the value area low — by the end of the window price had left the region where the period's business was done, which is what a one-way market looks like in profile terms.
Where the zones sat. Of 16 recent zones, 15 overlapped a top-quartile high-volume bin and 5 overlapped a bottom-quartile low-volume bin (a zone spans several bins, so it can do both). Fifteen of sixteen looks like strong corroboration until you notice it is largely tautological: zones form where candles formed, volume accumulates where price spent time, and the top quartile of 48 bins covers a wide swathe of the range. The test has almost no discriminating power — worth knowing before using "my order block is at an HVN" as a reason to size up.
Common mistakes
- Treating volume as identity. Volume records quantity, not participants and not direction. "Huge volume, so institutions bought" is an unsupported leap.
- Comparing raw volume across time instead of normalising it against its own average.
- Mixing perp and spot volume. Perpetual volume reflects leverage, funding and liquidations; spot reflects coin transfer. They diverge sharply during squeezes.
- Letting the profile window drift. The POC at 104.64 is a property of 3 October to 9 November. Choose the anchor for a structural reason, then leave it alone.
- Confirmation bias in replay. It is trivial to find a high-volume order block that "worked" on a finished chart. Mark levels with the right edge hidden.
- Chasing event bars. RVOL of 5× often marks exhaustion or a cascade, not a clean start.
- Using volume as the only filter. In this window it would have been worse than no filter; regime mattered far more.
- Ignoring thin hours. Crypto never closes, but liquidity does thin out, and the same RVOL means something different at 03:00 UTC on a Sunday.
Combining it with other tools
Volume is a second opinion, not a system. With market structure it tells you whether a BOS or CHoCH arrived with participation or by drift. With order blocks and breaker blocks, the profile says whether the zone sits where real business was done or in a thin pocket. With displacement and imbalance and fair value gaps there is a direct conceptual link: an imbalance is by definition a region price crossed without trading much, which is usually where a low-volume node appears.
With equal highs and lows and liquidity sweeps, RVOL distinguishes a violent stop run from a lazy overshoot. With premium/discount and OTE, the value area gives a volume-derived version of the same question, and the two often disagree — which is informative. In a top-down multi-timeframe routine, build the profile on your context timeframe and read RVOL on your execution timeframe. In the sweep → CHoCH → entry sequence, volume can score two bars: the sweep and the CHoCH. Kill zones matter less in 24/7 crypto, though hour-of-day volume averages can substitute. Outside SMC, RVOL pairs well with ATR, funding and open interest.
Testing it yourself without risking money. Pick one market and timeframe, mark every structure break over the last 200 bars with a written rule, record each break bar's RVOL, then record a fixed-horizon outcome decided before you look. Count hit rates for high- and low-volume breaks separately, then repeat on a second market. If the samples disagree, you have found noise — a cheap and valuable discovery.
Frequently asked questions
Q. What does relative volume above 1.5 mean on a break of structure?
It means that candle traded at least 50% more than the average of the previous 20 candles on that timeframe and market. Many traders read it as a sign the break involved real transacting rather than drift. It does not identify who traded, which side was the aggressor, or whether the break will hold.
Q. What is the POC in a volume profile and why does it matter?
The point of control is the price at which the most volume traded over your chosen window — the market's revealed fair price for that period. Traders watch it because price that leaves a heavily traded area often returns to it, so the POC acts as a reference level and sometimes a magnet. Its position depends entirely on the window, so a POC without a stated date range is meaningless.
Q. Does high volume prove that "smart money" is buying?
No. Exchange volume is an aggregate count of what traded, with no information about participant size, identity or intent and no buyer/seller split. Even order-flow tools such as cumulative volume delta only show which side was the aggressor on one venue. The "smart money accumulated here" reading is a hypothesis layered on the number, not something the number demonstrates.
Q. What is the best volume profile setting for crypto?
There is no single best setting, but a workable start is a fixed-range profile anchored to a structural event, with 40–60 price bins and the conventional 70% value area. Because crypto trades 24/7, daily-session profiles have no natural reset, so range-anchored profiles usually make more sense than time-anchored ones. Vary the bin count and check that the POC and value area stay stable.
Q. Should I use spot or perpetual-futures volume for SMC analysis?
Use the market you actually trade, and know they differ. Perpetual volume includes leveraged positioning, funding-driven flows and liquidation cascades, which can produce huge spikes without equivalent coin changing hands; spot volume is usually smaller but reflects real transfer. Some traders watch both and treat a perp spike with flat spot volume as a sign the move was leverage-driven.
Q. Can volume confirmation make SMC setups profitable?
There is no independent evidence for that, and in the SOL window on this page the volume filter selected the worse group: 3 of 9 high-volume breaks followed through versus 3 of 6 quiet ones. Volume is better treated as context that can downgrade a weak-looking signal than as a validator. Any conclusion about profitability has to come from your own forward-tested data and risk management.
Key takeaways
- Volume confirmation combines two different readings of the same data: relative volume along time, and the volume profile along price.
- RVOL only says a bar was busier than its own recent average; it carries no identity, no direction and no order-book depth.
- The POC, value area and high/low-volume nodes are a volume-based restatement of support, resistance and gaps, and they depend entirely on the window you choose.
- In the SOL example, break bars ran at 1.64× versus 0.84× for ordinary candles, yet follow-through was 3 of 9 for busy breaks and 3 of 6 for quiet ones — mixed results from one small window, not proof either way.
- Crypto specifics matter: perp and spot volume differ, 24/7 trading removes session anchors, and leverage-driven cascades can create the largest volume bars at the end of a move.
Educational material. Charts use real SOL/USDT perpetual prices; past behaviour does not predict future results. Not investment advice.