Indicator & technique library · Smart money deep dive
Displacement, Imbalance and Volume in ICT Explained
At a glance
- Displacement is a large, one-directional candle (or short run of candles) that closes near its extreme and usually leaves a three-candle imbalance behind it.
- It is normally measured against recent volatility — for example a body at least 1.5x the previous ATR(14) — and checked against relative volume (volume divided by its own 20-bar average).
- In ICT/SMC the displacement is used to 'validate' a structure break or an order block; this is a framework convention, not an independently verified edge.
- In one SOL/USDT 4h window of 13 displacement candles, only 4 of 13 had closed in the signal direction six bars later, and high relative volume did not improve the hit rate.
Displacement is the name ICT and the wider "smart money concepts" (SMC) community give to a single candle, or a very short run of candles, that travels much further than recent bars, closes near its extreme, and usually leaves a visible gap in price behind it. That gap is the imbalance, better known as a fair value gap (FVG). Volume is the third piece: traders check whether the displacement bar was also busier than normal, on the theory that a big move on heavy participation "means more" than a big move on thin trade.
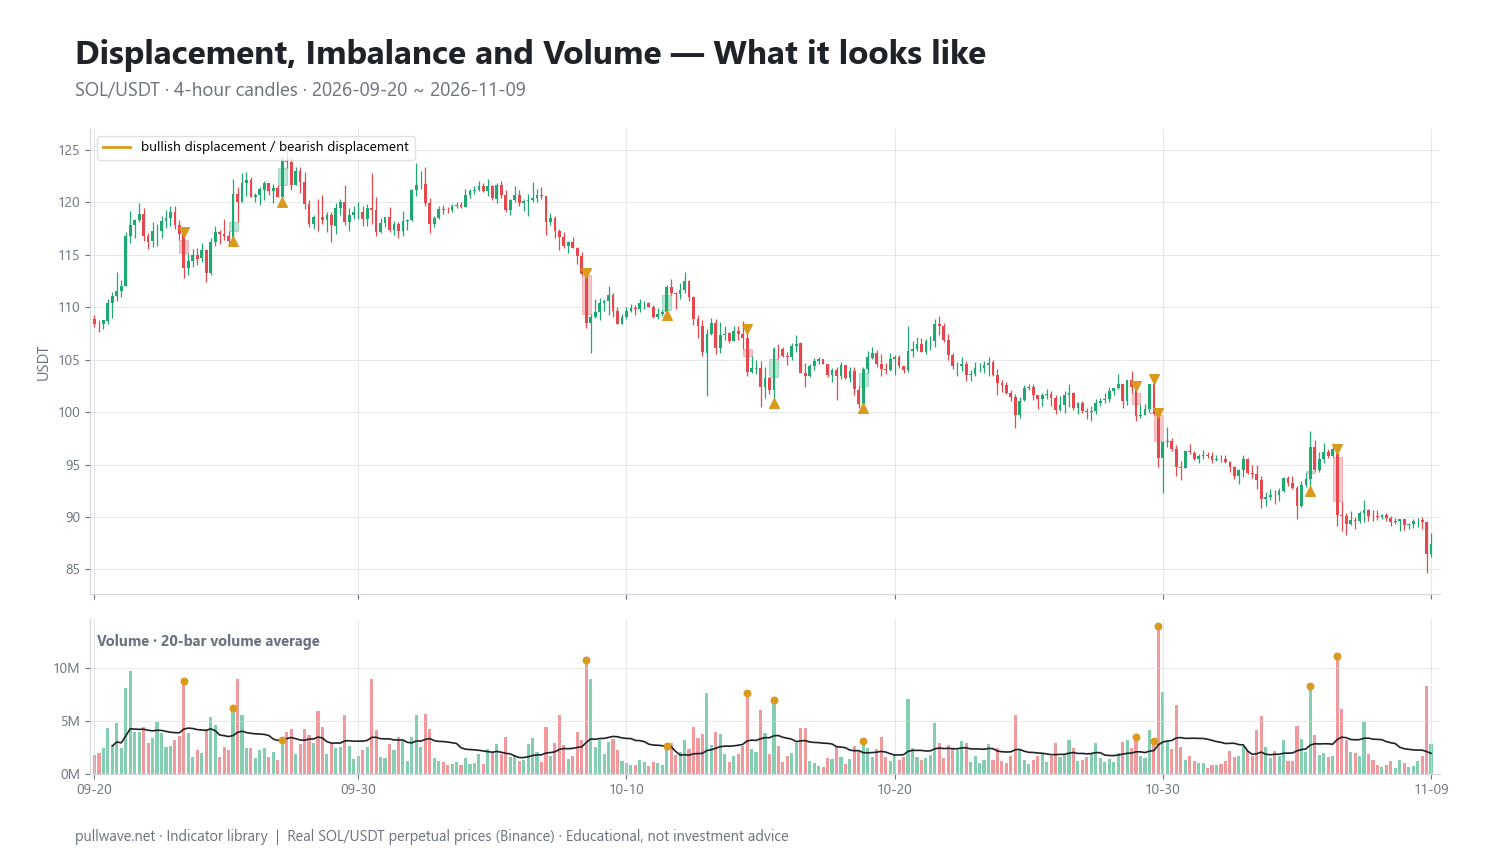
This page is the third lesson of the smart money deep dive on this site. It gives a mechanical definition you can actually test, shows the exact arithmetic for ATR-based displacement and for relative volume, explains how discretionary traders use the combination — and then reports, honestly, what the same rules produced on one real SOL/USDT 4h window. The chart below shows that window: displacement candles flagged with gold triangles, their imbalances shaded, and a volume panel underneath with the 20-bar average and the displacement bars highlighted.
What is Displacement, Imbalance and Volume?
Displacement is a directional expansion bar. Typical descriptions call for a large real body relative to recent range, a close in the top (or bottom) fraction of the candle's range, and a break through at least one prior swing point or consolidation. Proponents describe it as "urgency" — one side of the market is willing to pay through the book rather than wait. There is no single canonical threshold; different teachers use different wording, and some require a sequence of two or three candles rather than one.
Imbalance is the footprint displacement leaves. In the three-candle definition used by most SMC material, a bullish imbalance exists when the low of candle 3 is above the high of candle 1, so the middle candle's range contains prices that were never both bid and offered across neighbouring bars. A bearish imbalance is the mirror image. Because crypto trades 24/7, these are not weekend or opening gaps in the classical sense — they are intrabar inefficiencies visible only at a chosen timeframe. Drop to a lower timeframe and most of them partially fill in.
Volume, in this context, is the exchange's aggregate traded volume for that bar on that one market. It is not a buy/sell split, not order-book depth, and not a measure of institutional participation. Perpetual-futures volume and spot volume for the same coin differ, venues report differently, and some reported volume is noisy or inflated. The only honest statement relative volume supports is: this bar traded more contracts than this market's own recent average.
The idea behind it (theory and history)
The vocabulary comes from ICT — the "Inner Circle Trader", Michael J. Huddleston — and from the online community that grew around his material, mostly through videos and social media from roughly the mid-2010s onward. It is a discretionary chart-reading framework taught informally rather than a published, peer-reviewed method, and definitions drift between teachers: what one calls displacement another calls an expansion leg or an "energetic" move, and terms like market structure shift and change of character have swapped meanings over the years.
The narrative attached to displacement is that large participants cannot fill size passively, so they push price aggressively through resting liquidity, and the resulting imbalance marks the path they took. Proponents argue price later returns to "rebalance" that inefficiency before continuing. It is important to state plainly: this is the framework's hypothesis about order flow, not an established fact. Aggregate OHLCV data cannot identify who traded, and there is no independent evidence that displacement or imbalance patterns deliver a trading edge on their own.
The underlying observations, though, are old and well documented elsewhere. Richard Wyckoff's "effort versus result" — comparing the size of a move with the volume that produced it — dates to the early twentieth century, and later volume-spread analysis work built on it. Classical technical analysis has studied wide-range bars and gaps for decades; Toby Crabel's 1990 work on short-term price patterns formalised wide-range and narrow-range day comparisons. Swing-structure reading goes back to Dow theory. Displacement is, in substance, a volatility-normalised wide-range bar used as a structure-break filter; the SMC contribution is mainly the vocabulary and the routine of combining it with gaps and order blocks.
How it is calculated
The rules below are the ones used for the example later on this page. They are deliberately mechanical so that you — or a spreadsheet — can reproduce them without judgment.
Step 1 — measure recent volatility. Compute the Average True Range over 14 bars, and read it from the previous bar so the candle you are testing does not inflate its own benchmark. True range is the largest of: current high minus current low; the absolute difference between current high and previous close; the absolute difference between current low and previous close.
Step 2 — measure the body. Take the absolute difference between the candle's close and its open. Wicks are excluded on purpose: displacement is about where the bar settled, not how far it poked.
Step 3 — apply the size test. The body must be at least 1.5 times the previous ATR(14). This normalises for regime: 1.5x ATR in a quiet October means something very different in absolute dollars from 1.5x ATR after a liquidation cascade, but the same relative to context.
Step 4 — apply the close-location test. The close must land in the outer 30% of the candle's high–low range: at or above high − 0.3 × (high − low) for a bullish bar, at or below low + 0.3 × (high − low) for a bearish one. This removes big-range bars that gave everything back and closed mid-range.
Step 5 — check for the imbalance. Look at the candle before and the candle after. If the following candle's low sits above the preceding candle's high (bullish), or its high sits below the preceding candle's low (bearish), the displacement has left a three-candle gap in the same direction.
Step 6 — compute relative volume. Divide the candle's volume by the simple average of the previous 20 bars' volume. A value of 1.00 means an average bar; 2.00 means twice the recent norm.
``` TR = max(H-L, |H-Cprev|, |L-Cprev|) ATR14 = average(TR, 14) // read from the previous bar body = |close - open| size_ok = body >= 1.5 * ATR14_prev close_ok = (close >= high - 0.3(high-low)) // bullish or (close <= low + 0.3(high-low)) // bearish displacement = size_ok and close_ok
FVG_up = low[t+1] > high[t-1] FVG_down = high[t+1] < low[t-1]
RelVol = volume / SMA(volume, 20) ```
Follow-through, for testing purposes, needs its own definition. Here it is: the close six bars after the displacement is beyond the displacement candle's close in the displacement's direction. A second horizon of 18 bars is used to see whether the move simply needed more time.
Default settings and variations
| Parameter | Value used here | Why, and common alternatives |
|---|---|---|
| Volatility benchmark | ATR(14), previous bar | 14 is the conventional ATR period from Wilder's original work; 10 or 20 behave similarly. Some traders use a 20-bar standard deviation of returns instead. |
| Size threshold | body ≥ 1.5 × ATR | 1.5 is a compromise: 1.0 flags too many bars, 2.5–3.0 flags only crashes. Tighten it if you get dozens of signals a month. |
| Close location | outer 30% of range | Filters out failed expansions. Variants use "body ≥ 70% of range" or require no wick larger than the body. |
| Imbalance test | 3-candle FVG | Some require a minimum gap size (e.g. ≥ 0.25 × ATR) so that one-tick gaps don't count. |
| Relative volume | volume ÷ 20-bar SMA | 20 bars ≈ a few days on 4h, a month on daily. Alternatives: 50-bar average, median instead of mean (less distorted by one spike), or a volume z-score. |
| High-volume cutoff | RelVol ≥ 1.5 | Arbitrary but readable: "half again as busy as usual". 2.0 is also common. |
| Follow-through window | 6 bars, plus 18 bars | Should match your holding period. A scalper would use 3 bars; a swing trader 20–40. |
Discretionary users rarely compute any of this. They eyeball "that candle is much bigger than the others and it broke structure". The mechanical version exists so you can count outcomes instead of remembering the ones that worked.
How to read it
Read a displacement in four passes, in this order.
Where did it start? A displacement that begins from the edge of a range, immediately after a wick through an obvious high or low, is the version SMC literature treats as meaningful — the sweep-then-expand sequence. A displacement that begins in the middle of nowhere, after price has already run for several bars, is usually late continuation.
What did it break? Did the body close beyond a prior swing point, a range boundary, or an untested level? If it closed inside the same congestion it started in, the "urgency" interpretation is weak regardless of the candle's size.
What did it leave? Mark the imbalance — the price band between candle 1's extreme and candle 3's extreme. That band is the reference zone for any later retracement entry, and it is also the first thing to watch for invalidation: a quick, full fill on the next few bars argues the move was absorbed rather than accepted.
How busy was it? Read relative volume as context, not confirmation. High relative volume means more contracts changed hands than usual — which can be aggressive initiation, but can equally be forced liquidation, a funding-driven unwind, or stops cascading. Low relative volume on a large candle suggests the move happened through a thin book, which is common in crypto overnight hours and often retraces, though not reliably.
How traders use it
1. Validating a structure break. The most common use. A close beyond a prior swing high or low only counts as a break of structure or change of character if the candle that did it qualifies as displacement. Works when the market is transitioning out of a clean range into a trend — the filter removes the marginal one-tick breaks that litter sideways tape. Fails when volatility itself is expanding (post-news, cascades): then almost everything qualifies, and the filter stops filtering. It also fails in strong trends, where it systematically flags late entries after the move has already extended.
2. Qualifying an order block. In the framework, the last opposing candle before a displacement is an "order block", and a block created by displacement is treated as higher quality than one created by a sluggish turn. Works when the block sits at an independently meaningful level — a prior range edge, a weekly high, a point of control. Fails when the block is just the last red candle of a drift; the displacement label adds vocabulary, not information. Remember that identifying the block requires knowing the displacement happened, which you only know after it closes.
3. Trading the retracement into the imbalance. Mark the FVG and wait to see whether price returns into it and reacts. Works when the imbalance sits inside a larger trend and is the first retracement after a structural change — essentially a trend pullback entry with a well-defined invalidation point just beyond the gap. Fails when the market has flipped to range mode: in ranges, imbalances get filled routinely and the "reaction" is just mean reversion that continues straight through. It also fails when the gap is enormous, because the entry zone becomes so wide that position sizing and stop placement lose any precision.
4. Filtering with relative volume. Some traders only act on displacement with relative volume above a threshold, arguing that a thin-book move is less likely to hold. Works as a sanity check against 3 a.m. spikes on a single venue. Fails because volume is an ambiguous variable: a liquidation cascade prints enormous volume and frequently reverses hard once forced sellers are done. Treat volume as one input; the example below shows a window where the high-volume filter did not help at all.
Example on a real SOL chart
The test market is SOL/USDT perpetual on Binance, 4h candles, from 2026-09-20 to 2026-11-09, ending at a last close of 87.44. The rules are exactly those above: body ≥ 1.5 × previous ATR(14), close in the outer 30% of range, imbalance checked across three candles, relative volume against a 20-bar average, follow-through measured at 6 bars and again at 18.
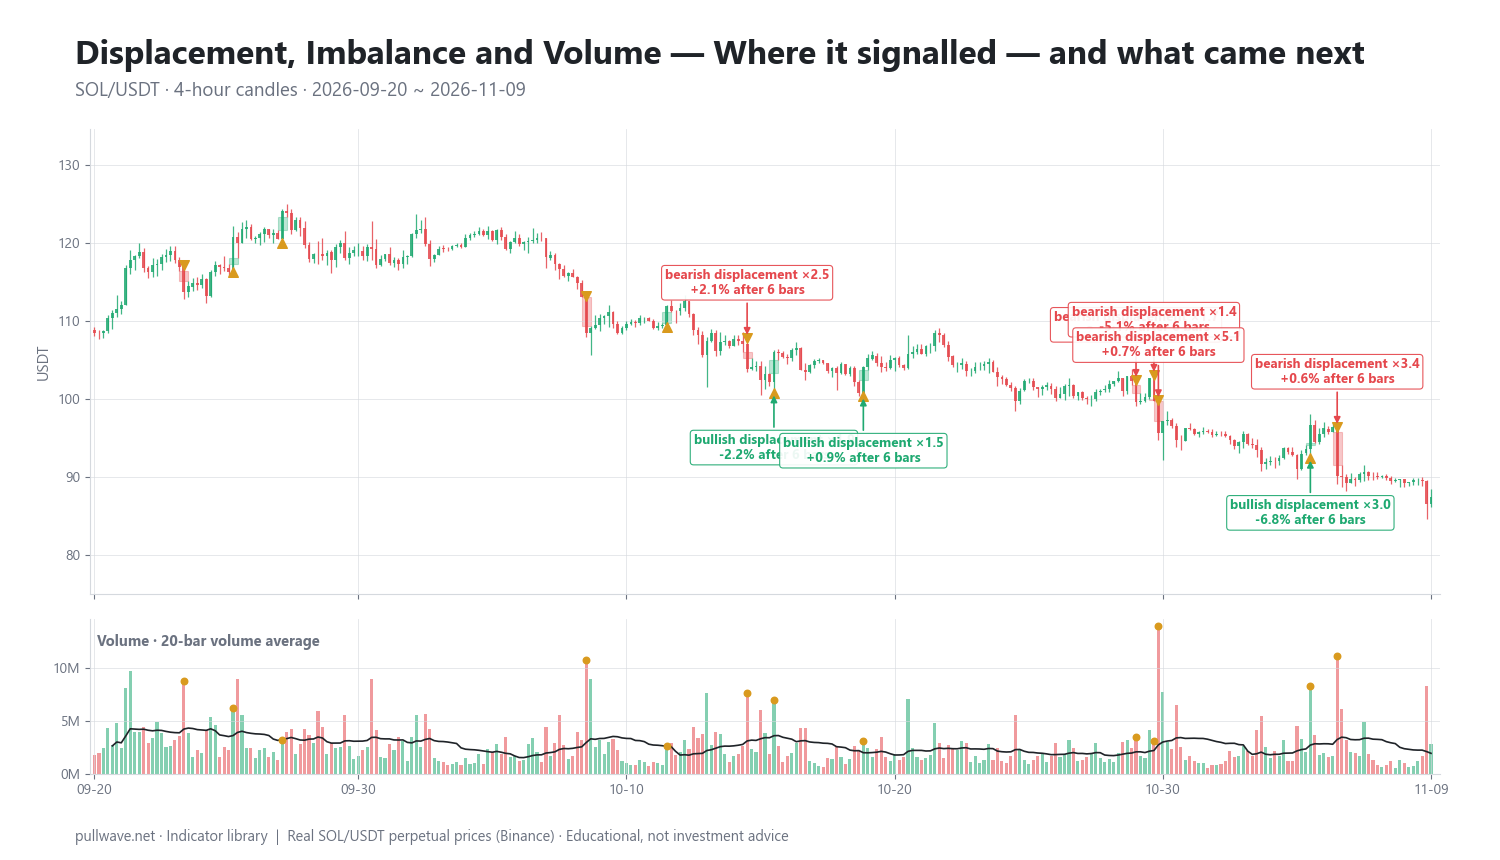
In that window the rules flagged 13 displacement candles, and all 13 left a three-candle gap in the same direction — unsurprising, since a body that large relative to ATR nearly always outruns the neighbouring bars. Their median relative volume was 1.94, against 0.84 for all candles in the window. That is the clearest result on the page: displacement bars really are busier than normal bars, by roughly a factor of two here. (A median below 1.0 for all candles is normal; volume distributions are skewed, so the median sits under the mean that the 20-bar average represents.)
Ten of the 13 had relative volume at or above 1.5. Of those high-volume displacements, 3 of 10 closed beyond the displacement close in the signal direction six bars later, with a median raw six-bar move of −0.89%. The three low-volume displacements produced 1 of 3 follow-through and a median six-bar move of −2.75%. Across all 13 events, 4 of 13 had moved in the signal direction after six bars. In this window, the volume filter did not improve anything — the small high-volume group actually did slightly worse by hit rate. With samples of 10 and 3, that comparison is statistically meaningless in both directions; it is reported because leaving it out would be dishonest, not because it proves volume is useless.
Here are ten of the flagged events with their relative volume multiple and the subsequent move:
| Date (UTC) | Event | Price | 6 bars | 18 bars |
|---|---|---|---|---|
| 2026-10-08 12:00 | bearish displacement ×3.6 | 108.50 | +1.07% | +3.17% |
| 2026-10-11 12:00 | bullish displacement ×1.0 | 111.94 | −2.75% | −7.25% |
| 2026-10-14 12:00 | bearish displacement ×2.5 | 103.82 | +2.14% | −0.25% |
| 2026-10-15 12:00 | bullish displacement ×1.9 | 106.04 | −2.19% | −3.65% |
| 2026-10-18 20:00 | bullish displacement ×1.5 | 104.07 | +0.92% | +2.72% |
| 2026-10-29 00:00 | bearish displacement ×1.7 | 99.64 | −2.46% | −4.09% |
| 2026-10-29 16:00 | bearish displacement ×1.4 | 99.78 | −5.09% | −5.84% |
| 2026-10-29 20:00 | bearish displacement ×5.1 | 95.62 | +0.71% | −1.16% |
| 2026-11-04 12:00 | bullish displacement ×3.0 | 96.69 | −6.75% | −7.43% |
| 2026-11-05 12:00 | bearish displacement ×3.4 | 90.16 | +0.60% | −0.52% |
A few readings worth drawing out. The 29 October cluster is instructive: three bearish displacements inside 20 hours, as SOL slid from 99.64 to 95.62. The first two continued (−2.46% and −5.09% at six bars); the third, by far the heaviest at ×5.1 relative volume, closed +0.71% higher six bars later and only −1.16% after 18. That is the classic exhaustion shape — the biggest volume print of the sequence arrived at the end of the move, not the start of a new one. Conversely, the ×1.0 bullish bar on 11 October — a displacement on exactly average volume — was followed by −2.75% and then −7.25%, a clean failure in the "low volume" bucket. The 4 November bullish displacement at ×3.0 was the single worst outcome in the table, −6.75% in six bars inside a market that was drifting down toward the 87.44 close.
That downward drift is the honest explanation for much of the table. In a window where price fell overall, bearish displacements had a tailwind and bullish ones faced a headwind, and the raw median six-bar moves are negative for both volume buckets largely for that reason. This is one market, one timeframe, one seven-week window, and one arbitrary set of thresholds. Change the ATR multiple from 1.5 to 2.0, or the follow-through horizon from 6 bars to 20, and the counts change. Nothing here shows that displacement works or that it does not.
Rebuilding the measurement yourself. You do not need code. Export OHLCV to a spreadsheet and add columns: true range; a 14-row average of it; the previous row's value of that average; ABS(close − open); a TRUE/FALSE size test; a TRUE/FALSE close-location test; a 20-row average of volume; volume divided by that average; and finally (close 6 rows down − close) / close, sign-adjusted for direction. Filter the sheet to displacement rows and you have your own version of the table above. On a charting platform the same logic fits in a few lines of a screener or indicator script: plot a marker when both conditions are true and shade the gap between the prior high and the following low. Doing this on three or four markets, across both a trending and a ranging quarter, teaches more than any amount of annotated screenshots — and costs nothing.
Common mistakes
- Marking displacement in hindsight. On a finished chart, the big candles that "worked" are obvious and the ones that failed fade into the background. Define the rule first, then count every instance, including the ugly ones.
- Treating volume as proof of intent. High relative volume says a bar was busy. It cannot distinguish accumulation from liquidation, hedging, market-making or a single large unwind. No OHLCV series identifies the participant.
- Using absolute size instead of relative size. A $4 SOL candle is huge in a quiet week and ordinary during a cascade. Always normalise by ATR or standard deviation.
- Ignoring where the displacement started. The same candle means different things at a range extreme after a liquidity sweep and in the middle of the fifth leg of a trend.
- Assuming every imbalance must fill. Many do; some never do, and the ones in strong trends can take hundreds of bars. "Price always rebalances" is a slogan, not a rule, and waiting for a fill that never comes is how traders miss entire moves.
- Chasing the close. Entering at the close of a vertical candle puts your stop far away, which forces either an oversized risk or an unrealistically tight invalidation. The framework's own answer is to wait for the retracement into the gap.
- Over-filtering until nothing qualifies. Stacking displacement + volume + session + structure + Fibonacci can reduce a year to four signals, which is far too few to evaluate.
- Forgetting leverage mechanics. On perpetuals, the candles with the biggest bodies and highest volume are frequently liquidation-driven. Entering in that direction with leverage means joining the move at its most volatile point.
Combining it with other tools
Displacement is a filter, not a system; it is only as good as the context it is applied to. Within this deep-dive series, the natural pairings are market structure (displacement is the quality test for a break of structure or change of character), order blocks (the opposing candle before the displacement), fair value gaps (the imbalance itself is the entry zone), liquidity sweeps (the sweep → displacement → change-of-character sequence is the series' core setup), and premium/discount with OTE, which tells you whether the retracement into the gap is happening in a sensible part of the larger range. Kill zones add a time filter, breaker blocks handle the case where the displacement later fails, and equal highs/lows mark the liquidity a displacement is likely to run toward. A top-down multi-timeframe pass keeps you from trading a 15-minute displacement against a daily trend.
Outside the framework, the useful companions are older and better documented. ATR gives you the volatility benchmark the whole definition depends on, and also a sane stop distance. A longer moving average or simple higher-high/higher-low test tells you whether you are in the regime where continuation setups have any chance. Session or anchored VWAP gives an independent reference for "expensive" and "cheap" that does not depend on your own drawings. On perpetuals, open interest and funding add real, exchange-published context: a large candle accompanied by falling open interest is more consistent with positions being closed out than with fresh conviction, though even that is an inference rather than a fact.
Finally, keep the crypto specifics in view. There are no session gaps in a 24/7 market, so every imbalance is a timeframe artefact. Weekend and low-liquidity hours produce displacement on thin books. Funding resets and scheduled macro releases cluster large candles at predictable times. And because leverage is easy to access, the largest, highest-volume bars are often the least representative of steady demand or supply.
Frequently asked questions
Q. What is displacement in ICT trading?
Displacement is a strong, one-directional candle or short sequence of candles that expands well beyond recent range and closes near its extreme, usually leaving a three-candle imbalance (fair value gap) behind. ICT and SMC traders use it as a quality filter: a structure break or an order block "counts" if displacement created it. The underlying claim that it reveals institutional urgency is the framework's hypothesis, not a verified fact.
Q. How big does a candle have to be to count as displacement?
There is no official threshold, which is why a mechanical rule helps. A common, testable definition is a real body of at least 1.5 times the previous ATR(14) with the close in the outer 30% of the candle's range; stricter traders use 2x or 2.5x ATR, or require the body to be at least 70% of the total range. Whatever you choose, keep it fixed and measure it relative to recent volatility rather than in absolute price terms.
Q. What is the difference between displacement and an imbalance or fair value gap?
Displacement describes the candle — the move itself. The imbalance or fair value gap describes the void it leaves on the chart, defined by the three-candle rule: candle 3's low above candle 1's high for a bullish gap, candle 3's high below candle 1's low for a bearish one. In practice displacement nearly always produces an imbalance; in the SOL window on this page, all 13 displacement candles did.
Q. Does high volume confirm a displacement candle?
High relative volume tells you a bar traded more than its own recent average, nothing more — it cannot show who traded or why, and aggregate OHLCV contains no buy/sell split. In the SOL/USDT 4h window described here, displacement bars had a median relative volume of 1.94 versus 0.84 for all candles, but the ten high-volume displacements showed follow-through in only 3 of 10 cases. Volume is useful context; it is not confirmation.
Q. How do I calculate relative volume?
Divide the current bar's volume by the simple average of the previous 20 bars' volume on the same timeframe and market. A result of 1.0 is a typical bar, 2.0 is twice the recent norm, and values below 0.7 mark unusually quiet trade. Use a median instead of a mean if single spikes distort your average, and never compare relative volume across different venues or between spot and perpetual markets.
Q. Which timeframe is best for spotting displacement in crypto?
There is no universally best timeframe; the useful ones are those where your ATR-based rule flags a handful of candles per month rather than several per day. For swing traders, 4h and daily give manageable counts and fewer thin-liquidity artefacts; intraday traders typically use 5m to 1h but should expect many more false signals around funding resets and news. Because crypto trades 24/7 with no session gaps, the imbalances you see exist only at the timeframe you are viewing.
Key takeaways
- Displacement is a volatility-normalised wide-range bar: a large body relative to ATR, a close near the extreme, and almost always a three-candle imbalance left behind.
- Define it mechanically (for example, body ≥ 1.5 × previous ATR(14), close in the outer 30% of range) so you can count every occurrence instead of remembering the good ones.
- Relative volume — volume divided by its own 20-bar average — only says a bar was busier than usual; it never identifies who traded or proves "smart money" involvement.
- In one SOL/USDT 4h window, 13 displacement candles all left gaps and had a median relative volume of 1.94 versus 0.84 for all bars, yet only 4 of 13 closed in the signal direction after six bars, and the high-volume subset did no better.
- Treat displacement as a context filter inside a larger framework — structure, liquidity, premium/discount, higher-timeframe bias — and test it on your own charts before it influences any risk.
Educational material. Charts use real SOL/USDT perpetual prices; past behaviour does not predict future results. Not investment advice.