Indicator & technique library · Smart money deep dive
Premium, Discount and OTE Zone: Rules, Levels, Example
At a glance
- A dealing range is split by its 50% midpoint: above it is premium (expensive), below it is discount (cheap).
- The OTE band is the 62%-79% retracement of a chosen impulse leg - in other words a renamed Fibonacci retracement zone.
- Everything depends on which leg you pick, so two traders can mark completely different OTE zones on the same chart.
- On SOL/USDT 4h (16 Sep - 9 Nov 2026), 19 of 24 mechanically defined legs saw price touch the 62% line, but only 9 of those 19 continued - a coin-flip-sized sample, not an edge.
Premium, discount and the "OTE" (optimal trade entry) zone are the pricing language of the smart money concepts (SMC) framework. The idea is simple: once you decide which swing high and swing low define the range you are trading, everything above the midpoint is expensive (premium) and everything below it is cheap (discount). The OTE band is a narrower slice of that range - the 62% to 79% retracement of the leg - where many discretionary traders look for entries in the direction of the prior move.
Traders care about it because it answers a question every entry method has to answer: where in the move do you get involved? Chasing breakouts gives you confirmation but a wide stop; waiting for a deep retracement gives you a tight stop but a higher chance the move is over. Premium/discount and OTE are a structured way to argue for the second option. They are also, stripped of the vocabulary, a Fibonacci retracement - and that is worth knowing from the start.
The chart below shows the concept as it is normally drawn: real SOL/USDT 4h candles with swing-to-swing legs marked as dashed lines, the 62%-79% retracement band shaded back from the end of each leg, and the 50% equilibrium as a dotted line.
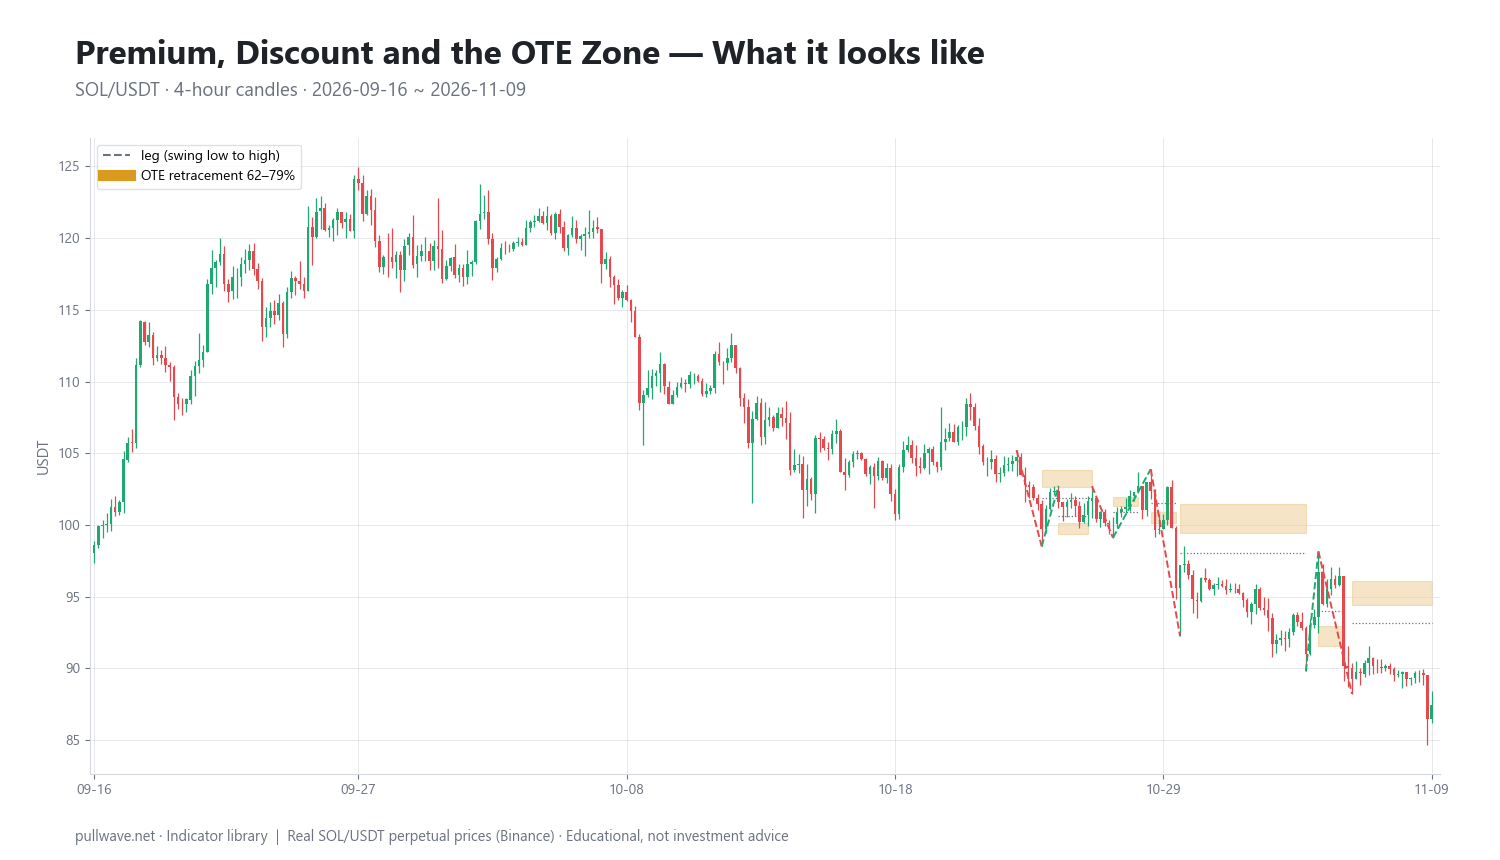
What is Premium, Discount and the OTE Zone?
A dealing range is the price span between two reference points you choose - usually a significant swing low and the swing high that followed it (or the reverse). The range is not a fact about the market; it is a frame you impose on the chart.
Equilibrium is the 50% level of that range. Proponents treat it as fair value for the range: price above equilibrium is in premium, price below is in discount. The practical rule most SMC traders state is "buy in discount, sell in premium" - meaning if your bias is bullish you want to be entering below the midpoint of the range, not above it.
The OTE zone is a sub-band of the retracement: the area between the 62% and 79% retracement of the impulse leg, measured back from the leg's end. For a bullish leg (low to high), the OTE sits in the lower part of the range - deep in discount. For a bearish leg (high to low), it sits high in the range - deep in premium. Some teachers add a "sweet spot" near 70.5%, roughly the midpoint of 0.618 and 0.786.
So the complete idea is a bias filter plus an entry zone: the dealing range tells you which half of the move you are allowed to trade from, and the OTE narrows that to a band where the retracement is deep enough to give a tight invalidation but not so deep that the original move is likely finished.
The idea behind it (theory and history)
The arithmetic is old. Classical Dow-theory writing already described secondary reactions as typically retracing roughly one-third to two-thirds of the preceding primary move - the same observation that later became a grid of retracement percentages. The 50% level in particular has been a staple of technical analysis for a century, long before anyone called it "equilibrium".
The specific numbers 0.618 and 0.786 come from the Fibonacci family. 0.618 is the reciprocal of the golden ratio (1.618); 0.786 is the square root of 0.618. Fibonacci ratios entered market analysis mainly through R. N. Elliott's wave work in the late 1930s and 1940s, were popularised again by Frost and Prechter's Elliott Wave Principle (1978), and the deeper 0.786/0.886 levels became standard in the harmonic-pattern literature (H. M. Gartley's 1935 Profits in the Stock Market for the patterns, later authors for the ratio overlay). In other words, the OTE band is a Fibonacci retracement zone under a new name. The 62% figure is simply 0.618 rounded.
The modern vocabulary - premium, discount, equilibrium, optimal trade entry - was popularised by Michael J. Huddleston, who teaches online as "Inner Circle Trader" (ICT), mostly through videos from around the mid-2010s onward, and then spread through the broader "smart money concepts" community. Usage varies between teachers: some define OTE as 0.618-0.786, some as 0.705-0.79, some include 0.886 as a last-chance level, and some apply premium/discount only to the current dealing range while others nest it across timeframes.
The rationale that proponents give is an order-flow story: large participants are said to accumulate in discount and distribute in premium, and to push price back into the retracement to fill orders and take out stops before continuing. That is a hypothesis about market mechanics, not an established fact. There is no peer-reviewed or independent evidence that premium/discount zoning or the 62-79% band produces a trading edge, and no public data showing that institutional orders cluster there. What is defensible is the weaker, mechanical version: deep retracements into prior swing territory are common, they often coincide with prior support/resistance, order blocks and unfilled gaps, and entering nearer to the origin of a move gives a better reward-to-risk ratio if the move resumes. The overlap with Wyckoff springs and upthrusts, with simple support/resistance, and with Fibonacci retracements is substantial and worth acknowledging.
How it is calculated
Step by step, with nothing hidden:
- Choose the leg. Identify two consecutive significant swing points - a swing low and the swing high that followed (bullish leg), or a swing high and the swing low that followed (bearish leg). A "swing point" usually means a fractal: a bar whose high is higher than the highs of n bars on each side (or low lower than the lows).
- Measure the range. R = high − low. This is the leg, and also the dealing range.
- Mark equilibrium. EQ = low + 0.5 × R. Above it is premium, below it is discount. (Both halves refer to the same range - change the range and the labels change.)
- Project the retracement from the leg's end back toward its start. For a bullish leg you measure down from the high; for a bearish leg you measure up from the low.
- Shade the OTE band between the 62% and 79% retracement levels.
- Define invalidation. Normally the leg's origin: for a bullish leg, a close below the swing low that started it.
``` R = swing_high - swing_low # the leg / dealing range EQ = swing_low + 0.50 * R # equilibrium (50%) premium : price > EQ discount : price < EQ
Bullish leg (low -> high), retracement measured DOWN from the high: level(r) = swing_high - r * R OTE = [ swing_high - 0.79R , swing_high - 0.62R ]
Bearish leg (high -> low), retracement measured UP from the low: level(r) = swing_low + r * R OTE = [ swing_low + 0.62R , swing_low + 0.79R ] ```
A hypothetical bullish leg makes the arithmetic concrete: a swing low at 100 and a swing high at 150 give R = 50, equilibrium at 125, the 62% level at 150 − 0.62×50 = 119, and the 79% level at 150 − 0.79×50 = 110.5. The OTE band is 110.5 to 119, the whole band sits in discount, and invalidation for a long idea is a close below 100. Note the risk geometry: the band is 8.5 points wide and the distance to invalidation from the top of the band is 19 points, from the bottom 10.5 points - where inside the band you act changes your risk by almost half.
Default settings and variations
| Level | Common name | Typical use |
|---|---|---|
| 0.50 | Equilibrium | Divides the range into premium and discount; bias filter |
| 0.618 (62%) | Shallow edge of OTE | First entry level; shallowest acceptable retracement |
| 0.705 | "Sweet spot" / mean threshold | Midpoint of the band, used by traders who want one line instead of a zone |
| 0.786 (79%) | Deep edge of OTE | Last entry level before the move looks failed |
| 0.886 | Deep retracement | Used by some as a final level; harmonic-pattern heritage |
| 1.0 | Leg origin | Standard invalidation point |
| Leg end / extensions | Targets | Prior swing, then −0.27 / −0.62 extensions in some variants |
The defaults exist for ratio reasons, not statistical ones: 0.618 is the golden ratio reciprocal, 0.786 its square root, 0.5 the simple midpoint. Nobody optimised them on data; they were inherited from Elliott-wave and harmonic practice. Treat them as conventional round numbers that many chartists watch, which is itself a weak reason for levels to matter.
Common variations you will see:
- Band width. 0.618-0.786 is the classic OTE. Others use 0.5-0.786 ("the discount array"), or 0.705-0.79 for a tighter zone.
- Leg definition. Some use the most recent clean impulse; some use the swing that created the current market structure shift; some use the range of an entire session or week.
- Nested ranges. Daily range for bias, 4h or 1h leg for the entry band. A level can be discount on the 1h leg and still deep premium on the daily range - the higher timeframe usually wins the argument.
- Mechanical versions. For testing, you need objective swings: a fractal of n bars on each side, plus a minimum leg size in ATR units so that noise does not create legs. That is exactly what the example below uses.
How to read it
Reading a marked chart is a three-question process.
First: which range am I in? Find the two swing points that frame the move you actually care about on your timeframe. If price is above equilibrium, you are in premium - selling is "cheap" relative to the range and buying is late. Below equilibrium, the reverse. If price is sitting within a few percent of equilibrium, the frame is giving you nothing; that is the most common honest reading.
Second: has price reached the OTE band of the last impulse? A retracement that stalls at 38% or 50% never gave you the entry the framework describes; a retracement that slices through 79% and closes beyond the leg's origin has invalidated it. The band is the narrow middle case.
Third: what is price doing inside the band? This is where discretionary traders add confirmation - a lower-timeframe structure shift, a rejection wick, a reaction from an order block or a fair value gap that happens to sit inside the band. The band alone is a location, not a signal. A chart where price simply drifts through 62%, 70% and 79% on small bodies is telling you the retracement has momentum of its own.
One more reading habit: compare where the OTE sits relative to prior structure. A band that overlaps an old breakout level or an unfilled gap is a more interesting location than a band floating in empty space - not because the Fibonacci number is stronger, but because several independent reasons point to the same area.
How traders use it
1. Continuation entry after a structure shift. The textbook sequence: liquidity sweep → market structure shift (change of character) → retracement into the OTE of the new impulse leg → entry with a stop beyond the leg's origin. Works best in a clean trending regime on a liquid market where impulses are followed by shallow, orderly pullbacks. Fails in ranges, where every "impulse" is just the range travelling from one side to the other and the 62-79% retracement is simply the middle of chop. It also fails after news-driven vertical moves that never retrace at all.
2. Bias filter - "no longs in premium". Many traders use premium/discount not for entries but as a veto: if the daily range puts price in the upper third, they will not take long setups, however good the lower-timeframe pattern looks. Works because it mechanically stops you buying highs late in a move and improves average entry price. Fails in strong trends, where price can stay in premium for weeks and the filter keeps you out of the best part of the move. This is the classic trade-off of any mean-reversion filter applied to a trending asset.
3. Risk geometry and position sizing. Entering at 70% of a leg with invalidation at 100% means risking 30% of the leg to target, at minimum, the leg's end - a nominal 1:2.3 structure before fees. Some traders use OTE purely for this: it is a reproducible way to get a defined, relatively small risk distance. Works if your stop is genuinely placed beyond the structure and sized sensibly. Fails when the tight distance tempts traders to raise leverage until a normal wick liquidates the position - a crypto-specific trap discussed below.
4. Scaling and exits. Used in reverse: if you are long from a discount entry, premium becomes the area to reduce. Equilibrium of the next larger range is a common partial-exit point. Works in ranging markets, where fading extremes is the dominant behaviour. Fails in expansion phases, where taking profit at equilibrium means exiting at the start of the real move.
Example on a real SOL chart
To show what the concept looks like when it is measured rather than eyeballed, here is one window on one market: SOL/USDT perpetual on Binance, 4h candles, 16 September to 9 November 2026, last close 87.44.
The rules were fixed in advance and applied mechanically: a leg is two consecutive swing points (fractal with 5 bars on each side) at least 2.5 × ATR14 apart; the OTE band is the 62%-79% retracement of that leg measured from the leg's end; a "touch" is the first later wick into the 62% line within 80 bars; the outcome is "continued" if price exceeded the leg's end before closing beyond the leg's start, within 60 bars of the touch, and "failed" otherwise.
Results in that window:
- 24 legs met the size filter.
- 19 of 24 (79.2%) saw price trade back into the 62% line.
- Of those 19 touches, 9 continued, 10 failed, 0 unresolved.
- Measuring price change after the touch instead of structure, 12 of 19 touches had moved in the direction of the touch after 6 bars (one trading day on a 4h chart).
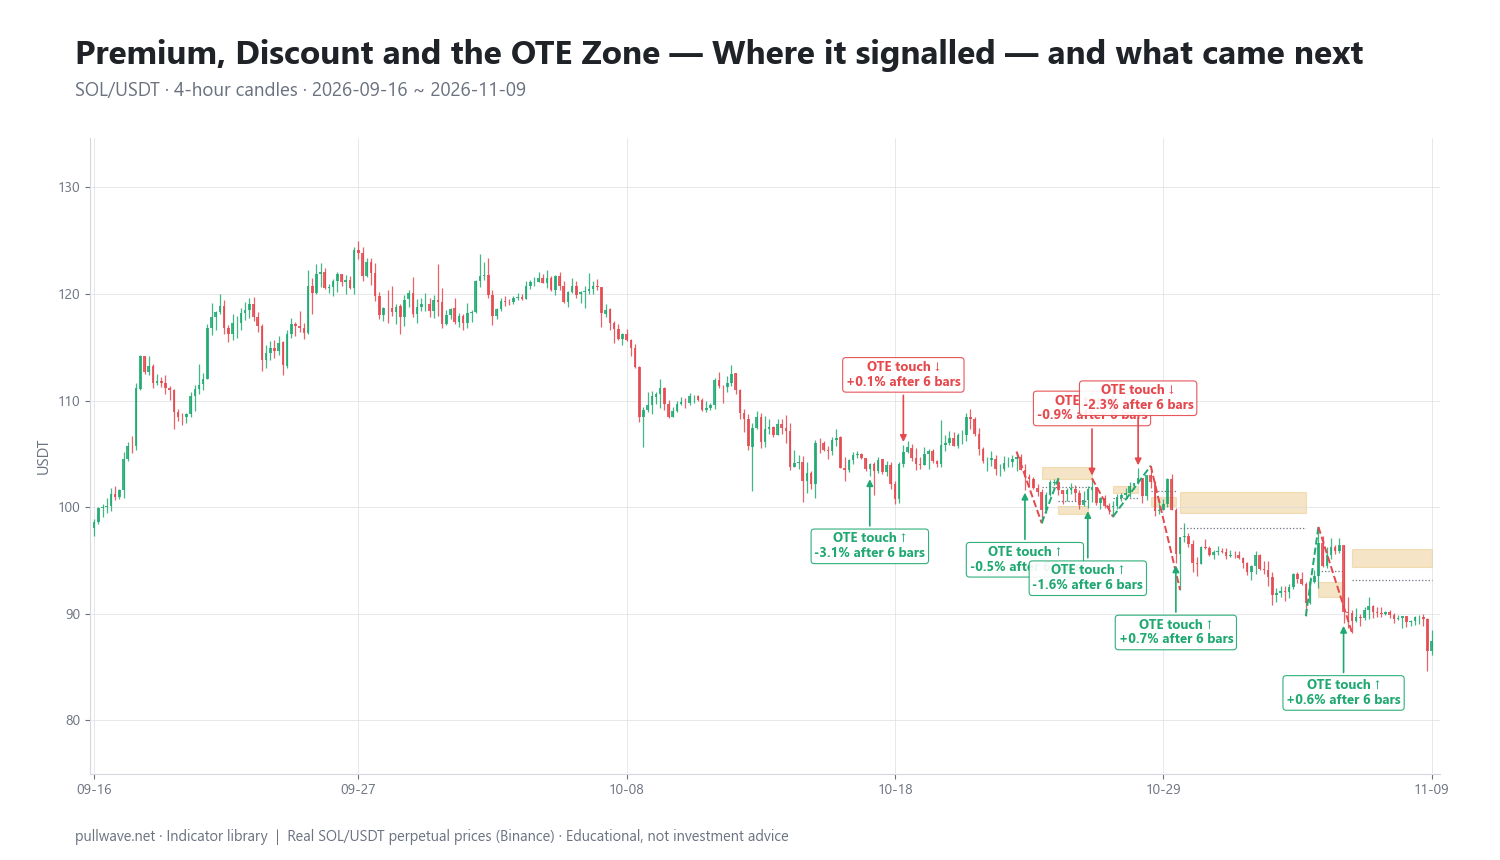
The figure marks each first touch of the OTE band and the percentage move six bars later. Here are ten of the nineteen touches, with the 6-bar and 18-bar changes:
| Date (UTC) | Touch | Price | After 6 bars | After 18 bars |
|---|---|---|---|---|
| 2026-10-15 08:00 | up leg | 102.14 | +4.31% | +1.77% |
| 2026-10-16 00:00 | down leg | 105.28 | −0.34% | −0.06% |
| 2026-10-17 16:00 | up leg | 104.04 | −3.13% | +1.91% |
| 2026-10-19 00:00 | down leg | 105.22 | +0.06% | +0.24% |
| 2026-10-23 20:00 | up leg | 102.79 | −0.45% | −1.83% |
| 2026-10-26 08:00 | up leg | 101.67 | −1.56% | −1.31% |
| 2026-10-26 12:00 | down leg | 101.86 | −0.92% | +0.79% |
| 2026-10-28 08:00 | down leg | 102.71 | −2.31% | −6.70% |
| 2026-10-29 20:00 | up leg | 95.62 | +0.71% | −1.16% |
| 2026-11-05 12:00 | up leg | 90.16 | +0.60% | −0.52% |
What this illustration actually shows:
Touches are common; continuation is not. Nearly four out of five legs got the retracement the framework expects, which mostly tells you that deep pullbacks are normal on a 4h crypto chart. The follow-through split - 9 continued, 10 failed - is as close to a coin flip as a sample can get, and 19 events is far too few to conclude anything either way.
Direction of the market mattered more than the band. Mid-October touches cluster around 102-105, and the window ends with a close at 87.44. Against that backdrop, the bearish touch on 28 October at 102.71 produced the largest 18-bar move in the listed subset (−6.70%, after −2.31% at six bars), while several bullish touches at similar prices went nowhere or reversed. A level can be deep discount on its own 4h leg and still be premium within the larger downswing - exactly the nesting problem described earlier. Note the counterpoint in the same table: the largest 6-bar move belongs to a bullish touch (+4.31% on 15 October), which is a reminder that ten events in a two-month window support stories, not conclusions.
Overlapping legs produce contradictory signals. On 26 October the rules generated an up-leg touch at 101.67 (08:00) and a down-leg touch at 101.86 (12:00) - two opposite "signals" four hours apart at essentially the same price. In discretionary practice a trader would have picked one leg and never seen the conflict; the mechanical version makes the ambiguity visible.
Time horizon changes the picture. The 17 October touch is −3.13% at 6 bars and +1.91% at 18 bars; the 26 October 12:00 touch is −0.92% then +0.79%. Whether an entry "worked" depends entirely on where the stop and target sat.
Treat this as one illustration on one symbol, one timeframe and one eight-week window, generated by one arbitrary set of swing rules. Change the fractal from 5 bars to 3, change the 2.5 × ATR filter, or measure the OTE from a weekly range instead, and the legs, touches and outcomes all change. It is not evidence that the tool works, and it is not evidence that it does not.
Common mistakes
- Picking the leg after the fact. This is the big one. On a finished chart there is always a leg whose 62-79% band contains the reversal you already know about. Mark your legs before the retracement happens, or you are grading your own homework.
- Ignoring the higher-timeframe range. Buying the discount of a 1h leg while the daily range has price in deep premium is one plausible reason a touch fails - but it is a hypothesis, not something the SOL test above measured. That test looked only at 4h legs and recorded no higher-timeframe context for the ten failed touches, so nobody should claim it explains them.
- Treating the band as a signal. The OTE is a location. Without something else - a structure shift, a rejection, volume behaviour - you are buying a number on a ruler.
- Moving the stop inside the leg. Putting the stop at 86% "to improve the R:R" removes the invalidation logic. If the leg's origin is the invalidation, that is where the risk is.
- Over-leveraging the tight distance. A 3% stop looks like an invitation to use 10x. In crypto, a single liquidation cascade can wick 5-10% through your level and return within an hour; the position is gone either way.
- Forcing it in ranges. In a sideways market every swing produces a leg, every leg produces an OTE, and the bands overlap into mush. A simple regime check (is price making higher highs and higher lows on the timeframe above?) removes most of these.
- Confusing a touch with a trade. In the sample, 79.2% of legs produced a touch. A high touch rate is not a high win rate.
- Redrawing until it fits. If you find yourself adjusting the swing points while in a position, the framework has stopped describing the market and started describing your hope.
Combining it with other tools
Premium/discount is a location tool, so it pairs naturally with timing and confirmation tools. Within this deep-dive series, the most common combinations are:
- Market structure and the change of character. A retracement into OTE after a confirmed structure shift at least tells you which direction you are trading with; OTE in isolation does not.
- Order blocks and fair value gaps. When the last down candle before an up move, or an unfilled imbalance, sits inside the 62-79% band, discretionary traders treat that as confluence. It is really a restatement that several ways of marking the same area agree.
- Liquidity sweeps and equal highs/lows. A sweep of an obvious stop cluster that lands inside the OTE band is the framework's most-taught sequence. Proponents argue that this is deliberate order flow; a more neutral reading is that prior extremes attract orders and that clustered stops create short, sharp moves.
- Displacement and imbalance. Measuring the leg from a displacement candle rather than from any swing makes leg selection less arbitrary - a useful discipline even if the labels are informal.
- Volume. Declining volume through the retracement and expanding volume on the reaction is the Wyckoff-style check that a pullback is a pullback and not a reversal.
- Top-down multi-timeframe work. Define the range on the higher timeframe, the leg on the trading timeframe, the trigger below that. This is the single most effective fix for the nesting error.
- Classical indicators. ATR for stop distance and position sizing; a long moving average for regime; RSI or momentum divergence as a sanity check that a retracement is losing steam. None of these conflict with the SMC vocabulary - they measure different things.
Crypto specifics change the practical details. Markets trade 24/7, so there are no session gaps and no overnight ranges; the "kill zone" session logic imported from futures markets applies loosely at best. Perpetual futures add funding costs that accumulate against you while you wait inside a range, and leverage turns a routine wick beyond 79% into liquidation. Thin alt books make the exact tick of a level meaningless - treat the band as a zone and expect overshoot. And on 4h or lower charts in crypto, weekend liquidity can produce moves that no structural framework anticipates.
If you want to test the idea yourself without risking money: fix your swing definition in writing, mark 40-50 legs on historical charts you have not studied, record the outcome by a fixed rule (did price reach the leg's end before invalidation?), and only then compare with a null benchmark - for example, random entries at the same times with the same stop and target. Do it forward on a paper account too, because hindsight leg selection is the single largest source of false confidence here.
Frequently asked questions
Q. What do premium and discount mean in trading?
Premium and discount describe where price sits inside a chosen dealing range. The range's 50% midpoint is called equilibrium; above it price is in premium (expensive relative to the range) and below it price is in discount (cheap relative to the range). The labels are entirely relative to the swing high and swing low you selected, so a different range produces different labels for the same price.
Q. What is the OTE (optimal trade entry) zone and which levels does it use?
The OTE zone is the 62% to 79% retracement of an impulse leg, measured back from the end of that leg. For a bullish leg it sits deep in discount, for a bearish leg deep in premium, and some traders mark the ~70.5% midpoint as the preferred line. The name was popularised through the ICT/smart money concepts community; the levels themselves are standard Fibonacci retracements.
Q. Is the OTE zone just a Fibonacci retracement?
Essentially yes. 0.618 is the reciprocal of the golden ratio and 0.786 is its square root, both long-standing Fibonacci retracement levels used in Elliott wave and harmonic pattern analysis decades before the OTE label existed. What the SMC framing adds is a procedure - pick the leg after a structure shift, require the band to be in discount or premium of the larger range, and look for confirmation inside the band - not new mathematics.
Q. How do I choose the right leg to draw the range from?
There is no objective answer, and that is the honest weakness of the method. Practical discipline: use the most recent impulse that created or confirmed the current market structure on your trading timeframe, require it to be meaningfully larger than recent noise (for example at least 2-2.5 × ATR), and mark it before the retracement develops. If you have to redraw the leg to justify a trade, the setup is not there.
Q. Does premium/discount and OTE work in crypto?
There is no independent evidence that it produces an edge in any market, crypto included. In the measured SOL/USDT 4h window on this page, 19 of 24 mechanically defined legs were retraced into the 62% line but only 9 of those 19 continued - a coin-flip result on a small sample. What the concept reliably provides is a consistent way to define entry location and invalidation, which is a risk-management benefit rather than a predictive one.
Q. What timeframe should I use for premium, discount and OTE in crypto?
Most traders use at least two: a higher timeframe (daily or 4h) to define the dealing range and bias, and a lower one (1h or 15m) to find the leg and the entry trigger. Because crypto trades 24/7 with no session gaps, very low timeframes produce many legs and many contradictory bands - the 26 October example on this page shows two opposite touches four hours apart. Fewer, larger ranges generally give cleaner readings than many small ones.
Key takeaways
- Premium and discount are positions inside a dealing range you choose: above the 50% equilibrium is premium, below it is discount, and the labels change if the range changes.
- The OTE band is the 62%-79% retracement of a leg - a Fibonacci retracement zone with newer vocabulary, not a new calculation.
- Its real, defensible benefit is risk geometry: a defined entry location with invalidation at the leg's origin. The order-flow story about smart money accumulating in discount is the framework's hypothesis, not established fact.
- Leg selection is the weak point. On a finished chart there is always a leg that fits; mark legs before the retracement, and test your rules mechanically before trusting them.
- In the SOL/USDT 4h window measured here, 79.2% of legs saw a touch of the 62% line but only 9 of 19 touches continued. That is one illustration on one market and window - treat it as a lesson in sample size, not as proof in either direction.
Educational material. Charts use real SOL/USDT perpetual prices; past behaviour does not predict future results. Not investment advice.