Indicator & technique library · Smart money deep dive
Equal Highs and Lows: Liquidity Pools Explained
At a glance
- Equal highs and lows are two or more swing points that stall at almost the same price, leaving a flat level every chart reader can see.
- Smart money concepts traders call that level a liquidity pool because stop and breakout orders are assumed to rest just beyond it — a hypothesis about order placement, not a proven fact.
- Repeatable marking needs four written rules: swing detection, a price tolerance (here 0.25 x ATR14), a spacing range, and nothing higher or lower in between.
- In one 4h SOL/USDT window, 7 of 9 pools (77.8%) were taken within 80 bars, but only 2 of 7 events moved in the fade direction six bars later.
Equal highs and equal lows are the simplest structure in the whole smart money vocabulary: two or more swing points that stop at almost exactly the same price, leaving a flat ceiling or a flat floor on the chart. Traders who use the smart money concepts (SMC) framework call that flat line a liquidity pool, and abbreviate it EQH (equal highs) and EQL (equal lows).
The reason traders care is mechanical rather than mystical. An obvious level is obvious to everyone, so protective stops from existing positions and breakout orders from new ones tend to sit just beyond it. When price reaches that area a cluster of orders is triggered — and what happens in the bar after the trigger is where the entire discussion lives.
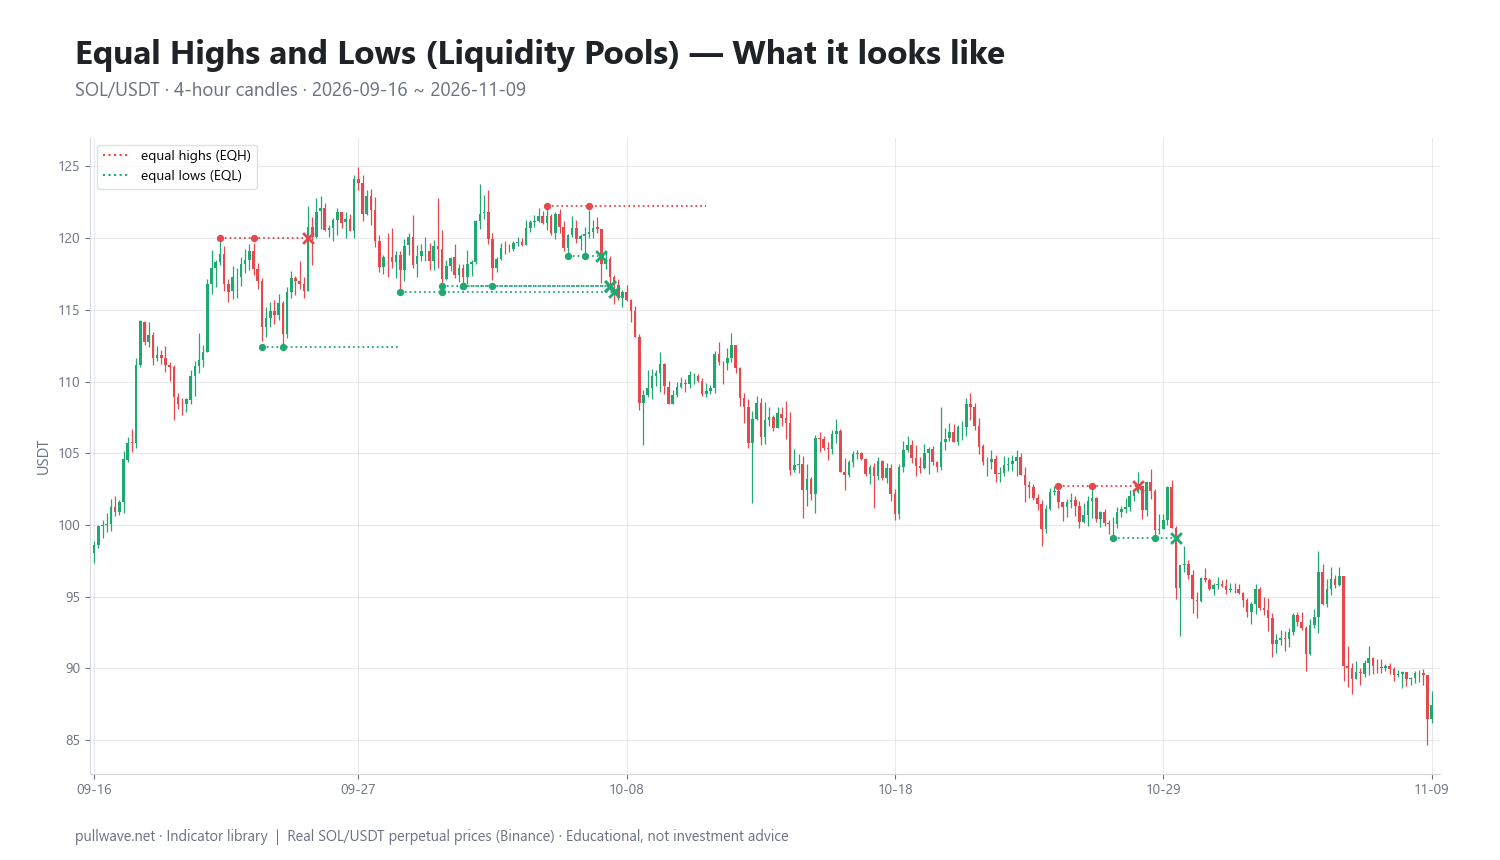
Figure 1 shows real SOL/USDT 4h candles with dotted lines drawn through pairs of equal swing highs and equal swing lows, and an X marking the later wick that pushed beyond each level. Note how flat the levels are, how visible they would have been at the time, and how often price eventually came back to them.
What is Equal Highs and Lows (Liquidity Pools)?
Equal highs are two swing highs that terminate within a small tolerance of each other, with no higher high between them. Equal lows are the mirror image. Most teachers accept "relatively equal" rather than tick-perfect — which is exactly why you need a written tolerance if you want repeatable marking.
The liquidity label comes from where orders are assumed to sit. Above equal highs sits buyside liquidity: stops from shorts (which are buy orders) plus breakout buys. Below equal lows sits sellside liquidity: stops from longs plus breakdown sells. "Taking liquidity" simply means price traded beyond the level far enough to trigger those resting orders.
Vocabulary varies by teacher and has drifted over the years: liquidity pool, resting liquidity, stop cluster, "old highs and lows," or trendline liquidity when the touches sit on a slope. Treat these as labels for one observable fact — repeated rejections at the same price.
Be blunt about what the level is not. A pool is not a prediction. It marks a price where a reaction is more likely to be visible because orders concentrate there; it says little about direction once those orders are filled. That ambiguity is the honest core of this lesson.
The idea behind it (theory and history)
The modern terminology comes from the ICT material published by Michael J. Huddleston ("The Inner Circle Trader") and the broader SMC community that grew around it, mostly through free online video since roughly the mid-2010s. These are discretionary methods taught by example: there is no canonical rulebook, definitions differ, and the same structural event is called a "market structure shift" by one teacher and a "change of character" by another.
Be careful with the story attached to the tool. Proponents argue that large participants deliberately drive price into obvious stop clusters to fill size before moving the other way. That is a hypothesis about order flow, not an established fact — there is no peer-reviewed or independent evidence that SMC patterns, equal highs and lows included, produce a trading edge. You can use the geometry without accepting the narrative.
The simpler half is better documented. Research on foreign-exchange dealer order books by Carol Osler, published in the Journal of Finance in 2003, found that stop-loss orders cluster around round numbers and that triggered stops tend to propagate price moves. Different market, different era, and no validation of SMC — but it supports the modest claim that obvious levels concentrate orders, which is all the concept needs.
The pattern itself is much older than the vocabulary. In classic chart-pattern literature (Edwards and Magee, Technical Analysis of Stock Trends, 1948) a pair of equal highs is the skeleton of a double top, equal lows of a double bottom. Wyckoff's "spring" and "upthrust" describe the same event: a brief break of an obvious level followed by a rapid return inside the range.
The classical rule is often garbled, so state it precisely. A double top is not confirmed by a break above the two peaks — that break invalidates it. Confirmation is a close below the intervening trough. SMC turns the attention around: there, the break of the flat ceiling itself is the event, and the trader watches whether price holds beyond it or snaps back inside. Same chart, different thing being watched, which is why rules must be written in advance.
How it is calculated
Equal highs and lows are a geometric pattern rather than a formula-driven indicator, but they can be detected mechanically. The version used below works in five steps you can also do by hand.
- Find swing points. A bar is a swing high if its high is the highest of the
kbars before and after it. Herek = 3, so a swing high is the highest of seven bars. Because the rule looks forward, a swing is only confirmed three bars later. - Measure volatility. Compute 14-period Average True Range, where true range is the largest of (high − low), |high − previous close| and |low − previous close|. ATR gives the tolerance a size that scales with the market.
- Pair the swings. Two swing highs must be 4 to 60 bars apart — close enough to belong to the same structure, far enough that you are not pairing one wick with itself.
- Apply tolerance and the purity test. The highs must be within 0.25 x ATR14 of each other, and no bar between them may print a higher high. That second condition makes the level a genuine ceiling rather than two touches either side of a spike.
- Track resolution. The pool is "taken" if a later bar within 80 bars wicks beyond it. On that bar, a close back inside is a close back; a close beyond is a close through.
``` k = 3 swing_high(i) = high[i] == max(high[i-k .. i+k]) swing_low(i) = low[i] == min(low[i-k .. i+k]) ATR14 = 14-period average of max(h-l, |h-c[-1]|, |l-c[-1]|)
EQH(a,b) if swing_high(a) and swing_high(b), a < b and 4 <= (b - a) <= 60 and |high[b] - high[a]| <= 0.25 * ATR14[b] and max(high[a+1 .. b-1]) < min(high[a], high[b])
level = max(high[a], high[b]) # EQL: min(low[a], low[b]) taken = exists t in (b, b+80] with high[t] > level closed_back = taken and close[t] < level closed_through = taken and close[t] >= level
mirror every comparison for equal lows
```
Marking by hand follows the same order: confirm the swings, draw a horizontal ray from the outer extreme of the pair, check the purity test, and note when the level ages out.
Default settings and variations
| Setting | Value here | Why it exists |
|---|---|---|
Swing lookback k |
3 bars each side | Filters noise wicks. Larger k finds fewer, more significant levels but confirms later. |
| Tolerance | 0.25 x ATR14 | "Equal" must be measurable; ATR keeps it consistent whether SOL trades at 240 or 87. |
| Spacing | 4–60 bars | Below 4 the highs belong to one move; above 60 on 4h (about 10 days) context has changed. |
| Purity test | No higher high / lower low between | Keeps the level one flat ceiling, not two touches around a spike. |
| Taken window | 80 bars | Gives the level a lifespan; without an expiry every level "works" eventually. |
| Resolution | Wick beyond, then same-bar close | Separates the two outcomes that look identical in real time. |
Common variations: a fixed tolerance (ticks or a percentage such as 0.1%) instead of ATR; requiring three or more touches, which makes a flatter and rarer level; trendline liquidity, the same idea on a sloped line and far more subjective; session or period extremes such as the prior daily or weekly high used as pools even when not strictly equal; and close-based rather than wick-based levels, which changes which bars count as a sweep.
Timeframe matters more than any single parameter. On 4h and daily crypto charts these levels are relatively scarce and clean. On 1m to 15m they are everywhere, and most are crossed within minutes while fees, spread and funding eat whatever move follows.
How to read it
Read the level as information about other traders, not about future price. A flat ceiling shows where many participants drew the same line, where breakout orders are likely parked, and where shorts from inside the range probably placed stops. That is the whole claim, and it is modest.
Second, read the draw: unfinished business tends to attract price. With equal lows below and nothing obvious above, SMC traders would call the nearer pool the likely objective. In the window below, 7 of 9 pools were reached within 80 bars — a high share, but partly a property of a trending market that covers ground.
Third and most important is the resolution, and here is the honest part: a sweep that reverses and a breakout that runs look identical while the bar is forming. Both begin as a wick beyond the level. Only the close distinguishes them, and even the close can be undone.
- Taken, closed back inside — the Wyckoff spring or upthrust reading: the push beyond failed to attract follow-through.
- Taken, closed through — the breakout reading; the level may be retested from the other side, which is where breaker-block logic begins.
- Not taken in the window — the level ages out. It can matter later, but stop counting it as live or your review is contaminated.
Regime decides which reading tends to pay. In a strong trend, pools in the trend direction get consumed and price keeps going, while counter-trend fades fail repeatedly. In a range, the same sweeps are far more likely to close back inside.
How traders use it
1. As an objective, not an entry. The most defensible use is marking pools as places where a move might stall, accelerate or terminate — a target zone. Works when the market trends and the pool sits in its path. Fails when "price should reach it" becomes "price will reach it": two of nine pools below were never taken within 80 bars.
2. The sweep-then-structure sequence. Wait for the pool to be taken, require a close back inside, then look for structural confirmation on a lower timeframe — the change of character covered in the sweep→CHoCH→entry lesson. Works best at range extremes and against stretched moves. Fails in strong trends, around scheduled macro news, and in thin weekend liquidity.
3. As a breakout filter. The mirror use: if the bar closes through with conviction, some traders drop the fade idea and treat the old level as a potential support/resistance flip. Works when displacement is obvious — large body, imbalance left behind, volume expansion. Fails when any close beyond counts, as the September 25 event below shows.
4. Stop-placement hygiene. Even traders who never trade the pattern use it defensively. A stop a few ticks beyond an obvious flat level sits inside the cluster everyone can see; moving it beyond an ATR-based noise band is a risk decision, not a signal. It fails if a wider stop quietly becomes a bigger loss because size was not reduced.
Crypto adds wrinkles. Perpetual futures concentrate leveraged positions whose liquidation prices sit in predictable places, so a wick through equal lows can trigger a cascade that travels much further than resting stops alone would explain — then retraces just as fast. Funding makes a slow fade expensive when the market leans one way, and because trading is 24/7 there is no opening auction to reset the picture.
| Check | Pass condition |
|---|---|
| Swings confirmed | Both are the extreme of their 7-bar window |
| Flatness | Difference ≤ 0.25 x ATR14 |
| Spacing | 4–60 bars apart |
| Purity | No higher high / lower low between |
| Context | Level's place in the larger trend and in premium/discount |
| Lifespan | Still inside the 80-bar window |
| Invalidation | Price that would prove the reading wrong, defined in advance |
Example on a real SOL chart
The window is SOL/USDT perpetual on Binance, 4h candles, September 16 to November 9, 2026, ending at a close of 87.44. Price fell from the 120s to the high 80s, so this is predominantly a downtrend — keep that in mind when reading outcomes.
The rules above found 3 equal-high pools and 6 equal-low pools, nine in total. 7 were taken within 80 bars (77.8%): 4 with the same bar closing back inside, 3 closing through.
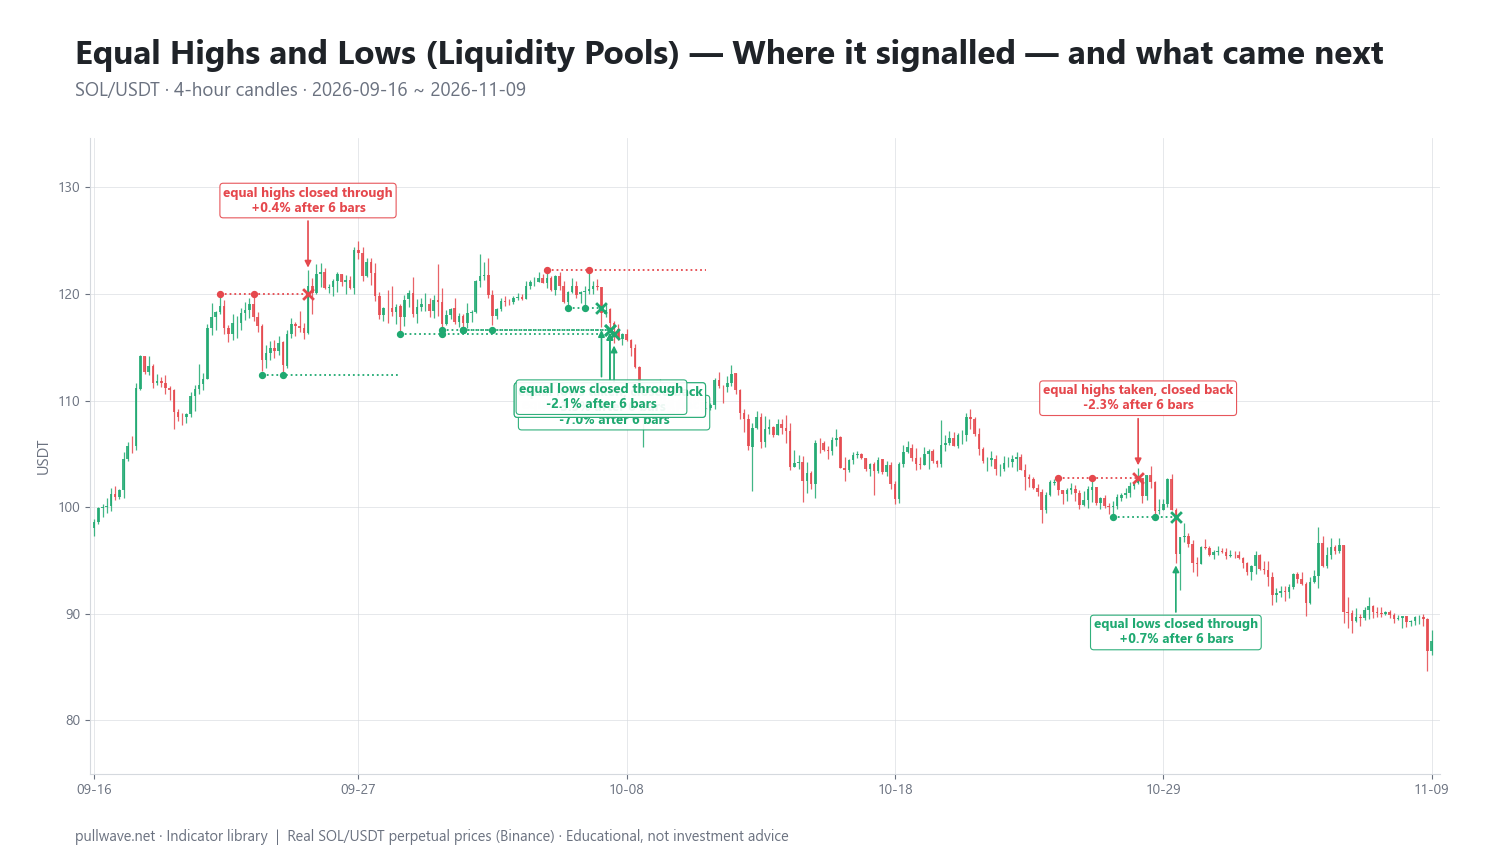
Figure 2 shows the same chart with each taken level labelled "taken, closed back" or "closed through," plus the percentage move six bars later. On this timeframe six bars is about one day, eighteen bars about three days.
| Date (UTC) | Event | Level | After 6 bars | After 18 bars |
|---|---|---|---|---|
| 2026-09-25 08:00 | Equal highs, closed through | 120.79 | +0.37% | −1.76% |
| 2026-10-07 00:00 | Equal lows, closed through | 118.18 | −2.11% | −7.22% |
| 2026-10-07 08:00 | Equal lows, taken, closed back | 117.29 | −3.55% | −6.36% |
| 2026-10-07 08:00 | Equal lows, taken, closed back | 117.29 | −3.55% | −6.36% |
| 2026-10-07 12:00 | Equal lows, taken, closed back | 116.72 | −7.04% | −5.39% |
| 2026-10-28 08:00 | Equal highs, taken, closed back | 102.71 | −2.31% | −6.70% |
| 2026-10-29 20:00 | Equal lows, closed through | 95.62 | +0.71% | −1.16% |
Two rows share a timestamp and price (117.29) because two separate equal-low pairs sat at effectively the same level and were resolved by the same bar. That is normal with mechanical detection and a reminder that event counts are partly an artifact of the rule.
Scoring it honestly: if every sweep is read as a fade — down after equal highs are taken, up after equal lows — only 2 of the 7 events moved that way six bars later: the equal highs at 102.71 (−2.31%) and, barely, the equal lows at 95.62 (+0.71%, though −1.16% after eighteen bars).
The October 7 cluster is the instructive failure. The highest pool, equal lows at 118.18, was taken at 00:00 and that bar closed through — no spring, just a breakdown, with price 2.11% lower after six bars and 7.22% lower after eighteen. The three pools beneath it, at 117.29 and 116.72, were each taken with the sweep bar closing back inside: textbook spring geometry. All three still continued lower, −3.55%, −3.55% and −7.04% after six bars. In a downtrend, "closed back inside" meant a pause, not a reversal.
September 25 shows the opposite trap. Equal highs at 120.79 closed through, which a breakout reader would call continuation — yet price was up only 0.37% six bars later and down 1.76% after eighteen. A marginal close through is not displacement and carries very little information.
Treat this as one illustration on one market, one timeframe and one eight-week window, produced by one specific rule set. Another trader marking by eye would find different levels. A trending window flatters the "pools get taken" statistic and punishes the fade reading; a range would likely do the reverse. Seven events prove nothing.
Common mistakes
- Drawing on a finished chart. These levels are trivial to mark in hindsight and much harder live, when you do not yet know if the second touch is a touch or the start of a breakout.
- Confusing the wick with the close. The two outcomes are indistinguishable mid-bar. On 4h, deciding early can mean acting four hours before the information exists.
- Ignoring the trend. As October 7 shows, counter-trend sweep fades are the highest-failure version of the idea; establish direction top-down first.
- Marking everything. A chart with twenty flat lines effectively has no levels. Raise the swing lookback or move up a timeframe.
- Treating the narrative as fact. "They came for the stops" fits any sweep after the event and cannot be falsified from price alone.
- Forgetting costs. Several events above moved under 1% in six bars; fees, spread and funding can consume that entirely.
- No invalidation level. Without a price that proves you wrong, you have an opinion with leverage attached, not a plan.
Combining it with other tools
Equal highs and lows are a location tool: they say where, never what. In practice they are read with the other lessons in this smart money deep dive — market structure and change of character, order blocks and breaker blocks for the reaction zone, fair value gaps and displacement to judge force, premium/discount and OTE for where the pool sits in the range, and kill zones for traders who prefer specific hours despite 24/7 markets.
Volume confirmation is worth more than most of the geometry. A sweep on expanding volume that closes back inside reads differently from the same wick on thin weekend flow. In crypto you can also watch open interest: a sharp drop alongside the wick is consistent with positions being closed or liquidated at the level — a direct observation rather than an inference about intent.
From the classical toolkit, ATR supplies both the tolerance and a sane stop distance, while horizontal support and resistance and Fibonacci retracements often land on the same prices, which is unsurprising given the shared lineage. Round numbers matter too: a flat level at 100.00 carries both effects at once.
To test the idea without risking money, write the rules first, mark levels in a replay tool with the future hidden, log every event with its label and the move after a fixed number of bars, then compare against the same measurement taken at random bars in the same period. That control separates a real test from a highlight reel.
Frequently asked questions
Q. What are equal highs and equal lows in trading?
Equal highs are two or more swing highs that stop at virtually the same price with no higher high between them; equal lows are the mirror image. In smart money concepts they are called liquidity pools because stop and breakout orders are assumed to rest just beyond the flat level. In classical terms the same geometry is the skeleton of a double top or double bottom.
Q. Is a liquidity pool the same as a double top?
The geometry is largely the same; the interpretation is not. In Edwards and Magee a double top is confirmed by a close below the trough between the peaks, and a break above the equal highs invalidates it. SMC traders instead treat the break of the flat level as the event and watch whether the bar closes back inside or through. Neither reading is proven superior, so pick one definition and apply it consistently.
Q. What is the best timeframe for equal highs and lows in crypto?
There is no objectively best timeframe, but 4h and daily charts tend to produce fewer and cleaner levels, while 1m to 15m charts produce many that are crossed almost immediately. Because crypto trades 24/7 with no session gaps, higher-timeframe levels avoid the overnight-gap distortions seen in equities. Many traders define the pool higher up and drop lower only to watch how it resolves.
Q. Do equal highs and lows always get taken?
No. In the SOL window above, 7 of 9 pools (77.8%) were taken within 80 bars, so two were not — and that figure came from a strongly trending period that naturally covers a lot of ground. Quiet or ranging markets leave more levels untouched, and no rule guarantees any particular level is reached.
Q. Is there evidence that institutions hunt stops at equal highs and lows?
There is documented evidence from foreign-exchange order-book research, notably Carol Osler's 2003 work in the Journal of Finance, that stop orders cluster at visible prices and that triggered stops can extend moves. There is no peer-reviewed evidence that specific SMC patterns give retail traders an edge, and the claim that large players deliberately target those clusters is a hypothesis about order flow, not an established fact.
Q. How many touches do I need before a level counts as a liquidity pool?
Two confirmed swing points is the common minimum and what the rules here require. Three or more touches create a flatter, more widely watched level, which proponents argue implies a larger order cluster, but such levels are much rarer. More important than the count is writing down a tolerance — such as 0.25 x ATR14 — so "equal" means the same thing every time.
Key takeaways
- Equal highs and lows are two or more swing points at nearly the same price with nothing higher (or lower) between them; the flat level is called a liquidity pool because orders cluster just beyond obvious prices.
- Mechanical marking needs four written rules — swing lookback, an ATR-scaled tolerance, a spacing range and a purity test — otherwise the pattern is hindsight-friendly and impossible to review honestly.
- A sweep that reverses and a breakout that runs look identical until the bar closes, and even the close can be undone; "closed back inside" versus "closed through" is the core reading.
- In the 4h SOL/USDT window, 9 pools produced 7 takes (77.8%), split 4 closed back and 3 closed through, yet only 2 of 7 events moved in the fade direction six bars later — one trending window, not evidence of an edge.
- The concept locates where a reaction may occur; direction, confirmation and risk control must come from trend context, structure, volume and position sizing.
Educational material. Charts use real SOL/USDT perpetual prices; past behaviour does not predict future results. Not investment advice.