Indicator & technique library · Smart money concepts (SMC/ICT)
Breaker Blocks Explained: ICT Rules, Retests, Example
At a glance
- A breaker block is an order block that failed — price closed through its far side — and the same zone is then watched in the opposite role.
- It is a candle-level version of the much older idea that broken support becomes resistance, so expect overlap rather than novelty.
- Marking rules vary: whole candle or body only, with or without a prior liquidity sweep, with or without a structure shift.
- In one mechanical 4h SOL/USDT window, 12 of 20 order blocks failed, 11 were retested, and 5 of 11 retests moved in the expected direction after six bars.
A breaker block is an order block that did not hold. Price closed through the far side of the zone, the traders positioned there were caught offside, and the same area is then watched in the opposite role: a former supply zone becomes potential support, a former demand zone becomes potential resistance. In ICT and "smart money concepts" (SMC) vocabulary, that flipped zone is the breaker block.
Traders care about breakers for two reasons. They give a precisely drawable level right after the market has changed direction, at the moment when older support and resistance lines have just been invalidated, and they come with a built-in invalidation point — if price closes back through the zone, the reason for drawing it is gone. That is also the honest limit of the tool: this is a discretionary chart-reading convention, not a measured edge.
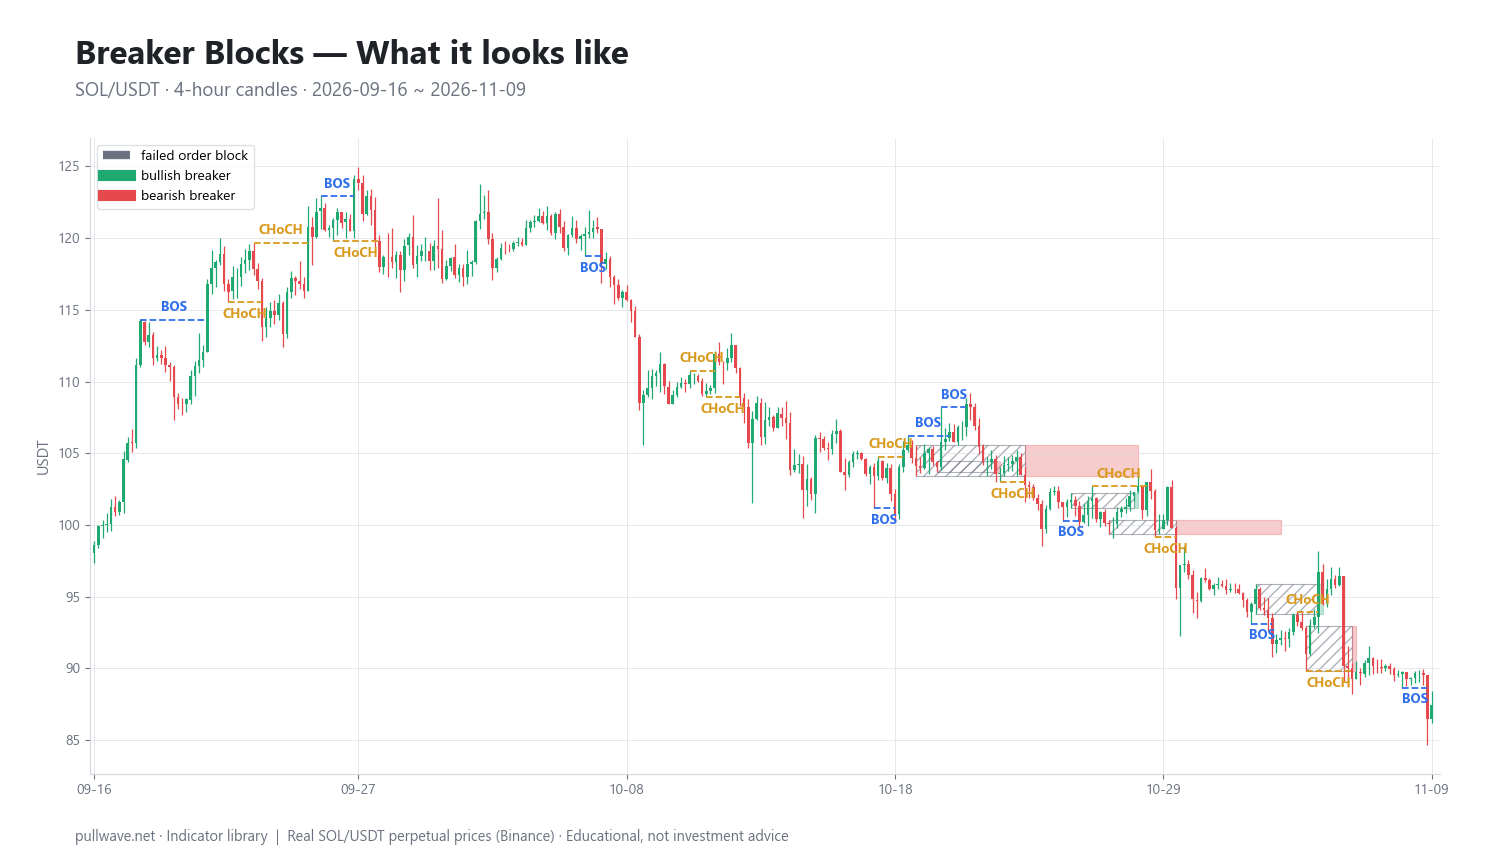
Figure 1 shows real SOL/USDT 4h candles. The hatched boxes are order blocks that later failed; the coloured boxes are the breaker zones those same candles became after a close beyond the far side, shaded by the direction they are now read in. The dashed horizontal lines mark the close-based structure breaks that defined each block in the first place.
What is a breaker block?
Start from the order block, because a breaker cannot exist without one. In SMC, an order block is the last opposite-colour candle before a decisive move that breaks market structure: the last down-close candle before a rally that takes out a confirmed swing high (a demand or bullish order block), or the last up-close candle before a drop that takes out a confirmed swing low (a supply or bearish order block). The zone is that candle's range.
A breaker is what that zone becomes when it fails:
- Bullish breaker — a supply (bearish) order block that price later closes above. From that point it is watched as potential support. Because a supply block is built from an up-close candle, a bullish breaker is usually made of green candles.
- Bearish breaker — a demand (bullish) order block that price later closes below. From that point it is watched as potential resistance, and it is usually made of red candles.
That colour inversion confuses beginners constantly. Some teachers name the zone after the candles that form it, others after the direction it is traded in. The labelling is genuinely inconsistent across sources, so when you read someone else's chart, check the role being assigned to the box rather than trusting the name or the colour.
Two neighbouring terms matter. A mitigation block, in the most common usage, is the same object without a prior liquidity sweep: price reversed from a level that never ran the previous swing extreme. Not every teacher draws that distinction, and some use the words interchangeably, so treat it as a convention rather than a definition. The other neighbour is the polarity flip: the classic observation that broken support often acts as resistance and vice versa. That idea predates SMC by roughly a century and appears in Dow-theory swing analysis, in Wyckoff's springs and upthrusts, and in the chart-pattern literature of the 1930s. A breaker is essentially a tightly bounded, candle-level version of it, with a specific origin rule attached.
The idea behind it (theory and history)
The vocabulary comes from material published online by Michael J. Huddleston, who teaches under the name "Inner Circle Trader" (ICT), and from the wider SMC community that grew around it. These ideas spread mainly through free video content from roughly the mid-2010s onward rather than through books or journals, which is why definitions have drifted: "market structure shift" and "change of character" are frequently used for the same event, and "breaker" and "mitigation block" sometimes swap meanings between channels. Precision about your own rules matters more than orthodoxy.
Proponents argue that large participants cannot fill size at a single price, so they accumulate or distribute inside a candle range before an impulsive move. If price later closes decisively through that range, those fills are underwater, and when price returns the inventory is either defended or unwound — which, in the story, is why the flipped zone reacts. That is the framework's hypothesis about order flow. It has not been demonstrated with public order-flow data, and there is no peer-reviewed or independent evidence that breaker blocks provide a trading edge on their own.
Plainer explanations fit the same charts just as well. Obvious swing highs and lows hold resting stop orders, so a sweep followed by a reversal can simply be those stops triggering into thin depth. Breakout traders who entered on the original structure break are trapped when it fails, and their exits supply fuel for the move back through the zone. And because a large number of retail traders now draw the same boxes with roughly the same rules, part of any reaction may be nothing more than shared attention. None of this requires a story about institutions hunting individual stop losses, and you do not need to believe that story to use the level as a reference point.
How it is calculated
Breakers are drawn by hand, but every step can be written as a rule — and should be, because unwritten rules are the main reason backtests of discretionary concepts fall apart. The rules below are the mechanical ones used for the SOL example later on this page.
Step 1 — Find swing points. Use a fractal lookback of k = 3: a swing high is a bar whose high exceeds the highs of the three bars before and after it; a swing low is the mirror image. Confirmation therefore always arrives three bars late. That lag is not a flaw to be engineered away — it is the price of knowing the pivot was real.
Step 2 — Find the structure break. A bearish break is a candle close below the last confirmed swing low. A bullish break is a close above the last confirmed swing high. Using closes rather than wicks is the single most important filter in the whole procedure.
Step 3 — Mark the order block. From the breaking candle, walk backwards to the last candle of the opposite colour. Before a bearish break, that is the last up-close candle; before a bullish break, the last down-close candle. The zone is that candle's full high-to-low range.
Step 4 — Wait for failure. The block becomes a breaker only when a later candle closes through its far side within a patience window — 80 bars here. For a bearish order block the far side is the high; for a bullish order block it is the low. A wick through is not a failure.
Step 5 — Flip the zone. From that failure close onward, the same box is read in the opposite direction. The coordinates do not change; only the role does.
Step 6 — Define the retest. The retest is the first bar within 60 bars whose wick re-enters the zone from the new side, before any close beyond it. Fixing "first" prevents the convenient habit of counting the one touch that happened to work.
``` k = 3 swing_high(i): high[i] > max(high[i-3..i-1]) and high[i] > max(high[i+1..i+3]) swing_low(i) : low[i] < min(low[i-3..i-1]) and low[i] < min(low[i+1..i+3])
bearish_break: close[t] < last_confirmed_swing_low bullish_break: close[t] > last_confirmed_swing_high
OB_bear = last bar before bearish_break with close > open -> zone [low, high] OB_bull = last bar before bullish_break with close < open -> zone [low, high]
failure(OB_bear): any close > zone.high within 80 bars -> bullish breaker failure(OB_bull): any close < zone.low within 80 bars -> bearish breaker
retest: first bar within 60 bars after the flip whose wick enters the zone from the new side, before any close beyond it ```
The 80- and 60-bar windows are housekeeping, not theory. Without them, a zone from last quarter can be "flipped" months later and the chart slowly fills with stale boxes that no longer describe anything about current positioning.
Default settings and variations
There are no official settings for a breaker block. The "defaults" are whichever choices you commit to in writing before you look at the chart, and the table below lists the ones most commonly used.
| Choice | Common default | Why it exists | Effect if changed |
|---|---|---|---|
Swing lookback k |
3 bars each side | Filters one- and two-bar noise | Larger k: fewer zones, more significant, later confirmation |
| Break definition | Candle close beyond the swing | Ignores single-wick spikes | Wick breaks produce many false flips |
| Zone boundaries | Whole candle, high to low | Covers the full origin range | Body-only is tighter but missed more often |
| Failure confirmation | Close beyond the far side | A close is harder to fake than a wick | Wick-based failure flips zones far too early |
| Prior liquidity sweep | Optional (strict ICT: required) | Separates breakers from mitigation blocks | Requiring it cuts the zone count sharply |
| Failure / retest window | 80 / 60 bars | Keeps zones recent and relevant | Longer windows clutter the chart with stale boxes |
Common structural variants, each with a real trade-off:
- Multi-candle blocks use the whole consolidation before the impulse instead of a single candle. Wider zone, more touches, worse risk-reward per touch.
- Sweep-required breakers demand that the move creating the original block first ran an obvious pool of equal highs or lows. This is the strict ICT version and produces far fewer, cleaner zones.
- Shift-required breakers demand that the failure close itself breaks structure in the new direction, which filters out sideways chop where a zone is crossed without anything changing.
- Imbalance-filtered breakers count only blocks whose originating move left a fair value gap behind, as evidence the move was genuinely one-sided.
- Refined zones narrow the box to its 50% level (the "mean threshold" in ICT usage) or to its overlap with a fair value gap sitting inside it. Tighter invalidation, more misses.
None of these variants is more correct than the others. What matters is that you pick one, write it down, and apply it the same way on every chart, including the ones where it gives an answer you dislike.
How to read it
Read the zone as a statement about what already happened, not a prediction. A bearish breaker says: buyers committed inside this range, the market closed below them, and the area has not been reclaimed since. The behaviour you are watching for on the retest is price refusing to trade back through it — not the touch itself, which is just arithmetic.
Work through each zone with a fixed checklist:
| Check | Stronger reading | Weaker reading |
|---|---|---|
| Origin | Impulsive move away, imbalance left behind | Slow drift, overlapping candles |
| Sweep | Obvious high or low taken out first | No pool of liquidity nearby |
| Failure quality | Decisive close well beyond the far side | A few ticks past the edge |
| Freshness | First return to the zone | Third or fourth pass |
| Context | Flip direction agrees with higher timeframe | You are fading the dominant trend |
| Location | Discount half for longs, premium half for shorts | The opposite |
| Width | Narrow relative to your risk budget | Several percent wide |
The cleanest readings pair a fresh zone, an aggressive failure close and higher-timeframe agreement. The weakest are stale zones inside a tight range, where price slices back and forth and every candle technically qualifies as a retest. If you find yourself needing to argue a zone into relevance, that is the answer.
How traders use it
1. Continuation after a structure shift. The canonical sequence is sweep → change of character → the old order block fails → retrace into the resulting breaker. The first retest is treated as a location to consider a position aligned with the new structure, with invalidation at a close through the far side. Works when the regime genuinely changed and the market is trending. Fails when the "shift" was one impulsive candle inside a range; there, every breaker is eventually cut through again from both directions.
2. Fading range extremes. In an oscillating market, breakers tend to accumulate near the range boundaries, since both boundaries are built from failed pushes. Works when the boundaries are well defined and volatility is stable. Fails when the range resolves: a single breakout can erase a string of successful fades, which is exactly why fixed invalidation matters most in this use case.
3. Invalidation and stop placement. Many traders who enter for entirely different reasons still use the far side of a nearby breaker as a structural reference instead of an arbitrary percentage stop. Works when the zone is tight relative to the risk budget. Fails when it is wide — a 4% box on a leveraged perpetual may force a position size too small to be worth the effort, and tucking the stop inside the zone to allow a larger size defeats the entire purpose.
4. Higher-timeframe context mapping. Mark daily and 4h breakers as context, then drop to a lower timeframe for a trigger and tighter invalidation. Works when you resist the temptation to add every 5m zone as well. Fails when the higher-timeframe zone spans several percent: you get a direction but no usable risk control, and the lower-timeframe entry becomes the real decision.
Crypto adds specific wrinkles. Markets trade 24/7, so there are no session gaps and no opening auction — a zone can be retested at 3 a.m. UTC in very thin depth, and that wick means less than one printed during an active period. Perpetual futures add funding costs to multi-day holds and, more importantly, liquidation cascades that can spike price clean through a zone and back inside a single candle. That is a practical argument for close-based definitions at every step, and for sizing that assumes your level will occasionally be pierced by a wick that nobody could have traded.
Example on a real SOL chart
The window is SOL/USDT perpetual on Binance, 4h candles, from 2026-09-16 to 2026-11-09, with a last close of 87.44. The rules are exactly the mechanical ones given above: swings with k = 3, close-based structure breaks, whole-candle zones, failure confirmed by a close through the far side within 80 bars, retest defined as the first wick back into the zone within 60 bars. Another trader drawing these by hand would mark different levels, which is part of the lesson.
Over that window the rules found 20 order blocks. 12 of them failed — 60.0% — and of those failures, 11 were retested (91.7%). Absorb those two numbers before looking at any outcome: if most order blocks eventually break, then the mere existence of a breaker is not a rare or remarkable event. It is the normal end state of an order block in a market that keeps moving.
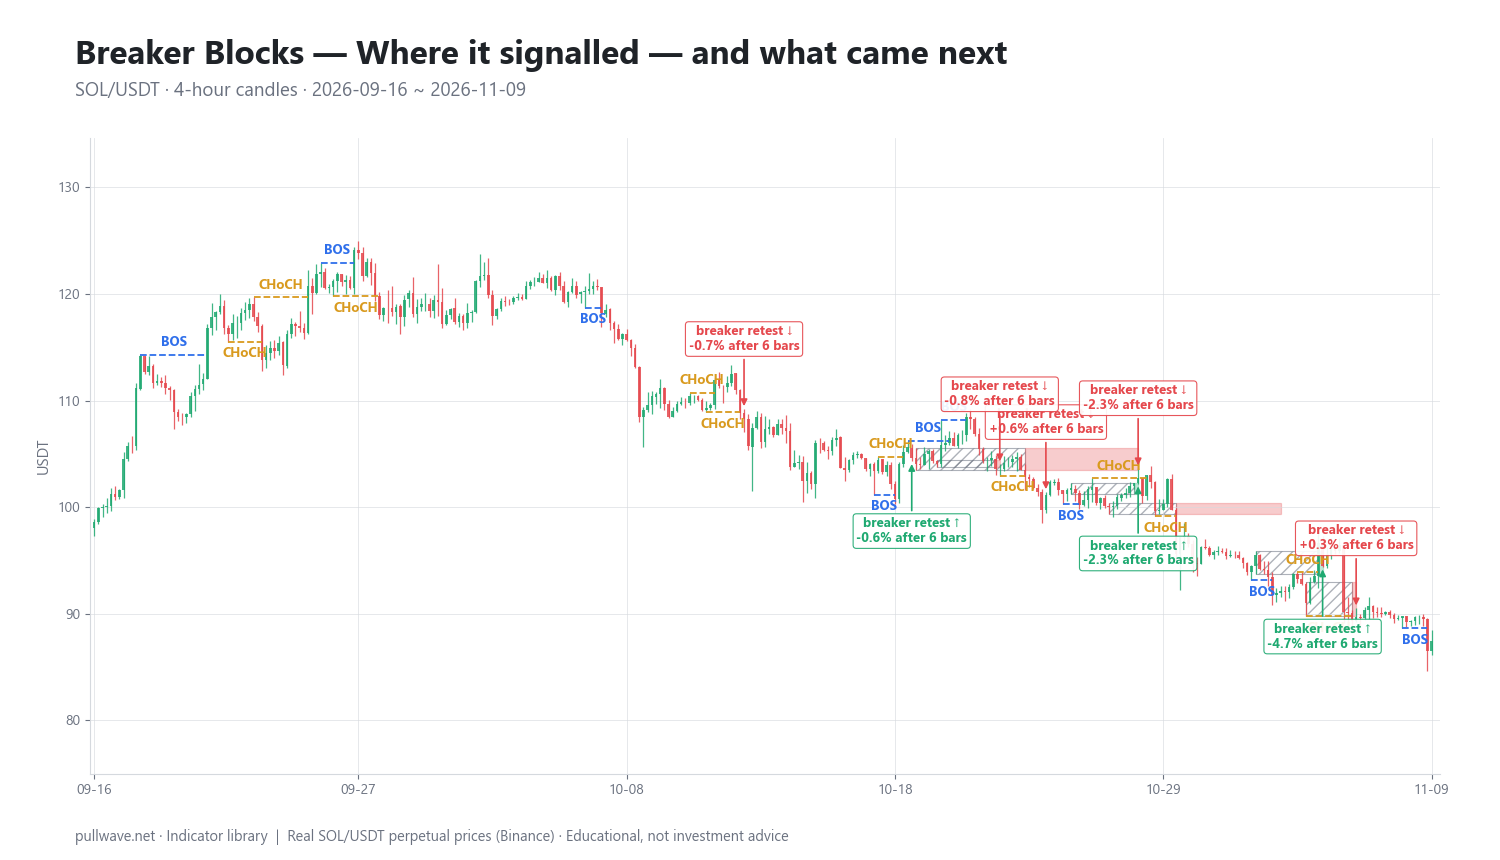
Figure 2 marks each retest on the same chart and labels the percentage move six bars (one day) later. The table below lists ten of the eleven retest events, with the move after 6 and after 18 bars.
| Date (UTC) | Retest | Price | After 6 bars | After 18 bars |
|---|---|---|---|---|
| 2026-09-28 16:00 | ↓ | 118.32 | +0.37% | −0.08% |
| 2026-10-11 16:00 | ↓ | 111.33 | −2.77% | −6.43% |
| 2026-10-12 16:00 | ↓ | 108.25 | −0.69% | −2.10% |
| 2026-10-19 08:00 | ↑ | 104.64 | −0.56% | −0.23% |
| 2026-10-22 20:00 | ↓ | 103.62 | −0.80% | −2.20% |
| 2026-10-24 16:00 | ↓ | 101.11 | +0.64% | 0.00% |
| 2026-10-28 08:00 | ↓ | 102.71 | −2.31% | −6.70% |
| 2026-10-28 08:00 | ↑ | 102.71 | −2.31% | −6.70% |
| 2026-11-04 16:00 | ↑ | 94.48 | −4.69% | −5.18% |
| 2026-11-06 00:00 | ↓ | 89.74 | +0.31% | −2.56% |
Counting all eleven events, 5 of 11 moved in the signalled direction after six bars — close to a coin flip, on a sample far too small to conclude anything. Note that four of those five in-direction moves are among the ten events shown in the table; the eleventh event is not listed, so any statement limited to the table is a statement about ten events, not about the whole set.
The window itself is a downtrend, from the 118 area in late September to 87.44 at the end. Of the three bullish breaker retests shown in the table (104.64, 102.71 and 94.48), all three were followed by a lower price six bars later, including −4.69% after the 2026-11-04 retest. The bearish retests in the table did better on average: −2.77% after 2026-10-11 and −2.31% after 2026-10-28, extending to −6.43% and −6.70% respectively after eighteen bars. In this window, zones pointing against the dominant direction fared badly. That is primarily a statement about trend-following inside a trending sample, not proof that breakers work.
Two details deserve attention. The 2026-10-28 08:00 bar triggered a bullish and a bearish retest at the same price of 102.71, because overlapping zones of opposite polarity sat on top of each other. On a live chart that is ambiguity, not a signal — and it is a situation the mechanical rules cannot resolve for you. Second, several of the "working" events were marginal: +0.37% followed by −0.08%, or +0.64% followed by exactly 0.00% after eighteen bars. Measured over fixed bar counts, a good number of retests simply produced noise.
Treat all of this as one illustration: one market, one timeframe, one eight-week window and one rule set. Change k to 5, use body-only zones, require a prior liquidity sweep, or measure outcomes at 3 or 30 bars instead of 6 and 18, and both the zone count and the outcome distribution would change. That sensitivity is itself the most useful thing the exercise teaches.
Common mistakes
- Drawing on a finished chart. Breakers are trivial to spot in hindsight because you already know which order blocks failed and which held. The honest test is bar-by-bar replay with the right side of the chart hidden.
- Treating every failed block as meaningful. In the SOL window, 60.0% of order blocks failed. Without filters — sweep, displacement, higher-timeframe agreement — you are boxing ordinary price movement and calling it structure.
- Ignoring the regime. In a range, breakers get cut through from both sides, repeatedly, and the concept quietly stops describing anything.
- Zone creep. Widening the box after the fact so that price "technically touched it" is a way of never being wrong. It also destroys risk-reward, because the invalidation moves with the excuse.
- Mistaking a wick for a failure. A liquidation cascade can pierce a zone for sixty seconds and recover. Close-based rules exist precisely for this, and crypto needs them more than most markets.
- Confusing the labels. A bullish breaker is usually built from up-close candles because it began life as a supply block. Colour-code mechanically and you will read half your zones backwards.
- Oversizing because the stop is tight. A small structural stop is an invitation to add leverage, and on perpetuals that is exactly how ordinary noise turns into a liquidation.
- Stacking too many zones. If every timeframe's breakers are on the chart, something is always being retested, and the concept loses all selectivity.
Combining it with other tools
A breaker block is a location tool. It tells you where, not when, and not how much — so it needs company.
- Market structure and change of character tell you whether a given zone is a continuation idea or a counter-trend fade, which changes both expectation and sizing.
- Liquidity sweeps and equal highs/lows supply the strict definition: a breaker whose origin ran a clean pool of stops has a clearer narrative than one that formed in the middle of nowhere.
- Displacement and fair value gaps show that the originating move was genuinely one-sided. Where a breaker overlaps an unfilled gap, the area you actually need to defend becomes much narrower.
- Premium/discount and OTE keep you from taking long-side zones at the top of a range and short-side zones at the bottom — a simple location filter that removes a surprising number of bad ideas.
- Volume confirmation distinguishes a failure close that happened on heavy participation from one that drifted through on thin overnight flow.
- Kill zones matter less in 24/7 crypto than in FX, but liquidity still varies substantially by hour, which affects how much a retest wick is worth.
- Top-down multi-timeframe analysis — context from the higher timeframe, execution on the lower — is the standard frame that ties all of these lessons together.
To test the idea without risking money: write your rules down first, replay six months of one symbol bar by bar, log every retest with date, price and the move 6 and 18 bars later, and then compare the result against a naive benchmark such as the average move after a randomly chosen bar in the same window. If your breakers add nothing above that benchmark, you have learned something valuable for the cost of a few evenings and no capital.
Frequently asked questions
Q. What is a breaker block in ICT?
In ICT and smart money concepts, a breaker block is an order block that failed: price closed through the far side of the zone, and the same area is then watched in the opposite role. A supply block that price closes above becomes a bullish breaker and is treated as potential support; a demand block that price closes below becomes a bearish breaker and is treated as potential resistance.
Q. What is the difference between a breaker block and a mitigation block?
The most common distinction is whether a liquidity sweep came first. In stricter usage, a breaker requires that a swing high or low was taken out before the reversal, while a mitigation block forms without that sweep. Usage varies between teachers and some treat the terms as interchangeable, so always check how the person drawing the chart defines them.
Q. Is a breaker block just broken support becoming resistance?
Largely, yes — it is a tightly defined, candle-level version of the polarity flip, an idea documented in technical analysis long before SMC existed. What the breaker adds is a specific origin rule (the last opposite-colour candle before a structure break) and, in strict versions, a required liquidity sweep. The older idea is far better documented; the breaker adds precision to the drawing, not a new phenomenon.
Q. Which timeframe is best for breaker blocks in crypto?
There is no single best timeframe, but 4h and daily zones are generally cleaner than 5m or 15m ones because fewer of them are produced by a single liquidation wick. A common workflow marks higher-timeframe zones for context and uses a lower timeframe only for the trigger and tighter invalidation. Because crypto trades 24/7, intraday zones can be retested in very thin conditions at any hour.
Q. Where do traders place a stop on a breaker block retest?
The usual structural reference is beyond the far side of the zone, since a close through there removes the reason the zone was drawn at all. The practical problem is width: if the box spans several percent, the position size needed to keep risk fixed may be very small. Shrinking the stop to somewhere inside the zone in order to justify a larger size reintroduces exactly the risk the level was meant to define.
Q. Do breaker blocks actually work?
There is no peer-reviewed or independent evidence that breaker blocks provide an edge on their own, and the "smart money defends its inventory" explanation is the framework's hypothesis about order flow rather than a documented fact. In the single mechanical 4h SOL window on this page, 5 of 11 retests moved in the signalled direction after six bars — close to a coin flip on a tiny sample. The only way to know what they do on the markets you trade is to define the rules in advance and log the results yourself.
Key takeaways
- A breaker block is an order block that failed — price closed through the far side — with the same zone then read in the opposite direction; a bullish breaker is usually made of up-close candles because it originates from a supply block.
- The rules only mean something if they are fixed in advance: swing lookback, close-based breaks, whole-candle or body-only zones, whether a prior sweep is required, and how long a zone stays valid.
- In one mechanical 4h SOL/USDT window from 2026-09-16 to 2026-11-09, 20 order blocks produced 12 failures (60.0%), of which 11 were retested (91.7%), and 5 of 11 retests moved in the signalled direction after six bars — an illustration, not evidence.
- Regime dominates: in that downtrend, all three bullish breaker retests listed in the example table were followed by lower prices six bars later, while two bearish ones extended to −6.43% and −6.70% after eighteen bars.
- Breakers are a location tool and belong alongside market structure, liquidity sweeps, imbalance, premium/discount and volume — and in crypto, alongside a realistic view of leverage, funding and liquidation wicks.
Educational material. Charts use real SOL/USDT perpetual prices; past behaviour does not predict future results. Not investment advice.