Indicator & technique library · Smart money concepts (SMC/ICT)
ICT Kill Zones and Session Times Explained for Crypto
At a glance
- Kill zones are fixed intraday time windows that the ICT framework treats as the likeliest periods for liquidity grabs and intraday reversals — they are a filter on when you look, not a signal.
- The four commonly cited windows are the Asian, London, New York and London-close sessions, quoted in New York time and shifting by one hour in UTC with US daylight saving.
- In 119 days of SOL/USDT 1h data the New York window held 19.7% of daily volume in 12.5% of the day, while the London window was below average on both volume and range.
- On the same sample, the London window traded through the Asian high or low on 63.9% of days, which measures where ranges get broken, not whether any strategy is profitable.
Kill zones are time windows, not price levels. The idea, popularised through the "ICT" material and the wider smart-money-concepts community, is that intraday liquidity grabs, reversals and the day's biggest expansions cluster in a few predictable hours — mostly around the London and New York sessions — and that a trader is better off doing nothing outside them.
For a crypto trader this sounds odd at first: the market never closes, there is no bell, and there are no weekend gaps. But the people trading it still live somewhere, and the flow that moves size still follows European and American business hours. This page explains exactly what the windows are, how to mark them correctly in UTC, what one real hourly dataset on SOL actually shows about them, and the limits of what any of that proves.
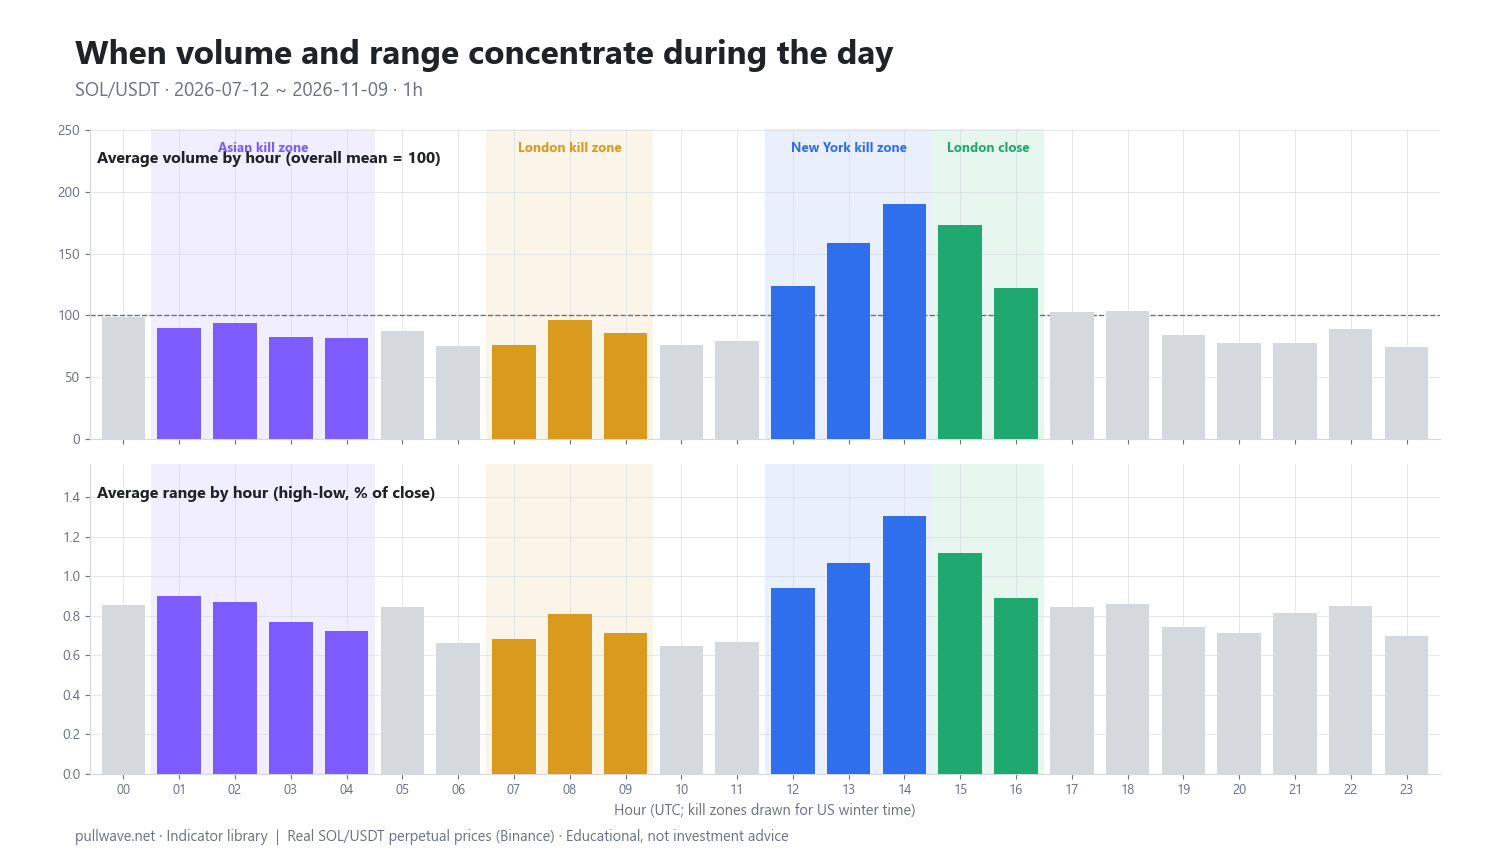
Figure 1 is the basic evidence you should look at before believing anything about sessions: average volume (indexed so the all-hour mean is 100) and average candle range as a percentage of close, broken out by UTC hour, over roughly 120 days of SOL/USDT 1h candles, with the four kill-zone windows shaded.
What are kill zones and session times?
A kill zone is a fixed block of clock time during which, according to the framework, price is more likely to run a visible high or low, reverse, and then deliver the move that defines the rest of the day. Everything else — the pattern you trade, the level you use — comes from the other tools in the toolkit. The kill zone only answers when.
Four windows are cited most often. They are usually quoted in New York time, which is the single biggest source of confusion, because New York time moves twice a year while UTC does not.
- Asian kill zone — roughly 20:00–00:00 New York time
- London kill zone — roughly 02:00–05:00 New York time
- New York kill zone — roughly 07:00–10:00 New York time
- London close kill zone — roughly 10:00–12:00 New York time
Sources differ by an hour or so in both directions, and some teachers use a 07:00–09:00 New York open window instead of three hours. Treat the edges as soft. The useful content is "the hours around the London open, the hours around the US morning, and the hour or two when London books are squared," not a precise minute.
The second standing idea is the Asian range: the high and low built during the quiet overnight hours, used as the obvious pool of resting orders that the European or American session may run through. Note that the Asian range box and the Asian kill zone are not the same thing — the box is usually drawn over the whole overnight session, while the kill zone is a narrower window inside it.
The idea behind it (theory and history)
The kill-zone vocabulary comes from the ICT material published by Michael J. Huddleston, taught largely through online videos from about the mid-2010s onward. Like the rest of the smart-money-concepts vocabulary, the definitions have drifted between teachers and over time; there is no single canonical specification, and you will find different hour ranges in different lessons.
Underneath the newer labels sits something much older and much better documented: the forex session structure. Spot FX has always been described in terms of the Tokyo, London and New York sessions, with the London–New York overlap as the busiest few hours of the day. Intraday seasonality in volume and volatility — activity concentrating at the open and close of the dominant cash market — is one of the oldest and most replicated observations in market microstructure research on equities and FX. That part is not controversial.
What the framework adds is a story about why. Proponents argue that large participants deliberately push price through session highs and lows to trigger resting stop orders, collect the liquidity they need to fill size, and only then move in the intended direction — and that this happens on a schedule because the desks doing it work on a schedule. That is a hypothesis about order flow, not an established fact. No one outside the desk sees the book, and the same price action is equally consistent with ordinary volatility clustering around the hours when the most participants are awake.
So be careful about what is claimed. It is well supported that activity concentrates in certain hours. It is not independently established that trading inside those hours, or trading sweeps of the Asian range, produces a profitable edge. There is no peer-reviewed literature validating kill zones as a strategy, and the pattern is trivially easy to see on a finished chart after the fact.
How it is calculated
There is no formula that turns price into a kill zone — the windows are defined on the clock. What can be calculated is the thing the windows are supposed to capture: the distribution of volume and range across the hours of the day, and the behaviour of the overnight range.
Step by step, to mark the windows:
- Decide which clock the quoted hours are in. Kill zones are nearly always quoted in New York time.
- Convert to UTC. In US winter time New York is UTC−5, so add 5 hours. In US summer time New York is UTC−4, so add 4 hours — the same window sits one hour earlier in UTC.
- Set your charting platform to a fixed timezone (UTC is the cleanest) so the boxes do not drift when your own clock changes.
- Draw each window as a vertical band repeating daily, not as a one-off box.
Step by step, to check the windows against data:
- Download 1h candles for the symbol and period you care about.
- For each bar compute the range as a percentage of its close, so that $100 candles and $20 candles are comparable.
- Group all bars by their UTC hour and average the range and the volume for each of the 24 hours.
- Index the volume so the all-hour mean equals 100; that makes "this hour is 1.6× a normal hour" readable at a glance.
- Sum the hours inside each kill zone and compare the share of volume captured with the share of the day the window occupies.
``` range_pct(bar) = (high - low) / close * 100 hour_avg_range% = mean(range_pct of all bars with that UTC hour) hour_vol_index = mean(volume at hour) / mean(volume over all hours) * 100 zone_share_vol% = sum(volume inside zone) / sum(volume all hours) * 100 zone_share_day% = zone_hours / 24 * 100 concentration = zone_share_vol% / zone_share_day% # 1.0 = no concentration
UTC_start = NY_start + 5 (US winter) | NY_start + 4 (US summer) ```
And the mechanical version of the Asian-range idea, which is what the study later on this page uses:
AsianHigh  = max(high) over 00:00-06:59 UTC
AsianLow   = min(low)  over 00:00-06:59 UTC
TookHigh   = any high in 07:00-09:59 UTC  >  AsianHigh
TookLow    = any low  in 07:00-09:59 UTC  <  AsianLow
BackInside = after the take, a 1h bar in the same window
             closes between AsianLow and AsianHigh
These rules are deliberately crude. A discretionary trader marking the same chart by eye would place the box differently, ignore a one-tick poke, or extend the window by thirty minutes. Keep that in mind when you read any statistic built on rules like these: the number describes the rule, not the concept.
Default settings and variations
The table below gives the four windows in New York time and both UTC variants, together with what they actually delivered in the SOL sample described in the example section.
| Window | New York | UTC (winter) | UTC (summer) | Hours | % of day | % of volume | Avg range |
|---|---|---|---|---|---|---|---|
| Asian | 20:00–00:00 | 01:00–05:00 | 00:00–04:00 | 4 | 16.7% | 14.5% | 0.817% |
| London | 02:00–05:00 | 07:00–10:00 | 06:00–09:00 | 3 | 12.5% | 10.7% | 0.735% |
| New York | 07:00–10:00 | 12:00–15:00 | 11:00–14:00 | 3 | 12.5% | 19.7% | 1.105% |
| London close | 10:00–12:00 | 15:00–17:00 | 14:00–16:00 | 2 | 8.3% | 12.3% | 1.007% |
Common variations you will encounter:
- Shorter windows. Some versions trim the New York kill zone to two hours around the US cash open, on the argument that the first hour does most of the work.
- "Macro" windows. Parts of the material mark much shorter blocks of twenty minutes or so around the top of certain hours. Definitions vary a lot and the sample size inside such windows is tiny; treat them as the most speculative layer.
- Asian range boundaries. 00:00–07:00 UTC, 00:00–06:00 UTC, or the Tokyo cash session only. The wider the box, the fewer days it gets broken.
- Local-time marking. Some traders ignore New York entirely and just mark the two or three busiest hours they personally observe on their own chart. This is arguably the most honest version, because it is derived from the instrument in front of you.
- Crypto-specific hours. Perpetual funding settles on a fixed schedule — on many venues at 00:00, 08:00 and 16:00 UTC — and large options expiries cluster on Friday mornings UTC. These create their own hourly seasonality that has nothing to do with forex sessions.
For timeframe: kill zones are an intraday concept. On 1h candles a three-hour window is three bars, which is about the coarsest resolution that still makes sense. Most people marking them work on 15m or 5m and use the 1h or 4h only for context.
How to read it
Read Figure 1 before you read any chart. Two things matter: where the volume index rises above 100, and where the average range rises above the all-hour average — in this sample, 0.833%.
In the SOL data the picture is blunt. The four busiest hours by volume were 14:00, 15:00, 13:00 and 12:00 UTC, and the four hours with the largest average range were exactly the same four. That block covers the US pre-open macro data window (13:30 UTC in winter), the US equity cash open (14:30 UTC in winter) and the first hour after it. Everything the session framework claims about "the US hours dominate" is visible there.
The per-zone numbers sharpen it. The New York window took 19.7% of all volume while occupying 12.5% of the day — about 1.6 times its fair share. London close took 12.3% in 8.3% of the day, about 1.5 times. The Asian window took 14.5% in 16.7% of the day, slightly below its share. And the London window took 10.7% in 12.5% of the day, also below, with an average range of 0.735% against an all-hour mean of 0.833%.
That last result is worth sitting with. In this sample, on this asset, over this period, the London kill zone was the quietest of the four windows on both measures. That does not mean the London window is useless; it means the simple claim "kill zones are where the volatility is" survives for the US hours and fails for the London hours on SOL. A trader who assumed otherwise would have been drawing boxes around below-average activity.
On the chart itself, reading a kill zone is just this: inside the band, you are allowed to look for whatever setup you trade. Outside it, you are not. The band says nothing about direction.
How traders use it
1. As a pure time filter. The most defensible use. You define your setup elsewhere — a liquidity sweep, a change of character, a fair value gap retest — and simply refuse to take it outside the chosen hours. When it helps: it cuts the number of low-conviction trades taken during thin hours, and it stops the screen-watching that produces most overtrading. When it fails: a crypto market that trends hard for three days does not care about your hours, and a filter that removes 80% of the day also removes the trades that would have worked. In a sustained trend, the restriction mostly costs you.
2. Asian range sweep into the European or US session. Mark the overnight high and low, then watch whether the London or New York window runs one of them and fails to hold. A trader working this way typically waits for the level to be taken, for price to close back inside the range, and then for a lower-timeframe structure break in the opposite direction — the sweep → CHoCH → entry sequence described elsewhere in this series. When it works: on balanced, two-sided days where the overnight range is genuinely narrow and the session brings new participants. When it fails: on trend days, when the range is taken and simply keeps going, and on days when the overnight range was already wide, so there is nothing nearby to run.
3. Session-based range expansion. Some traders use the windows as a timing estimate for the day's high or low — the assumption being that if the daily extreme has not printed by the end of the New York window, it probably printed in the Asian or London hours. When it works: on days with a single clean directional expansion. When it fails: in crypto specifically, because overnight news, Asian-hours liquidation cascades and weekend flow routinely put the day's extreme outside every window on the list.
4. Risk and execution management. A quieter use, and often the most valuable. If the average 1h range during the London window is 0.735% and during the New York window 1.105%, the same stop distance means different things at different times. Traders scale position size, stop width and expected target by the hour, and avoid resting large orders through the thinnest hours where a single sweep can take out a stop that would never have been touched at 14:00 UTC. When it fails: averages are averages; a single funding-driven cascade at 03:00 UTC can exceed anything the US session produced that week.
Example on a real SOL chart
The dataset is SOL/USDT perpetual futures on Binance, 1h candles, from 2026-07-12 to 2026-11-09 — 119 days, ending with a close at 86.57. Kill zones are marked in UTC for US winter time (New York = UTC−5): Asian 01–05, London 07–10, New York 12–15, London close 15–17. During the summer portion of this window those blocks sat one hour earlier in UTC, which is a real source of smearing in the hourly averages and worth remembering before over-reading any single hour.
The hour-of-day result was described above and is the clearest finding in the sample: volume and range both peaked at 14:00 and 15:00 UTC, with 13:00 and 12:00 next, and the New York window carried 19.7% of all traded volume in 12.5% of the day at an average range of 1.105% versus 0.833% for a typical hour. The London close window was second on both measures. The Asian and London windows were slightly below average.
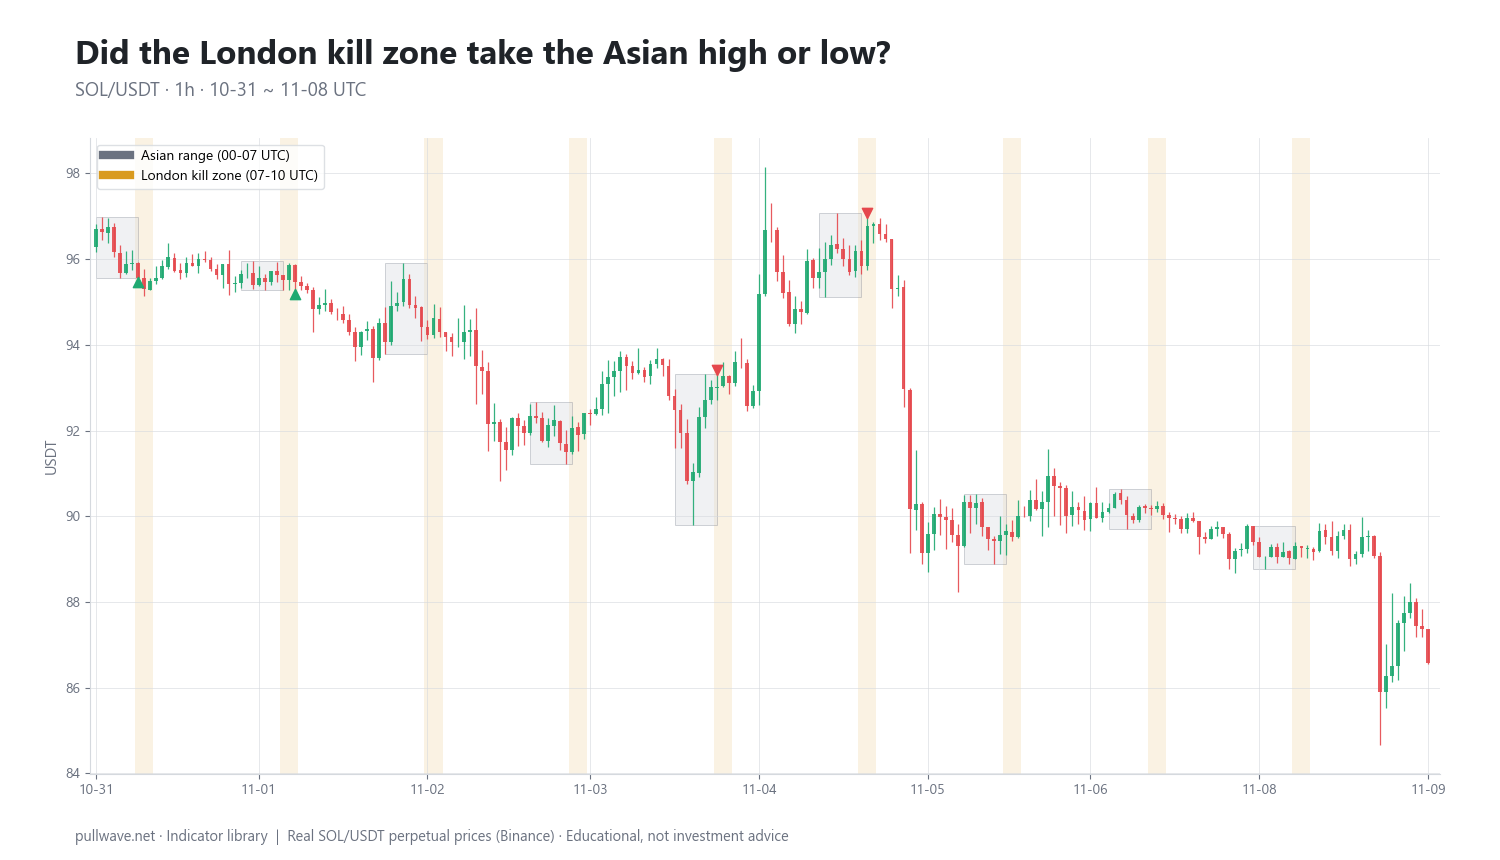
Figure 2 zooms into the last nine days of the window: 1h candles with the Asian range (00:00–07:00 UTC) drawn as a box each day and the London kill zone (07:00–10:00 UTC) shaded, with markers where the London window traded through the Asian high or the Asian low.
Run over all 119 days with the mechanical rules given earlier, the Asian-range study produced:
- London took the Asian high on 38 days
- London took the Asian low on 42 days
- It took both on 4 days
- It took neither on 43 days
- Either side was taken on 63.9% of days
- Of the high sweeps, 28 saw a later 1h bar in the same window close back inside the range
- Of the low sweeps, 31 saw a later 1h bar close back inside
How to read that honestly. A roughly two-thirds break rate is what you would expect from a narrow overnight box followed by a more active three-hour window — a random walk with any volatility at all breaks a tight range most days. The split between highs and lows (38 versus 42) is close to even, which is the correct result for a direction-free statistic and a sign the rule is not secretly measuring the trend. The "closed back inside" counts — 28 of 38 and 31 of 42 — tell you that on this asset, in this period, a majority of London sweeps did not immediately run away; most of them came back into the range at least once within the window.
What the study does not tell you is whether any of that was tradeable. It measures only whether a level was touched and whether a bar closed back inside. It does not measure where price was six or eighteen hours later, it does not account for the spread, funding or slippage on a perpetual, and it does not test entries or stops. A sweep that closes back inside and then chops sideways for a day counts identically to one that reverses cleanly. This is one asset, one 119-day window, and one arbitrary definition of the box. Another trader marking the same chart by eye would mark different levels and get different counts.
Common mistakes
- Getting the timezone wrong. This is the single most common error. A chart set to local time will slide the boxes twice a year, and a chart set to "exchange time" may not be in New York or UTC at all. Fix the chart timezone once and convert deliberately.
- Forgetting daylight saving. The New York windows move one hour in UTC twice a year. If your analysis spans a DST change — as the sample above does — the hourly averages blur together across the boundary.
- Treating the window as a signal. "It is the London kill zone" is not a reason to do anything. The window is a filter on attention; the trade still needs a level, a structure read and a risk plan.
- Hindsight marking. On a finished chart, every box you draw contains something that looks important. The test is whether you could have marked it in advance and stated the invalidation before the bar closed.
- Importing forex sessions without checking the asset. Crypto has no official open, no gap, and funding and expiry schedules of its own. The data above shows the London window underperforming on SOL — the labels do not guarantee the behaviour.
- Over-filtering. Restricting yourself to seven hours of a 24-hour market removes roughly two-thirds of the opportunity set. That is only worth it if the hours you keep are genuinely better, which you need to verify per asset.
- Ignoring scheduled events. A large part of the 13:00–15:00 UTC spike is US macro data and the equity cash open. That is calendar risk, not "smart money." A window that is active because of a data release is also a window where spreads widen and stops get filled badly.
Combining it with other tools
Kill zones are the weakest tool in the smart-money toolkit on their own and one of the more useful ones as a layer. The natural combinations:
- Liquidity sweeps and equal highs/lows. The time window tells you when to watch; the liquidity map tells you what to watch. An equal-highs cluster sitting just above the Asian range going into the New York window is the standard setup this framework describes.
- Market structure and change of character. A sweep inside a window means little until the lower-timeframe structure actually breaks against it. The window narrows the search; the structure break is the trigger.
- Order blocks and fair value gaps. These supply the level for an entry and for an invalidation. Without one, "it swept in the kill zone" has no place to put a stop.
- Displacement and imbalance. A large, one-sided candle leaving an unfilled gap inside an active window is a far stronger reading than the same candle at 04:00 UTC on a Sunday. Timing and displacement reinforce each other.
- Volume confirmation. The hourly volume index from Figure 1 is the honest version of this. If a sweep happens on volume below the normal level for that hour, be sceptical of it regardless of which box it fell in.
- Top-down multi-timeframe work. The higher timeframe decides direction and the premium/discount context; the kill zone decides when you are allowed to act on it.
A practical checklist, usable before you risk anything:
| Check | What to confirm |
|---|---|
| Clock | Chart fixed to UTC; window converted for the correct DST period |
| Context | Higher-timeframe direction and premium/discount location known in advance |
| Level | A specific liquidity pool (session high/low, equal highs, prior day extreme) marked before the window opens |
| Activity | Volume in the window at or above the normal level for that hour |
| Trigger | Structure break or displacement after the sweep, not the sweep alone |
| Invalidation | A price that proves the read wrong, defined before entry |
| Calendar | Scheduled macro release, funding settlement or expiry inside the window noted |
If you want to test this without money: pick one asset, export a few hundred days of 1h candles, and build the hour-of-day table yourself. Then forward-mark a chart for a month — write down the window, the level and the invalidation before the window opens, and score the outcome at a fixed horizon such as 6 and 18 bars later. A journal of pre-marked calls is the only way to separate a real time effect from the comfort of a finished chart.
Frequently asked questions
Q. What are the ICT kill zone times in UTC?
With New York on standard time (UTC−5) the commonly cited windows are Asian 01:00–05:00 UTC, London 07:00–10:00 UTC, New York 12:00–15:00 UTC and London close 15:00–17:00 UTC. During US daylight saving time (UTC−4) each window sits one hour earlier in UTC: 00:00–04:00, 06:00–09:00, 11:00–14:00 and 14:00–16:00. Different sources shift the edges by an hour, so treat them as approximate blocks rather than exact boundaries.
Q. Do kill zones make sense in crypto if it trades 24/7?
Partly. Crypto has no official open, no close and no weekend gap, but the volume still follows the hours when European and American participants are at their desks. In 119 days of SOL/USDT 1h data the New York window carried 19.7% of all volume in 12.5% of the day, while the London window carried 10.7% — below its share — so the concentration is real but not evenly distributed across the four named windows.
Q. What is the best session to trade crypto?
There is no universally best session, and the answer depends on the asset and on what you are trying to do. In the SOL sample the four busiest and widest-ranging hours were 12:00–16:00 UTC, which spans US macro releases and the US equity cash open, so a trader looking for movement had the most of it there. More activity also means wider spreads and faster moves against you, so it is not automatically the easiest time to trade.
Q. What is the Asian range and how do traders use it?
The Asian range is the high and low built during the quiet overnight hours — commonly 00:00–07:00 UTC — treated as an obvious pool of resting stop orders. Traders watch whether the European or US session runs one side of it and then closes back inside, which the framework reads as a failed break. In the SOL study, London traded through one side on 63.9% of days, and a bar later closed back inside the range on 28 of 38 high sweeps and 31 of 42 low sweeps.
Q. Do I need to change my kill zones for daylight saving time?
If you mark windows in UTC, yes — the New York-based windows move one hour earlier in UTC when the US switches to daylight saving, and back again in the autumn. If you mark them directly in New York time on a chart set to that timezone, the adjustment happens automatically. Mixing the two approaches is the most common reason traders find their boxes landing in the wrong place.
Q. Is there any evidence that kill zones give a trading edge?
Intraday seasonality — volume and volatility clustering around the active cash-market hours — is a long-documented feature of financial markets and is clearly visible in crypto data. The further claim, that specific windows reliably produce tradeable reversals because large players are hunting stops on a schedule, is the framework's hypothesis about order flow and has no independent or peer-reviewed support. Concentration of activity is a measurable fact; a profitable edge from trading those hours is not.
Key takeaways
- Kill zones are time filters, not signals: they tell you when to look, never what to do or which direction to take.
- The windows are quoted in New York time and move one hour in UTC with US daylight saving — fix your chart to a single timezone and convert deliberately.
- In 119 days of SOL/USDT 1h data, volume and range concentrated sharply around 12:00–16:00 UTC; the New York window ran about 1.6× its fair share of volume while the London window ran below average on both measures.
- The Asian range was broken by the London window on 63.9% of days, with most sweeps seeing a close back inside — a description of how narrow ranges behave, not evidence that trading them is profitable.
- The underlying session effect is old and well documented; the "smart money hunts stops on a schedule" explanation is a hypothesis, and any window should be re-checked on the specific asset and period you actually trade.
Educational material. Charts use real SOL/USDT perpetual prices; past behaviour does not predict future results. Not investment advice.