Indicator & technique library · Smart money concepts (SMC/ICT)
Liquidity Sweeps Explained: Stop Hunts, Rules, Examples
At a glance
- A liquidity sweep is a bar that trades beyond a prior swing high or low and then closes back inside it — a false breakout seen through an order-flow lens.
- Stop orders, breakout orders and liquidation triggers cluster just beyond obvious highs and lows, which is why those levels often produce a burst of volume and a quick reversal.
- The popular 'smart money hunts your stops' story is an unproven hypothesis; only the mechanical clustering of resting orders is observable.
- On SOL/USDT 4h between 2026-10-06 and 2026-11-09, 11 sweeps were detected and 9 of 11 moved in the implied direction after 6 bars — but most of the low-sweep bounces had faded 18 bars later.
A liquidity sweep is a single event on a chart: price pushes beyond a prior swing high or swing low, triggers the orders resting there, and then closes back inside the old range. Traders who use the vocabulary of "smart money concepts" (SMC) call it a sweep, a liquidity grab, or a stop hunt. Traders who learned the chart a generation earlier call almost the same thing a false breakout, a failed breakout, a Wyckoff spring or upthrust, or simply a long wick at support.
The reason the idea gets attention is practical, not mystical. Protective stops and breakout orders genuinely do cluster just beyond obvious levels, so those levels are where resting orders get converted into market orders. Whether anyone deliberately targets them is a separate claim — and a much weaker one. This page explains what a sweep is, how to mark it with rules precise enough that two people would agree, how discretionary traders use it, and where it fails.
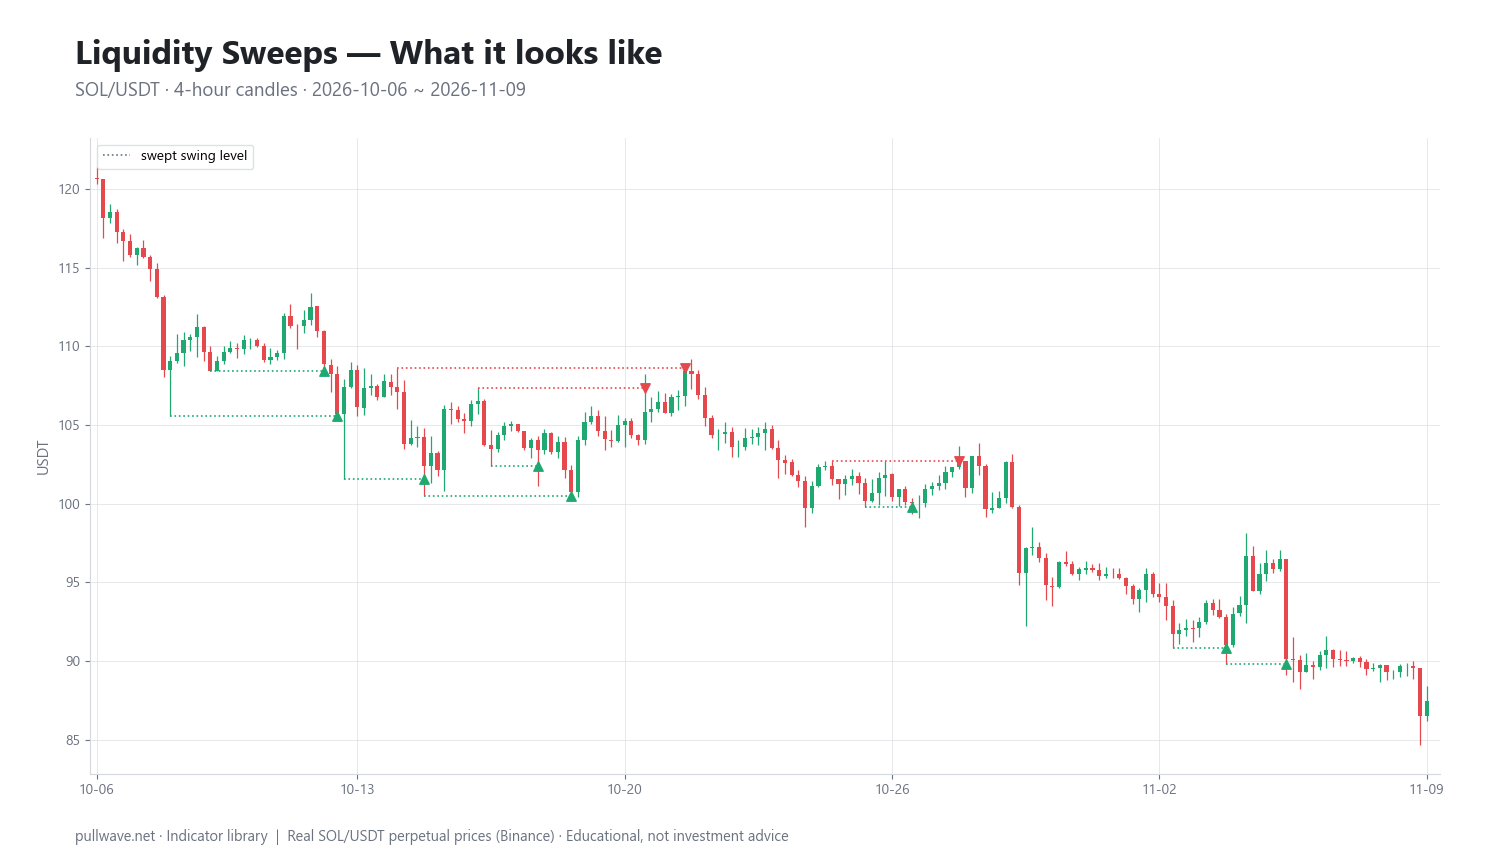
Figure 1 shows real SOL/USDT 4h candles. Each dotted line runs from an earlier swing high or swing low to the later bar that wicked beyond that level and then closed back inside it; a triangle marks the sweep bar. Notice that the levels being swept are obvious ones — prior pivots that anyone drawing horizontal lines would have drawn.
What is a liquidity sweep?
In this context, "liquidity" means resting orders that can be filled: limit orders in the book and, more importantly for this concept, stop orders that become market orders the moment they are touched.
- Buy-side liquidity sits above swing highs and equal highs. It is made of stop-losses from short positions, stop-entries from breakout buyers, and liquidation triggers for leveraged shorts. All of those become buy orders when price trades through.
- Sell-side liquidity sits below swing lows and equal lows: stops from longs, breakdown sell-entries, and long liquidations.
A liquidity sweep is a bar that reaches into one of those pools and then closes back on the original side of the level. The level is touched, the orders are consumed, and the close says the market could not hold the new ground. A breakout, by contrast, is a bar that reaches the same pool and closes beyond it.
That distinction — wick beyond, close back inside — is the entire mechanical definition. Everything else layered on top (who did it, why, what it "means") is interpretation.
The idea behind it (theory and history)
The failed-breakout idea is old. Richard Wyckoff's work in the first half of the twentieth century described the spring (a drop below the low of a trading range that is quickly recovered) and the upthrust (the mirror image above resistance) as tests that reveal whether supply or demand is actually in control. Dow-theory swing structure and ordinary support/resistance teaching carry the same observation: levels everyone can see attract orders, and some probes of those levels fail.
The modern vocabulary — liquidity sweep, liquidity grab, buy-side/sell-side liquidity, stop hunt — comes mainly from ICT ("Inner Circle Trader", Michael J. Huddleston) and the wider SMC community that grew around online videos from roughly the mid-2010s onward. These are discretionary chart-reading methods taught informally; definitions differ between teachers, and the terminology has shifted over time (for example, "market structure shift" and "change of character" are used by different people for overlapping ideas).
Be careful with the story attached to it. Proponents argue that institutions deliberately drive price into stop clusters to fill large orders against the resulting flow. That is a hypothesis about order flow, not an established fact; there is no peer-reviewed or independent evidence that SMC patterns in general provide a trading edge. What is observable and uncontroversial is narrower: stop and breakout orders cluster beyond obvious levels, those clusters produce bursts of volume and brief price extensions when touched, and in leveraged markets forced liquidations add to that burst mechanically. You do not need an intentional predator to explain a long wick.
How it is calculated
A sweep is a pattern, not an averaged indicator, so "calculation" means a detection rule. The rule used for the example on this page is deliberately mechanical:
- Find swing points with a fractal. A bar is a swing high if its high is greater than the highs of the 5 bars before and the 5 bars after it. A swing low is the mirror image with lows.
- Keep only unbroken levels. Once any bar closes beyond a swing level, that level is considered broken and is no longer a sweep candidate.
- Keep only recent levels. The level must be no older than 60 bars at the time of the sweep. Stale pivots that nobody is watching are excluded.
- Test each new bar. If the bar's high trades above an unbroken swing high but its close is back below that high, mark a sweep of a high (down arrow). If the bar's low trades below an unbroken swing low but its close is back above it, mark a sweep of a low (up arrow).
``` SwingHigh(i) = High[i] > max(High[i-5..i-1]) and High[i] > max(High[i+1..i+5]) SwingLow(i) = Low[i] < min(Low[i-5..i-1]) and Low[i] < min(Low[i+1..i+5])
valid(level) = no bar has CLOSED beyond it AND age <= 60 bars
SweepHigh(t) = High[t] > level_high AND Close[t] < level_high -> arrow down SweepLow(t) = Low[t] < level_low AND Close[t] > level_low -> arrow up ```
Two timing details matter. First, a 5-bar fractal is only confirmed five bars after the pivot printed — on a 4h chart that is twenty hours of delay before the level officially exists. Second, a sweep is only a sweep at the close. Until the candle closes, the identical price action is a breakout in progress.
Default settings and variations
| Setting | Default here | Why |
|---|---|---|
| Fractal width | 5 bars each side | Filters minor noise; wide enough that the pivot is visible to most chart readers |
| Level validity | No close beyond it | A level that has been closed through is no longer untested liquidity |
| Maximum level age | 60 bars | Keeps the focus on levels traders are still watching |
| Close condition | Same bar closes back inside | Separates a rejected probe from a genuine breakout |
| Timeframe | 4h | Enough structure per bar to be meaningful; fewer false pivots than 5m–15m |
Common variations you will see:
- Equal highs/lows. Many traders only count sweeps of double or triple tops and bottoms, on the argument that a flat shelf of highs concentrates more stops than a single pivot.
- Tighter or wider fractals. 2–3 bars each side gives far more sweeps and far more noise; 8–10 bars gives few, higher-quality levels.
- Close-depth filter. Requiring the close to return below the level and below the midpoint of the swept range, which rejects marginal wicks.
- Displacement requirement. Requiring a strong impulse bar (and sometimes a price gap or imbalance) after the sweep before the event counts.
- Volume or ATR filters. Requiring the sweep bar's volume to exceed a recent average, or the wick to exceed some fraction of ATR.
- Time-based levels. Prior day/week highs and lows, or session highs and lows. Crypto has no exchange session gaps, so the session versions of this idea port over poorly; daily and weekly opens still function as widely watched reference prices.
How to read it
Read a sweep as information about failure, not as a forecast. The useful statement is: "price reached the orders above that high and could not hold there within this bar." The useless statement is: "therefore it will now reverse."
Things worth checking on each sweep:
- How obvious was the level? A clean double top that has held for weeks concentrates more resting orders than a random pivot inside chop.
- How deep and how fast was the probe? A long wick retraced within the same bar implies the move beyond the level found immediate opposition.
- What happened on the next few bars? Most discretionary traders want to see the market also break structure in the opposite direction before treating the sweep as meaningful.
- What is the higher-timeframe context? A sweep of a low inside a daily downtrend and a sweep of a low at the bottom of a six-week range are very different situations with the same chart signature.
How traders use it
1. Sweep plus structure shift. The most common discretionary workflow: wait for a sweep, then wait for price to break the most recent opposing swing point (what different teachers call a market structure shift or change of character), then look for entries on a retracement into the area the impulse came from. The sweep alone is not treated as the trigger. Works best when higher-timeframe direction agrees. Fails in strong one-way trends, where a sweep of a low in a downtrend produces a small bounce and then continuation, and in chop, where structure flips constantly and every shift is noise.
2. Range extremes. Inside a balanced range, probes of the range high and low that close back inside are the classic Wyckoff upthrust and spring. Traders fade them toward the midpoint. Works best when the range is wide, mature and has already produced several failed probes. Fails at exactly the moment the range resolves — and the losing trade at the breakout is usually larger than the winners from fading, because the breakout is where the trend starts.
3. Stop placement and order location. Many traders use the concept defensively rather than as a signal: do not park a stop one tick under the obvious swing low; place it beyond the wick that a sweep would plausibly produce, sized down so the wider stop does not increase risk. Resting limit orders are sometimes placed slightly beyond a level rather than at it, for the same reason.
4. Targets. Untouched liquidity pools — an old double bottom, a cluster of equal highs — are often used as logical take-profit areas, on the argument that price tends to travel toward resting orders. This is the least controversial use, because it mostly restates "prior highs and lows act as magnets and as resistance," which is ordinary support/resistance practice.
Example on a real SOL chart
The numbers below come from SOL/USDT perpetual on Binance, 4h candles, between 2026-10-06 and 2026-11-09, using exactly the rule described above (5-bar fractal, unbroken level, maximum age 60 bars, same-bar close back inside). In that window the rule detected 11 sweeps: 8 sweeps of lows and 3 sweeps of highs. The last close of the window was 87.44.
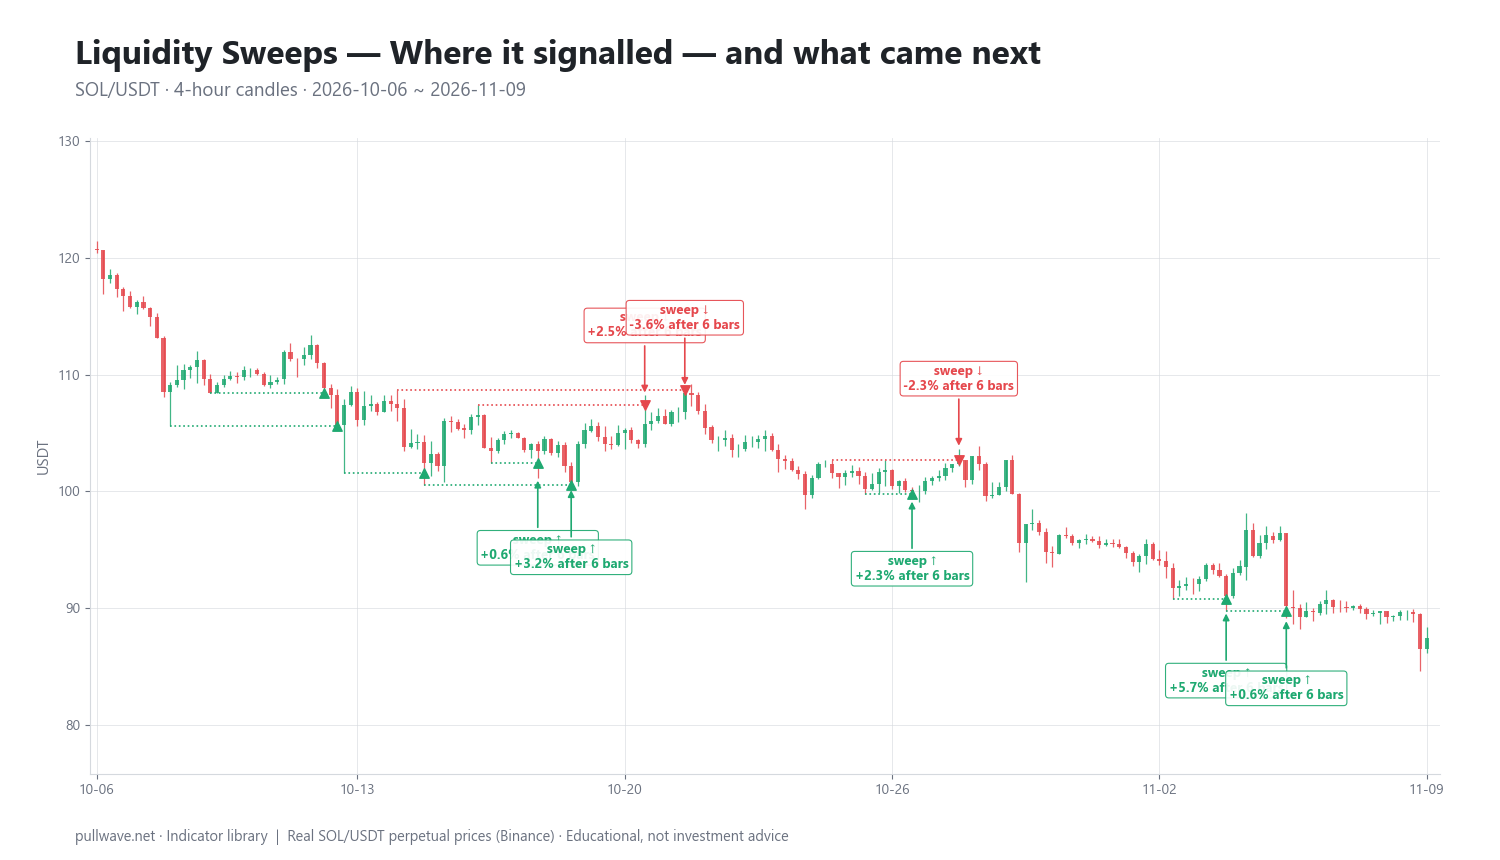
Figure 2 marks those sweeps on the same chart together with the percentage move six bars later. The table lists 10 of the 11 detected events — one sweep of a low is not tabulated here, which is why the rows below count 7 low sweeps and 3 high sweeps rather than the full 8 and 3.
Read the two right-hand columns as raw price change, not as a success score: a positive number means price was higher than at the sweep, a negative number means it was lower. So for a sweep of a low, the implied direction is a positive number; for a sweep of a high, the implied direction is a negative one.
| Date (UTC) | Type | Price at sweep | Change after 6 bars | Change after 18 bars |
|---|---|---|---|---|
| 2026-10-12 20:00 | sweep ↑ (low) | 105.70 | +1.02% | −0.30% |
| 2026-10-15 00:00 | sweep ↑ (low) | 102.42 | +2.79% | +2.00% |
| 2026-10-17 20:00 | sweep ↑ (low) | 103.42 | +0.63% | +2.95% |
| 2026-10-18 16:00 | sweep ↑ (low) | 100.78 | +3.19% | +7.41% |
| 2026-10-20 12:00 | sweep ↓ (high) | 105.81 | +2.49% | −1.02% |
| 2026-10-21 12:00 | sweep ↓ (high) | 108.44 | −3.56% | −8.04% |
| 2026-10-27 04:00 | sweep ↑ (low) | 100.05 | +2.26% | −2.77% |
| 2026-10-28 08:00 | sweep ↓ (high) | 102.71 | −2.31% | −6.70% |
| 2026-11-04 00:00 | sweep ↑ (low) | 91.03 | +5.72% | −1.11% |
| 2026-11-05 12:00 | sweep ↑ (low) | 90.16 | +0.60% | −0.52% |
Across all 11 detected events, 9 of 11 moved in the implied direction six bars after the sweep. In the ten rows above, every sweep of a low was higher after six bars, and two of the three sweeps of highs were lower (−3.56% and −2.31%); the exception was 2026-10-20, where price was 2.49% higher six bars after a high had been swept.
That looks supportive until you extend the holding period. Eighteen bars (three days) later, most of the low sweeps had given everything back: 2026-11-04 was up 5.72% after six bars and 1.11% below the sweep price by bar 18, and 2026-10-27 went from +2.26% to −2.77%. The three sweeps of highs were all lower at bar 18, two of them substantially so (−8.04% and −6.70%), meaning price kept moving in the direction those sweeps implied.
The honest reading is that this was a declining market: price worked from the 105–108 area down to a last close of 87.44. In that environment, sweeps of lows produced quick bounces that mostly faded, and sweeps of highs pointed the same way as the dominant trend and persisted. The pattern did not predict direction; the trend did most of the work, and the holding period changed the answer completely.
Treat this as one illustration on one market over about five weeks. Eleven events is far too small a sample to conclude anything, the detection rule is only one of many reasonable ones, and a different fractal width or a requirement for equal highs would have produced a different list of sweeps and different numbers.
Common mistakes
- Marking sweeps in hindsight. On a finished chart every wick looks intentional. The discipline test is simple: could you have written down the level, in advance, five bars before the sweep? If not, you are describing the past.
- Acting before the close. A sweep and a real breakout are visually identical while the candle is forming. Reacting mid-bar means guessing which one it will be.
- Ignoring the regime. Fading probes works in ranges and punishes you in trends. The same wick means something different at the bottom of a six-week range and in the fourth week of a downtrend.
- Dropping to tiny timeframes. On 1m and 5m crypto charts, almost every bar sweeps something. The signal-to-noise ratio collapses and fees plus funding eat the small moves.
- Treating the narrative as fact. "Someone hunted my stop" is emotionally satisfying and operationally useless. The actionable fact is that the stop sat at an obvious price with many others.
- Over-widening stops. Using sweeps as an excuse to place stops far away without reducing size converts a small loss into a large one.
Crypto specifics. Markets trade 24/7, so there are no overnight gaps and no session opens to anchor liquidity to; weekend and low-volume hours produce thinner books where a modest order moves price further, which inflates wick length. On perpetual futures, leveraged positions are liquidated automatically, and those liquidations are forced market orders clustered at predictable prices — a liquidation cascade can extend a probe well past a level and then snap back, producing a textbook-looking sweep with no intent behind it at all. Funding payments and scheduled macro releases add their own spikes. None of this invalidates the concept; it means wick extremes in crypto are noisier than in slower markets, and position size matters more than pattern quality.
Combining it with other tools
A sweep is a location and a failure, so it pairs naturally with tools that supply direction, confirmation or timing.
- Market structure. Most discretionary workflows require a break of the last opposing swing after the sweep before considering the event valid. This is simply Dow-theory swing analysis with newer labels.
- Volume. A sweep bar with a clear volume spike is at least consistent with resting orders being filled. Low volume on a deep wick in a thin session suggests nothing more than an absent order book.
- Support/resistance and Fibonacci retracements. A sweep that occurs at a level you had already drawn for independent reasons — a prior consolidation, a 61.8% retracement, a volume shelf — has more context than one floating in open air.
- Momentum oscillators. A sweep of a low where RSI makes a higher low is the classic bullish divergence setup described in much older literature, now wearing different clothing.
- Higher-timeframe bias. A simple moving average or weekly structure read filters out the sweeps that argue against the dominant trend — which, as the SOL window above shows, are the ones most likely to produce a bounce that does not last.
The common thread: use the sweep for where, use something else for whether.
Frequently asked questions
Q. What is a liquidity sweep in trading?
A liquidity sweep is a price move that trades beyond a prior swing high or swing low — where stop orders and breakout orders tend to rest — and then closes back inside the previous range within the same bar. Mechanically it is a false breakout. The term comes from smart money concepts (SMC) and emphasizes that resting orders at that level were filled before price reversed.
Q. What is the difference between a liquidity sweep and a stop hunt?
They describe the same chart event with different emphasis. "Liquidity sweep" is descriptive: orders beyond a level were consumed and price returned. "Stop hunt" adds an intent claim — that someone deliberately pushed price to trigger stops. The sweep is observable on the chart; the intent is a hypothesis that cannot be verified from candles alone.
Q. Do banks and market makers really hunt retail stops?
Proponents of SMC argue that large participants drive price into stop clusters to source liquidity for big orders, but this is the framework's interpretation of order flow, not a documented or independently verified fact. What is established is narrower: stops and breakout orders cluster beyond obvious levels, and in leveraged crypto markets forced liquidations add automatic market orders there. That clustering alone can produce the same wicks without anyone targeting you.
Q. How do I know if it's a liquidity sweep or a real breakout?
You do not know until the bar closes — that is the honest answer and the main limitation of the concept. Before the close, a sweep and a genuine breakout look identical. Most traders therefore wait for the candle to close back inside the level, and many also wait for a subsequent break of structure in the opposite direction before treating the sweep as meaningful.
Q. What timeframe works best for liquidity sweeps in crypto?
There is no objectively best timeframe, but 1h, 4h and daily charts generally give cleaner levels than 1m–15m, where almost every bar sweeps something and fees plus funding consume the small resulting moves. Because crypto trades 24/7 with no session gaps, many traders anchor levels to the daily and weekly open and to prior day/week highs and lows rather than to exchange sessions.
Q. Is a liquidity sweep the same as a Wyckoff spring?
They describe overlapping price behavior. A Wyckoff spring is a drop below the low of a trading range that is quickly recovered, interpreted as a test of supply; a sweep of a low is the same shape defined by a close-back-inside rule. The main differences are vocabulary, the stricter range context Wyckoff required, and the order-flow story attached to the modern version.
Key takeaways
- A liquidity sweep is a bar that wicks beyond an unbroken swing high or low and closes back inside — a precisely defined false breakout, nothing more exotic than that.
- The observable fact is that stops, breakout orders and liquidation triggers cluster beyond obvious levels; the claim that institutions deliberately hunt them is an unproven hypothesis and should be labeled as such.
- Sweeps are not predictions: a real breakout looks identical until the candle closes, which is why most discretionary traders also require a structure shift and higher-timeframe context before acting.
- In the SOL/USDT 4h window from 2026-10-06 to 2026-11-09, 11 sweeps were found and 9 of 11 moved in the implied direction after six bars — but most low-sweep bounces had faded by bar 18 in a market that closed at 87.44. One small window, one rule set, no proof.
- The concept's most durable value may be defensive: knowing where resting orders cluster is a better reason to adjust stop placement and size than to take a trade.
Educational material. Charts use real SOL/USDT perpetual prices; past behaviour does not predict future results. Not investment advice.