Indicator & technique library · Smart money concepts (SMC/ICT)
Fair Value Gaps (FVG) Explained: Rules, Reading, Uses
At a glance
- A fair value gap is a three-candle pattern where candle 1's high sits below candle 3's low (bullish) or candle 1's low sits above candle 3's high (bearish), leaving a price range the middle candle traded through quickly.
- It is a descriptive chart feature, not a signal: proponents argue price tends to 'rebalance' such gaps, but there is no independent evidence that trading them produces an edge.
- Traders use gaps as pullback areas in a trend, as retracement targets, and as flip zones when a gap fails (inverse FVG).
- On SOL/USDT 1h over 3-9 Nov 2026, mechanical rules marked 14 gaps; 66.7% of the eligible ones were touched and 58.3% filled within 20 bars - one window, not proof.
A fair value gap (FVG), also called an imbalance, is a small range on the chart that price crossed so quickly that the candles on either side never overlapped it. In its standard form it is a three-candle pattern: the first candle's high stays below the third candle's low (a bullish gap), or the first candle's low stays above the third candle's high (a bearish gap). The middle candle is the fast move that creates the hole.
Traders care about FVGs because they give a precise, repeatable way to mark where a move was one-sided. The popular interpretation is that such areas get revisited later. That interpretation is a hypothesis about order flow, not a proven market law, and this page treats it that way: exact rules first, honest limits second.
What is Fair Value Gaps (FVG)?
An FVG is a price range left untraded by the wicks of the surrounding candles in a three-bar sequence. On a 24/7 crypto market there are no overnight session gaps, so an FVG is not a true gap in the stock-market sense - price did trade through the range, but only inside the body of one fast candle, without the slower two-sided auction you see when a market chops.
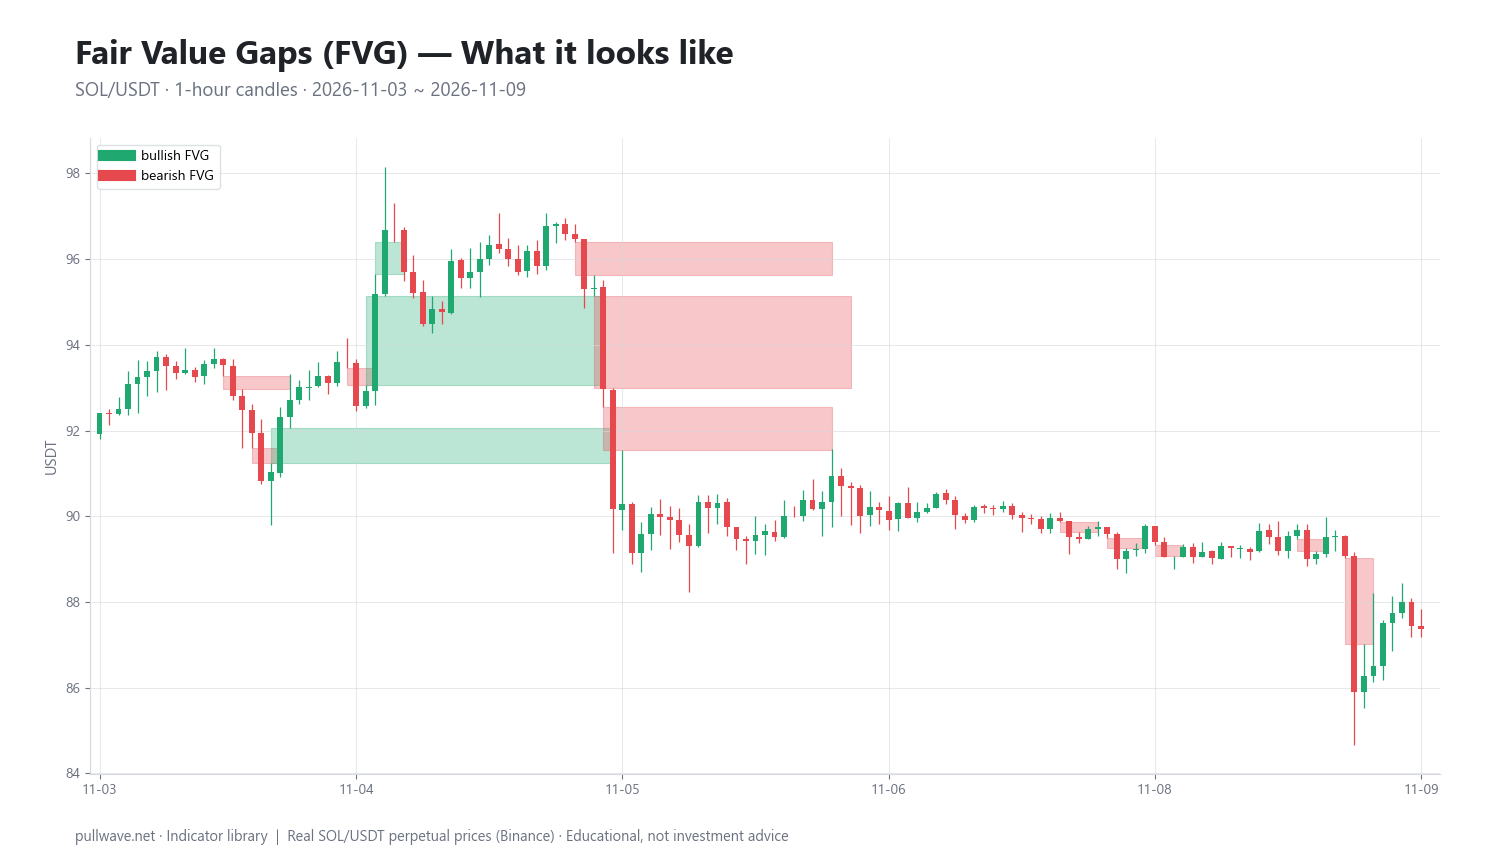
Figure 1 shows real SOL/USDT 1-hour candles with bullish and bearish three-candle gaps drawn as shaded boxes that extend to the right until price fills them. Notice that the boxes cluster around the fastest parts of the move and disappear where the market ranged.
The vocabulary varies by teacher. You will see the same object called an imbalance, an inefficiency, a liquidity void (some reserve that term for a larger, multi-candle displacement), or BISI/SIBI ("buyside imbalance, sellside inefficiency" and its mirror). The 50% level of the gap is often called the midpoint or consequent encroachment. When you read someone else's analysis, check which definition they use before comparing levels.
The idea behind it (theory and history)
The FVG as a named, rule-based pattern comes from the trading-education material published online by Michael J. Huddleston, known as ICT ("Inner Circle Trader"), and from the broader community framework usually called smart money concepts (SMC), which spread mainly through videos and forums from roughly the mid-2010s onward. It is a discretionary chart-reading method, not an indicator with a single canonical source, and definitions genuinely differ between teachers.
The story attached to it is that large participants cannot fill size in thin conditions, so price is later driven back into the untraded range to "rebalance" it before continuing. Proponents argue this is why gaps act as magnets and as entry areas. Be clear-eyed: this is the framework's explanation of order flow, not an established fact, and there is no peer-reviewed or independent evidence that FVG patterns give a trading edge.
The underlying observation is much older than the terminology. Classical technical analysis has studied price gaps for decades (Edwards and Magee's taxonomy of common, breakaway, measuring and exhaustion gaps is the standard reference), and the idea that gaps are often but not always "closed" is an old piece of market folklore. Market Profile, developed by Peter Steidlmayer with the Chicago Board of Trade from the 1980s, flags the same thing with "single prints": thin, one-sided prints that the auction frequently revisits. Volume-profile users call these low-volume nodes. An FVG is a candle-based approximation of the same phenomenon, which is a point in its favor - and a reminder that it is not new.
How it is calculated
Take three consecutive candles and call them 1, 2 and 3 from left to right.
- Bullish gap: if the high of candle 1 is below the low of candle 3, the untraded range runs from
high[1]up tolow[3]. - Bearish gap: if the low of candle 1 is above the high of candle 3, the untraded range runs from
high[3]up tolow[1]. - Size filter (optional but useful): keep the gap only if its height is at least some fraction of recent volatility, for example 0.3 x ATR(14). This throws out one-tick gaps that are pure noise.
- Extend it forward as a box from the right edge of candle 3 until price interacts with it.
- Touch: the first later bar whose wick enters the box. Partial fill: price trades into the box but turns before the far edge. Full fill: a wick passes the far edge, and the box is normally removed from the chart.
``` Bullish FVG: high[1] < low[3] -> box = [high[1], low[3]] Bearish FVG: low[1] > high[3] -> box = [high[3], low[1]]
size = box_top - box_bottom keep if size >= 0.3 * ATR14
midpoint (consequent encroachment) = (box_top + box_bottom) / 2
touch = first later bar with wick inside [box_bottom, box_top] filled = later wick beyond the far edge ```
ATR(14) is the 14-period average true range, where true range is the greatest of (high - low), |high - previous close| and |low - previous close|. Using it as the yardstick makes the filter adapt automatically as volatility rises and falls, which matters a lot in crypto.
Default settings and variations
There are no official defaults. These are the choices that actually change your chart:
| Choice | Common setting | Why it exists |
|---|---|---|
| Candles used | 3 consecutive | Smallest sequence where non-overlapping wicks can occur |
| Wicks or bodies | Wicks (highs/lows) | Body-only versions produce many more, smaller zones (sometimes called volume imbalances) |
| Size filter | None, a fixed %, or 0.3 x ATR14 | Removes noise gaps that form constantly on low timeframes |
| Expiry | Until filled, or N bars | Old untouched gaps lose relevance as the regime changes |
| Fill rule | Far edge touched | Midpoint (consequent encroachment) fill is a looser variant that counts the gap as mitigated at 50%, so it triggers earlier and on less price travel |
| Timeframe | 15m to 4h for intraday crypto | Higher timeframes give fewer, wider, more respected zones |
The three-candle definition is the near-universal core. Beyond it, people add context filters: only gaps created by a candle that broke structure, only gaps in the direction of the higher-timeframe trend, only the most recent unfilled gap, or only gaps that overlap a Fibonacci retracement zone. Each filter cuts the count and raises the subjectivity.
How to read it
Read a gap as an area of interest, never as a line with magic properties. Three questions sort most situations:
- Which direction created it? A bullish gap formed on an impulsive up-candle marks where buyers were in a hurry; a bearish gap marks the opposite. In a downtrend you will mechanically find far more bearish gaps, simply because that is where the fast candles are.
- Is it fresh? A gap that has never been touched is treated differently from one price has already dipped into. Many traders consider a gap "used" after the first reaction.
- Where does it sit? A gap in the middle of a range is low-information. A gap that lines up with a prior swing high or low, a volume-profile low-volume node, or the 50-61.8% retracement of the leg carries more weight precisely because several methods point at the same place.
One more concept worth a paragraph: the inverse FVG (IFVG). If price trades cleanly through a gap instead of reacting to it, some traders flip its meaning and watch the same box from the other side - a failed bullish gap becomes a potential resistance area. This is the familiar support-becomes-resistance idea in new clothing, and it inherits the same weakness: in a strong trend, levels get run over repeatedly.
How traders use it
1. Pullback entry area in a trend. After a break of structure, wait for price to retrace into the gap left by the impulse and look for a reaction there. Works when a genuine trend is pausing and pullbacks are orderly. Fails in ranges, where every retracement goes straight through, and in parabolic moves that never come back.
2. As a target. An unfilled gap above or below current price can be used as a logical place to take profit or to expect a reaction, on the reasoning that thin ranges often get revisited. Works in mean-reverting, chop-heavy conditions. Fails when a trend keeps leaving gaps behind and never returns - unfilled gaps can stay unfilled for months.
3. Invalidation reference. Because the box has two defined edges, it gives an objective place to say "my idea was wrong": a decisive close beyond the far edge. Works as risk discipline. Fails when everyone uses the same obvious edge; in leveraged crypto markets, wicks through clustered stops are routine.
4. Confluence filter. Use gaps only where they overlap something independently derived - a higher-timeframe level, a VWAP band, a volume node. Works to reduce the number of setups to the ones with multiple reasons. Fails as a cure-all: stacking five subjective tools can manufacture a reason for any price.
In crypto specifically: there are no session gaps, so every FVG is an intrabar-range gap; perpetual futures add funding costs that make waiting for a deep retracement expensive; and liquidation cascades create huge, fast imbalances that sometimes retrace within hours and sometimes mark the start of a new regime. Leverage turns a partial fill that overshoots by 1% into a liquidation.
Example on a real SOL chart
The window is SOL/USDT perpetual on Binance, 1-hour candles, 3 to 9 November 2026, last close 87.36. Gaps were marked mechanically: the standard three-candle rule, a minimum width of 0.3 x ATR(14), touch defined as the first later wick entering the box, fill as a wick passing the far edge.
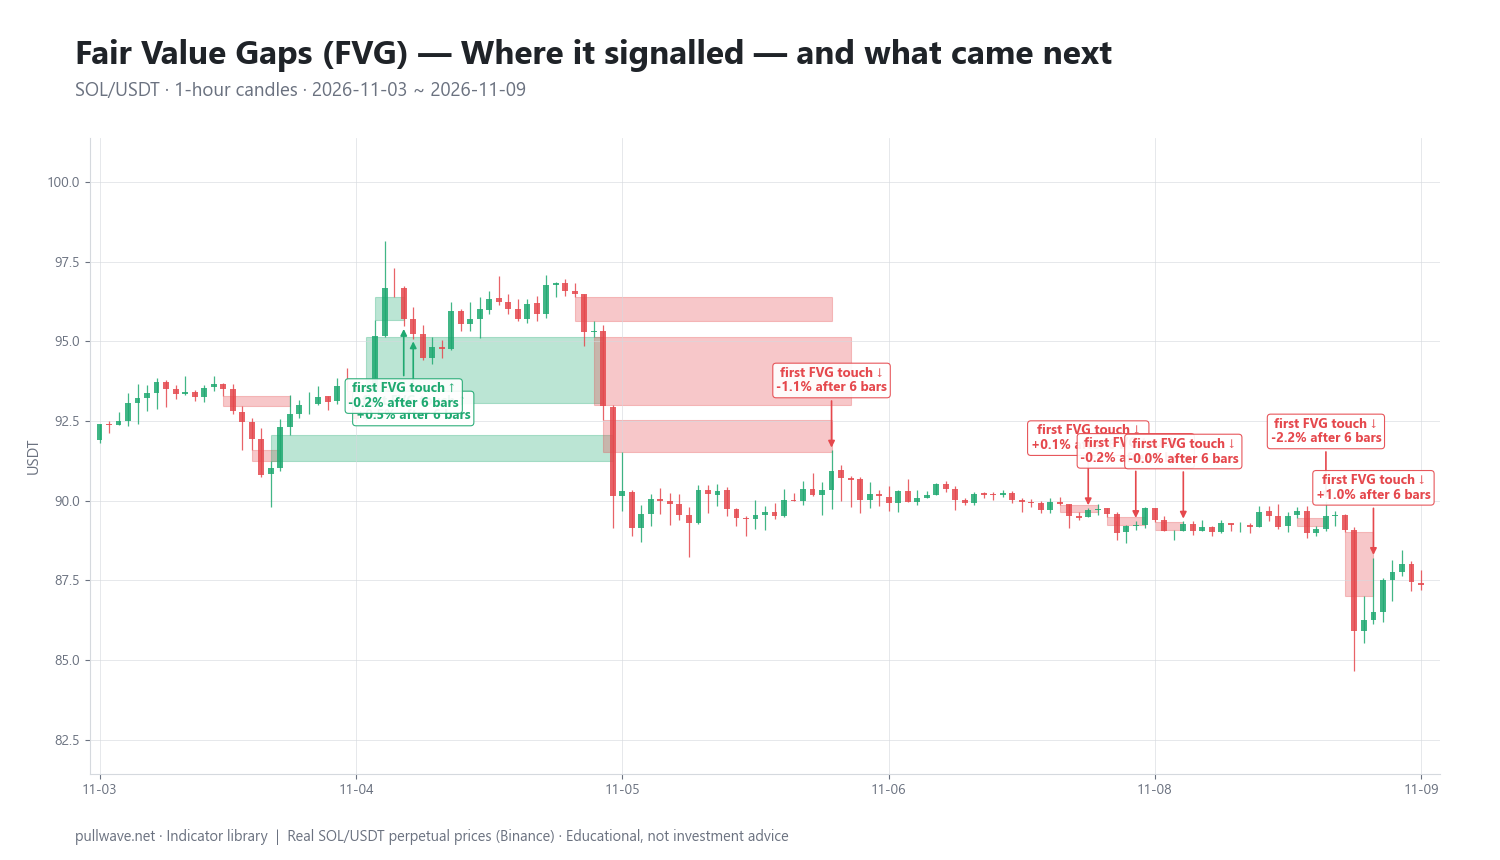
Figure 2 shows the same chart with the first touch of each gap marked and the percentage move six bars later. Over the six days the rules found 14 gaps: 3 bullish and 11 bearish - the lopsided count simply reflects a market that fell from the mid-90s toward 87. Twelve of them were old enough to measure. 8 of 12 (66.7%) were touched within 20 bars and 7 of 12 (58.3%) were fully filled within 20 bars.
First touches and what followed (6-bar and 18-bar change from the touch price):
| Date (UTC) | Gap | Touch price | +6 bars | +18 bars |
|---|---|---|---|---|
| 2026-11-04 14:00 | bearish | 95.18 | -0.37% | +1.68% |
| 2026-11-04 17:00 | bullish | 95.70 | -0.16% | +0.82% |
| 2026-11-04 18:00 | bullish | 95.22 | +0.50% | +0.08% |
| 2026-11-05 15:00 | bullish | 90.16 | -0.28% | -0.17% |
| 2026-11-06 14:00 | bearish | 90.94 | -1.12% | -0.76% |
| 2026-11-07 17:00 | bearish | 89.70 | +0.08% | -0.04% |
| 2026-11-07 22:00 | bearish | 89.23 | -0.19% | -0.26% |
| 2026-11-08 03:00 | bearish | 89.28 | -0.03% | -3.77% |
| 2026-11-08 18:00 | bearish | 89.52 | -2.23% | -2.41% |
| 2026-11-08 23:00 | bearish | 86.50 | +0.99% | +0.99% |
Across all twelve events, 6 of 12 moved in the gap's direction six bars after the touch - a coin flip. The results were genuinely mixed. The three bullish touches on 4-5 November produced moves of -0.16%, +0.50% and -0.28% at six bars, i.e. nothing. The bearish touch at 89.28 on 8 November looked flat after six bars (-0.03%) but had fallen 3.77% by bar 18, while the bearish touch at 95.18 on 4 November went the other way (+1.68% by bar 18) and the last touch at 86.50 bounced +0.99%.
Two honest conclusions. First, in a market trending down, bearish gaps dominate the count by construction, so a tally of "gaps that worked" partly measures the trend, not the pattern. Second, 66.7% touched and 58.3% filled sounds high until you remember that this market moved several percent a day in this window - price from around 95.2 on 4 November to 86.5 on 8 November - so hourly candles sweep back and forth across most nearby price ranges anyway. This is one instrument, one timeframe, six days, and one set of mechanical rules; another trader drawing by hand would mark different boxes. It illustrates the mechanics; it proves nothing.
Common mistakes
- Hindsight drawing. On a finished chart it is trivial to find the gap that "held." Mark gaps as they form, in real time, or your review is fiction.
- Marking every gap. Without a size filter, a 1-minute chart produces dozens per hour. Most are noise created by a single thin print.
- Treating a touch as a signal. The gap tells you where, never when or whether. Without a trigger and an invalidation level, it is just a shaded box.
- Timeframe shopping. If a 15-minute gap fails, dropping to 5 minutes to find another one is a way of never being wrong and never being accountable.
- Placing stops exactly at the far edge. That edge is visible to everyone running the same rule. In leveraged crypto, the overshoot is the norm.
- Ignoring news and thin liquidity. Macro releases, exchange outages and weekend books produce gaps that reflect a liquidity accident rather than any kind of intent.
Combining it with other tools
FVGs are a location tool, so pair them with things that answer different questions. Market structure (higher highs and lows, breaks of structure - essentially Dow-theory swing analysis with newer labels) tells you which direction's gaps are worth watching. Volume profile is the natural cross-check: a gap that sits on a low-volume node is the same observation from two angles, and a gap inside a high-volume node is probably meaningless.
ATR does double duty - as the size filter above and as the basis for stop distance and position size, so your risk reflects current volatility rather than the gap's arbitrary height. Fibonacci retracements frequently overlap the 50-61.8% zone with the gap left by the same impulse; when they coincide you have one area supported by two independent constructions. Momentum tools such as RSI divergence or a simple moving-average slope can act as the timing trigger that the gap itself does not provide.
And always check the higher timeframe. A 5-minute gap inside a 4-hour downtrend is a detail; a 4-hour gap that aligns with a daily level is a level worth planning around.
Frequently asked questions
Q. What is a fair value gap in trading?
A fair value gap is a three-candle pattern in which the first candle's high is below the third candle's low (bullish) or the first candle's low is above the third candle's high (bearish). The range in between was crossed by a single fast candle without two-sided trading. Traders mark it as a box and watch whether price returns to it later.
Q. Do fair value gaps always get filled?
No. Many are revisited, especially small ones on low timeframes in ranging markets, but strong trends regularly leave gaps unfilled for a long time or permanently. In the SOL 1-hour window above, 58.3% of eligible gaps were filled within 20 bars - a single-window illustration, not a general fill rate.
Q. What timeframe is best for FVGs in crypto?
There is no best timeframe, but 1-hour to 4-hour charts are a reasonable compromise for most retail traders: enough gaps to study, few enough that they are not noise. Below 15 minutes the pattern fires constantly and needs a volatility filter such as 0.3 x ATR(14). Always read the lower timeframe in the context of the daily trend.
Q. What is the difference between a fair value gap and an order block?
A fair value gap is defined purely by geometry - three candles with non-overlapping wicks - so two traders following the same rule will mark the same box. An order block is usually the last opposing candle before an impulsive move, which involves more judgment about which candle qualifies. They often sit next to each other, and some traders only act where the two overlap.
Q. What is an inverse fair value gap?
An inverse FVG is a gap that price traded straight through instead of reacting to, after which traders watch it from the opposite side - a broken bullish gap treated as potential resistance. It is the classic support-turned-resistance idea applied to a gap box. Like any flipped level, it fails often in strong trends.
Q. Is FVG trading backed by evidence?
There is no peer-reviewed or independent research showing that fair value gaps produce a trading edge, and the "smart money rebalances inefficiencies" explanation is the framework's hypothesis about order flow rather than an established fact. The underlying observation - that thin, one-sided price ranges are often revisited - is older and better documented through classical gap analysis and Market Profile single prints. Treat FVGs as a way to organize a chart, and test any rule yourself before risking money.
Key takeaways
- A fair value gap is an exactly defined three-candle pattern: candle 1's high below candle 3's low (bullish), or candle 1's low above candle 3's high (bearish).
- In 24/7 crypto there are no session gaps, so an FVG marks an intrabar imbalance, conceptually close to a Market Profile single print or a volume-profile low-volume node.
- A size filter such as 0.3 x ATR(14) is what separates meaningful gaps from the constant noise on low timeframes.
- Gaps mark where, not when: they work best as pullback areas or targets inside a clear trend, and they fail in ranges, news spikes and strong one-way moves that never retrace.
- The SOL/USDT example (14 gaps, 66.7% touched, 58.3% filled within 20 bars, 6 of 12 touches moving in the gap's direction after six bars) is one illustration on one market and window - mixed results, and no evidence of an edge.
Educational material. Charts use real SOL/USDT perpetual prices; past behaviour does not predict future results. Not investment advice.