Indicator & technique library · Smart money concepts (SMC/ICT)
Order Blocks Explained: Definition, Rules and Retests
At a glance
- An order block is usually defined as the last opposite-colour candle before an impulsive move that breaks market structure.
- Definitions vary between teachers: whole candle high–low, body only, the 50% mean threshold, or the first of a cluster of candles.
- The claim that unfilled institutional orders rest inside the zone is the framework's hypothesis about order flow, not something a public chart can verify.
- In one mechanical test on SOL/USDT 4h (6 Oct – 9 Nov 2026), 10 of 14 blocks were retested and 3 of those 10 retests moved in the expected direction six bars later.
An order block is a single candle — or a small cluster of candles — that traders mark as a zone on the chart because price moved away from it sharply and broke the previous swing structure. In the vocabulary of "smart money concepts" (SMC), it is the last opposite-colour candle before the impulse: the last down-close candle before a rally that breaks a swing high, or the last up-close candle before a sell-off that breaks a swing low.
Traders care about order blocks because they turn a vague area of "support" into a precise, rule-bound box with an obvious invalidation point. That precision is the real practical benefit. The story attached to it — that large unfilled institutional orders are still resting inside the zone — is a hypothesis about order flow that you cannot confirm or refute from a public price chart, and you should treat it as such.
What is an order block?
An order block is a rectangle drawn around the candle that marks the origin of an impulsive, structure-breaking move. Two types are usually distinguished:
- Bullish order block: the last bearish (down-close) candle before an up-move that closes above the most recent swing high. The zone is drawn from that candle's low to its high and is watched as potential support if price returns.
- Bearish order block: the last bullish (up-close) candle before a down-move that closes below the most recent swing low. The zone is watched as potential resistance.
Two conditions do the work: there must be an impulse (a fast, one-sided move, often with a gap-like displacement between candle bodies) and there must be a break of structure (the move takes out a prior swing point on a closing basis). Without the break of structure you are simply drawing a box around a random candle.
When price later trades back into the zone, SMC traders call it a retest or mitigation. When price instead closes decisively through the far side of the block without reacting, the block is considered invalidated or "consumed".
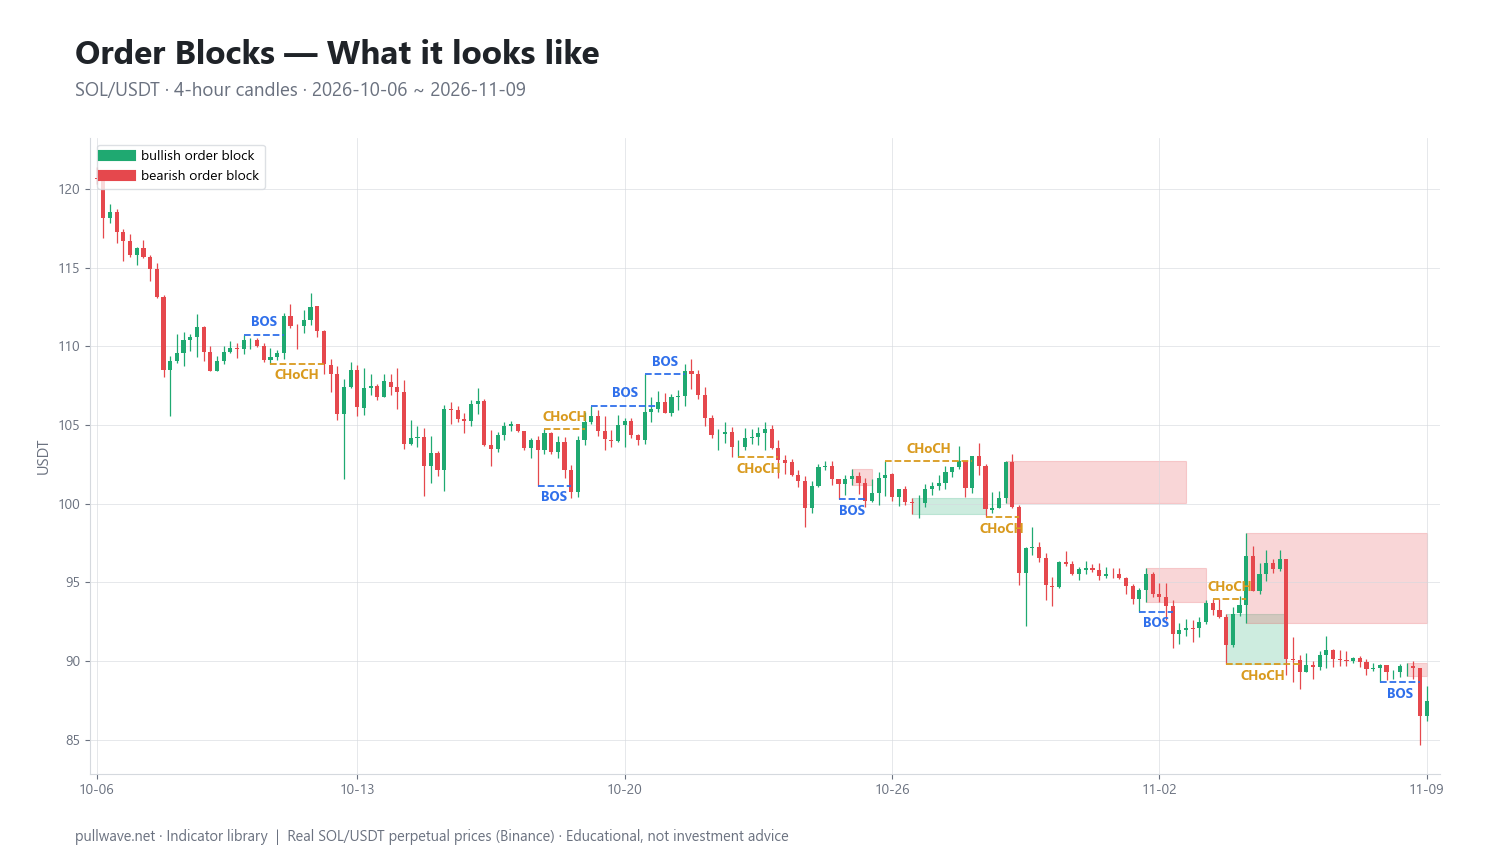
Figure 1 shows SOL/USDT 4h candles with bullish and bearish order-block zones drawn as shaded boxes, each running from the block candle forward until its first retest, together with the structure breaks that created them. Notice that every box is anchored to a break: the box exists because of what happened after the candle, not because of the candle itself.
The idea behind it (theory and history)
Order blocks come from the body of discretionary chart-reading material popularised online by Michael J. Huddleston, who teaches under the name "Inner Circle Trader" (ICT), and from the wider community framework that grew around it — commonly called smart money concepts — mostly through videos and forums from roughly the mid-2010s onward. There is no single canonical text, and definitions differ noticeably between teachers. Vocabulary has also drifted over time: "market structure shift" and "change of character" are used by different people for overlapping ideas.
The reasoning proponents give runs like this: a large participant cannot fill a big position at one price without moving the market, so some of the intended size remains unfilled when price runs away. When price returns to the area where that activity started, the remaining interest is executed and the move continues. Hence "mitigation" — the block is said to have been mitigated once price has traded back into it.
That narrative is not established fact. No public chart shows who traded, in what size, or whether any order is still resting at a level, and there is no peer-reviewed or independent evidence that order blocks confer a trading edge. It is more honest to say that the zone marks where an imbalance between buyers and sellers became visible, which is a statement you can verify, rather than who created it, which you cannot.
The mechanics are also not new. The idea that price returns to the origin of a sharp move overlaps heavily with older, better-documented concepts: classical support and resistance, the last base before a breakout in Wyckoff-style analysis, springs and upthrusts, price gaps and their tendency to be revisited, and Fibonacci retracement zones. Dow-theory swing structure — higher highs and higher lows versus lower highs and lower lows — is exactly what "break of structure" restates in modern wording. Order blocks package these ideas into a stricter drawing rule; that is their contribution.
How it is calculated
Order blocks are drawn discretionarily by most traders, but they can be specified mechanically. Here is the step-by-step procedure used for the example later on this page.
- Find swing points. A candle is a swing high if its high is above the highs of the
kcandles on each side; a swing low is the mirror image. A common setting isk = 3on intraday charts. - Detect a break of structure. Mark a bullish break when a candle closes above the most recent confirmed swing high, and a bearish break when a candle closes below the most recent confirmed swing low. Using closes rather than wicks filters out many single-tick pokes.
- Walk back to the origin of the leg. From the breaking candle, step backwards to the start of the impulsive sequence that produced the break.
- Select the block candle. For a bullish break, it is the last down-close candle before that sequence; for a bearish break, the last up-close candle.
- Draw the zone. The default is the block candle's full range: low to high. Extend it forward in time.
- Define the retest. The first later bar whose wick touches the zone is the retest.
- Define invalidation. If a candle closes beyond the far side of the zone (below a bullish block's low, above a bearish block's high) before any retest, the block is treated as dead.
``` k = 3 swing high(i): high[i] > max(high[i-k..i-1], high[i+1..i+k]) swing low(i) : low[i] < min(low[i-k..i-1], low[i+1..i+k])
BOS up = close > last confirmed swing high BOS down = close < last confirmed swing low
bullish OB = last down-close candle at the start of the leg causing BOS up bearish OB = last up-close candle at the start of the leg causing BOS down
zone = [OB.low, OB.high] # variant: [min(open,close), max(open,close)] mean thresh = (OB.high + OB.low) / 2
retest (bull) = first later bar with low <= OB.high retest (bear) = first later bar with high >= OB.low invalid (bull) = close < OB.low before any retest invalid (bear) = close > OB.high before any retest ```
Note what the formula does not contain: volume, open interest, or any order-flow data. The block is derived entirely from price geometry.
Default settings and variations
There is no official default, which is precisely why two traders can mark the same chart differently. The main choices:
| Choice | Common options | Effect |
|---|---|---|
| Zone boundaries | Full high–low; body only (open to close) | Body-only gives a tighter zone and more misses; high–low catches more retests but allows deeper drawdown |
| Entry reference | Zone edge (proximal line); 50% "mean threshold"; far edge (distal line) | Deeper references improve price but are reached less often |
| Candle selection | Last opposite-colour candle; first candle of a multi-candle base; the whole consolidation | A wider base behaves like a classical support zone |
| Structure break | Close-based; wick-based | Close-based produces fewer, cleaner blocks |
Swing lookback k |
2–5 bars intraday, larger on higher timeframes | Larger k means fewer, more significant structure breaks |
| Validity | Until first retest; until one close through; unlimited | Determines how many blocks stay on your chart |
A frequent refinement is to require displacement: the impulse must include at least one candle whose range leaves an unfilled imbalance between the wicks of the surrounding candles (often called a fair value gap). Blocks without displacement are discarded. Another is to require that the block candle takes out a nearby minor swing first — a liquidity sweep — which is essentially a Wyckoff spring described in different words.
Breaker blocks deserve one paragraph. When a bullish order block fails and price closes below it, and price then reverses and breaks structure to the downside, the same zone is often re-labelled a bearish breaker and watched as resistance from above. The logic is ordinary polarity: a failed support level becomes a resistance level once it is reclaimed from the other side. Breakers are not a separate mechanism; they are the classical support-becomes-resistance idea applied to the block's boundaries.
How to read it
Read an order block as a zone of interest with a built-in invalidation, not as a signal. Three things matter when price returns to one:
- Context. A bullish block being retested while higher highs and higher lows are still forming is a very different proposition from the same block being retested after structure has already broken down. In the second case, the block is standing against the prevailing direction.
- Speed of arrival. A slow, overlapping drift back into a zone shows two-sided trade and more often resolves as a reaction. A fast, one-sided arrival — especially on a news release or a liquidation cascade — frequently slices straight through.
- Freshness. Most interpretations treat the first touch as the only one that counts. After price has traded through a block several times, the zone is simply part of a range.
Also read what the block does not tell you: it says nothing about position size, nothing about time, and nothing about whether anyone is actually waiting there.
How traders use it
1. Retest entry with confirmation. Wait for price to tag the zone, then require a confirmation on a lower timeframe — a small structure break in the expected direction, a rejection wick, or a close back outside the zone. Stop placement is mechanical: beyond the far side of the block. Works best in a clean trend with pullbacks of roughly similar depth. Fails in ranges, where price oscillates through the zone repeatedly, and in violent directional sessions where there is no pullback at all.
2. Limit order at the mean threshold. Place a resting order at the 50% level of the block instead of at its edge, accepting fewer fills in exchange for a tighter stop. Works best when the market has been overshooting pullback areas. Fails when blocks are only grazed — a large share of retests never reach the midpoint.
3. Target and exit mapping. Use opposing order blocks as areas to reduce exposure rather than to enter. This is the least contentious use, because you are only asking "where has price reacted before?" Works in most regimes. Fails when a strong trend ignores every intermediate zone.
4. Higher-timeframe bias, lower-timeframe execution. Mark blocks on the daily or 4h chart, then manage entries on the 15m or 1h. Works best when the higher-timeframe structure is unambiguous. Fails when the two timeframes disagree, which tempts traders into counter-trend positions against a strong daily trend.
In crypto, add these considerations: markets trade 24/7, so there are no session gaps and no reliable "kill zone" windows imported from FX practice; perpetual futures introduce funding costs that make waiting for a deep retest expensive on leverage; and liquidation cascades can push price through several blocks in minutes. On leveraged positions, a stop placed just beyond a thin block can sit inside normal noise — position size should be derived from the distance to invalidation, not the other way around.
Example on a real SOL chart
The window is SOL/USDT perpetual on Binance, 4h candles, 6 October to 9 November 2026, last close 87.44. Blocks were marked with the mechanical rules above: swing lookback k = 3, close-based structure break, zone equals the block candle's high–low, retest equals the first later wick into the zone, invalidation equals a close beyond the far side before any retest.
In this window the rules produced 14 order blocks. 10 were retested (71.4%), and none were invalidated before their first retest. The retest count is the headline number most people want; the behaviour after the retest is the number that matters.
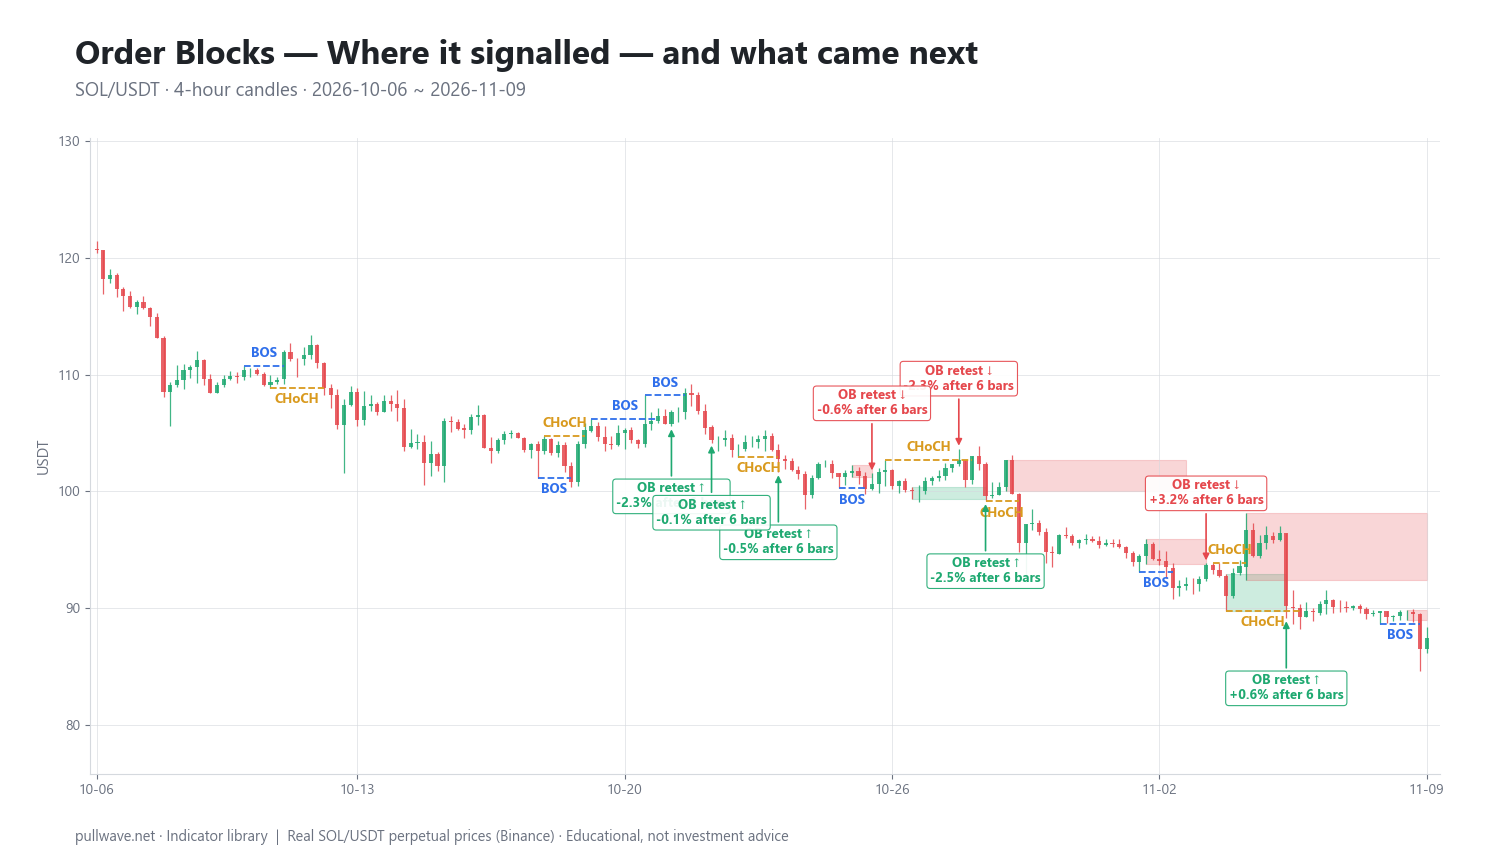
Figure 2 marks each first retest and the percentage move six bars (one day) later.
| Date (UTC) | Type | Price | +6 bars | +18 bars |
|---|---|---|---|---|
| 2026-10-11 20:00 | retest ↑ | 111.30 | −5.03% | −6.33% |
| 2026-10-18 20:00 | retest ↓ | 104.07 | +0.92% | +2.72% |
| 2026-10-21 04:00 | retest ↑ | 106.80 | −2.27% | −4.63% |
| 2026-10-22 04:00 | retest ↑ | 104.38 | −0.12% | −2.67% |
| 2026-10-23 20:00 | retest ↑ | 102.79 | −0.45% | −1.83% |
| 2026-10-26 04:00 | retest ↓ | 100.68 | −0.63% | −0.96% |
| 2026-10-28 08:00 | retest ↓ | 102.71 | −2.31% | −6.70% |
| 2026-10-29 00:00 | retest ↑ | 99.64 | −2.46% | −4.09% |
| 2026-11-03 12:00 | retest ↓ | 93.72 | +3.17% | −3.22% |
| 2026-11-05 12:00 | retest ↑ | 90.16 | +0.60% | −0.52% |
Six bars after the retest, 3 of the 10 events had moved in the direction the block implied. Eighteen bars later the count was again three out of ten, though not the same three: the bearish retests on 26 October, 28 October and 3 November were lower after 18 bars, while the 5 November bullish retest that was marginally positive at six bars had turned slightly negative.
The distribution of outcomes is worth more than the score. SOL fell from the 111 area to a close of 87.44 across this window, so all six bullish retests were positioned against that drift. Five of the six were lower six bars later — the weakest being 11 October at 111.30, down 5.03% — and the sixth, 5 November at 90.16, was only marginally positive at +0.60%. The four bearish retests pointed with the prevailing direction, but at six bars only two of them (26 and 28 October) had actually moved lower; 18 October was +0.92% and 3 November was +3.17%. The bearish group looks better only at the longer horizon, where three of the four were lower after 18 bars, while none of the six bullish retests were higher. The tentative regime lesson is the familiar one: a zone pointing against the dominant direction was the weaker of the two groups here, regardless of how neat the box looked.
Treat this as one illustration on one market over five weeks, with one specific set of drawing rules and a sample of ten events — far too small to generalise from. It is not evidence that order blocks work or do not work. A discretionary trader filtering for displacement, liquidity sweeps or higher-timeframe alignment would have marked a different, smaller set of blocks and produced different numbers — which is itself the point: the result depends heavily on choices the method does not fix for you.
Common mistakes
- Drawing on a finished chart. Order blocks are trivially easy to identify in hindsight, because the definition depends on what happened after the candle. Marking blocks only at the hard right edge, in real time, is a far harder and far more honest exercise.
- Marking every candle. If a chart has thirty boxes on it, price will touch one of them constantly and you will remember only the touches that worked. Require a genuine structure break and a visible impulse.
- Treating the zone as a signal. A retest is an area to start looking, not a reason to act. Without confirmation and a predefined invalidation, "it tapped the block" is not a plan.
- Ignoring the trend. In the SOL window above, nearly every counter-trend retest drifted lower over the following day, while the trend-aligned ones were the only group with any winners at the 18-bar horizon.
- Believing the order-flow story literally. You cannot see resting institutional orders. If your conviction comes from that narrative rather than from the price behaviour in front of you, your stop will feel wrong every time it is hit.
- Oversized leverage on a tight stop. Perpetual futures make it easy to size a position so that normal 4h noise reaches liquidation before the idea has had a chance to be right or wrong.
Combining it with other tools
Order blocks are a location tool. They answer "where?" and leave "when?" and "how much?" to other methods.
- Market structure. Only consider blocks that agree with the higher-timeframe sequence of swing highs and lows. This single filter removes most of the counter-trend entries.
- Fibonacci retracement. Blocks that sit inside the 50–61.8% retracement of the prior leg coincide with where many traders already expect a pullback to end. The overlap is not a coincidence — both measure the same thing from different anchors.
- Volume and open interest. A retest on falling volume suggests the pullback is losing energy; a retest accompanied by a sharp drop in open interest often means positions are being liquidated rather than accumulated.
- Volatility measures. Average True Range tells you whether a stop beyond the block sits outside normal noise. In crypto, a 4h ATR can easily exceed the height of the block itself.
- Momentum oscillators. A divergence forming as price reaches a block adds a second, independent observation, rather than confirming the same geometry twice.
- Funding rates. Strongly positive funding into a bearish block retest indicates crowded long positioning, which is context about who may be forced to exit — observable data, unlike the institutional-order narrative.
Avoid stacking five tools that all restate price geometry. Two or three genuinely different inputs are usually more informative than a chart covered in boxes.
Frequently asked questions
Q. What is an order block in trading?
An order block is the last opposite-colour candle before an impulsive move that breaks market structure — the last down-close candle before a rally that takes out a swing high, or the last up-close candle before a decline that takes out a swing low. Traders draw the candle's range as a zone and watch for a reaction if price returns to it. The term comes from the smart money concepts framework popularised online since about the mid-2010s.
Q. Do order blocks actually work?
There is no peer-reviewed or independent evidence that order blocks provide a trading edge, and results depend heavily on how you define the block, which filters you apply and what the broader trend is doing. In one mechanical test on SOL/USDT 4h between 6 October and 9 November 2026, 10 of 14 blocks were retested but only 3 of those 10 retests moved in the expected direction six bars later; in that falling market the bearish retests held up somewhat better than the bullish ones. That is ten events in one window on one market, not a general conclusion.
Q. What is the difference between an order block and a supply and demand zone?
In practice they are closely related: both mark the origin of a sharp move and are watched for a reaction on return. Order blocks add stricter requirements — a single specified candle and a confirmed break of structure — whereas supply and demand zones are usually drawn around a whole base or consolidation. The underlying market behaviour being observed is the same.
Q. Should I use the candle body or the full high-low for an order block?
Both are in common use and neither is standard. The full high–low creates a wider zone that is touched more often but requires a wider stop; the body-only version is tighter and produces more missed entries. Many traders use the full range for the zone and the 50% midpoint, the "mean threshold", as a reference level inside it.
Q. What timeframe is best for order blocks in crypto?
Higher timeframes — 4h and daily — produce fewer blocks that are anchored to more meaningful structure breaks, which generally makes them easier to work with. Lower timeframes generate many blocks, most of which are noise in a 24/7 market with frequent liquidation spikes. A common approach is to mark zones on the 4h or daily and manage execution on the 15m or 1h.
Q. How do you know when an order block is no longer valid?
The most common rule is a candle close beyond the far side of the zone: below a bullish block's low, or above a bearish block's high. Many traders also treat a block as spent after its first retest, whether or not price reacted. Whichever rule you choose, define it before you take a position so invalidation is not a judgement call made under pressure.
Key takeaways
- An order block is the last opposite-colour candle before an impulsive, structure-breaking move, drawn as a zone and watched for a reaction on the first return.
- The definition is not standardised — high–low versus body, first versus last candle, mean threshold versus edge — so two traders can mark the same chart very differently.
- The claim that unfilled institutional orders rest inside the zone is the framework's hypothesis about order flow, not something a public chart can verify; the mechanics overlap strongly with support/resistance, Wyckoff bases and Fibonacci retracements.
- Order blocks are hindsight-heavy by construction, many are never retested cleanly, and in strong or news-driven moves price frequently cuts straight through them.
- Context mattered more than the pattern in the SOL window shown here: trend-aligned retests were the only group with winners at the 18-bar horizon, and even they were mixed at six bars.
Educational material. Charts use real SOL/USDT perpetual prices; past behaviour does not predict future results. Not investment advice.