Indicator & technique library · Smart money concepts (SMC/ICT)
Market Structure, BOS and CHoCH Explained for Traders
At a glance
- Market structure is the sequence of swing highs and lows that defines trend or range — an idea older than smart money concepts, going back to Dow theory.
- A BOS is a close beyond the last swing in the direction of the trend; a CHoCH is the first close beyond a swing against it.
- Swing points are subjective: fractal width, body-close versus wick, and internal versus swing structure all move the labels.
- In a 4h SOL/USDT window with 12 mechanical breaks, only 4 moved in the signal direction six bars later — one illustration, not evidence of an edge.
Market structure is the record of where price turned. You mark the swing highs and swing lows a market has already printed, read the sequence they form, and label each break of a prior swing level. While breaks keep going the same way, the structure is intact; the first break the other way is when traders start asking whether the trend is over.
The vocabulary — BOS (break of structure) and CHoCH (change of character) — comes from the online "smart money concepts" community, but the underlying idea is far older than the acronyms. Traders care about it because it is defined by price alone, with no lag from a moving average and no parameter to curve-fit beyond the swing definition. It is also easy to fool yourself with, because on a finished chart every break looks obvious.
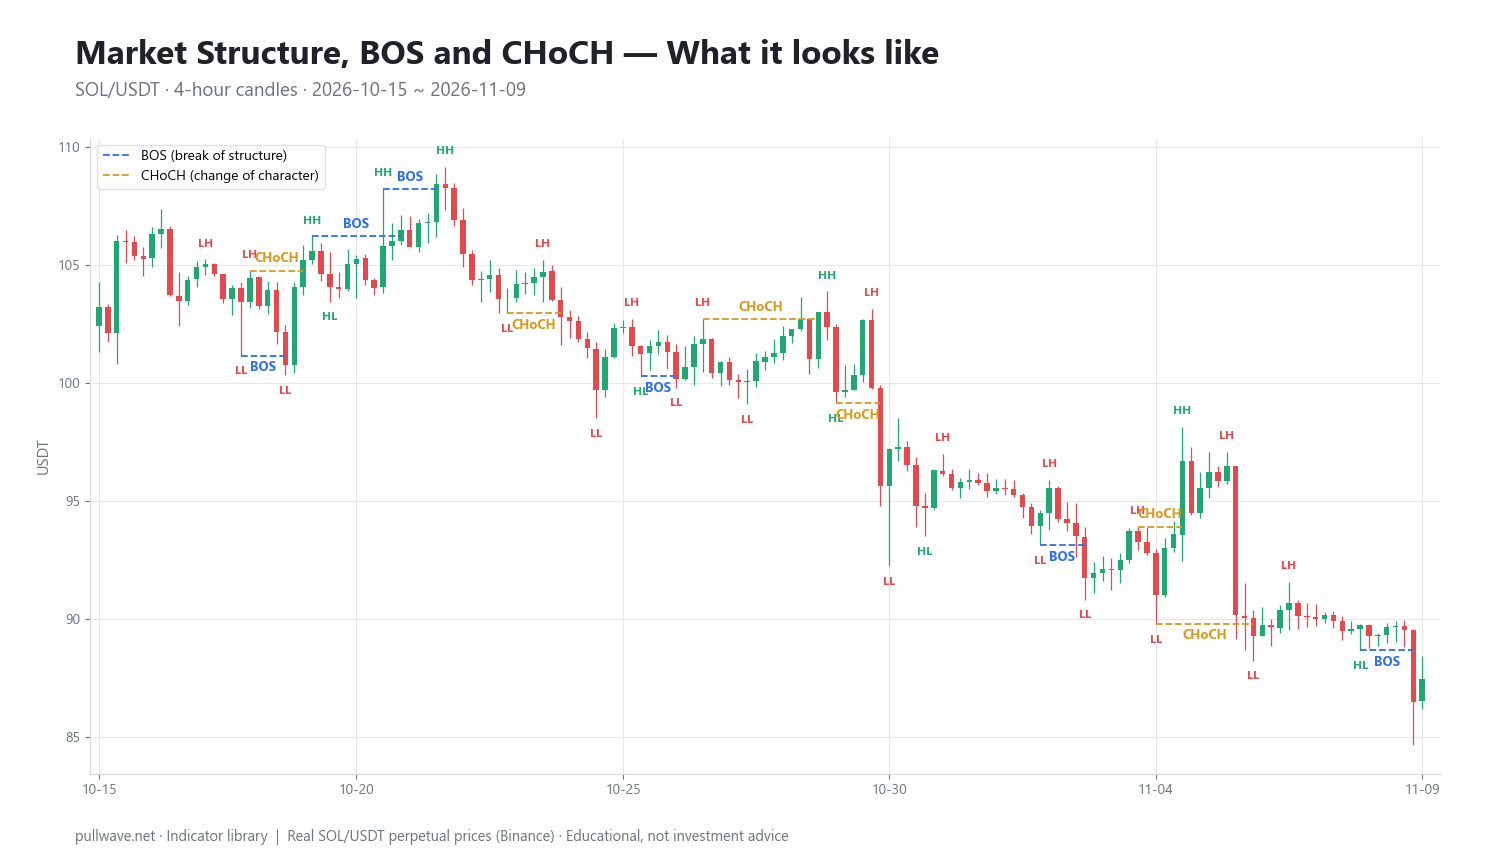
Figure 1 shows real SOL/USDT 4h candles with each confirmed swing labelled HH, HL, LH or LL, and each break drawn as a dashed line at the swing level that was taken out — BOS when the break continued the existing direction, CHoCH when it was the first break against it.
What is Market Structure, BOS and CHoCH?
Market structure is the ordered list of swing highs and lows on a chart plus the labels describing their relationship. An uptrend is a series of higher highs (HH) and higher lows (HL); a downtrend is lower highs (LH) and lower lows (LL). Overlapping, alternating swings inside a band are a range — and most charts spend a lot of time there.
BOS is a break of the most recent swing point in the direction of the current structure: through the last swing high in an uptrend, through the last swing low in a downtrend. It is read as continuation.
CHoCH is the first break against the current structure. Many teachers call the same event a "market structure shift" (MSS), and some reserve MSS for a CHoCH with a strong displacement candle. Usage genuinely varies, so check which definition a chart is using before comparing notes.
| Term | What it is | Usual reading |
|---|---|---|
| HH / HL | Higher high, higher low | Uptrend sequence |
| LH / LL | Lower high, lower low | Downtrend sequence |
| BOS | Break of last swing with the trend | Continuation |
| CHoCH / MSS | First break against the trend | Possible trend change |
| Internal structure | Smaller swings inside the last leg | Entry timing |
| Swing structure | Larger swings framing the leg | Bias |
The idea behind it (theory and history)
The structural definition of a trend is old. Charles Dow's editorials in The Wall Street Journal around 1900–1902, later systematised by William Peter Hamilton and Robert Rhea, described a trend as a succession of higher peaks and troughs, in doubt once that succession broke. Richard Wyckoff's work added the behavioural layer — accumulation and distribution ranges, springs below support, upthrusts above resistance.
The modern BOS/CHoCH vocabulary has a different lineage: the teaching of Michael J. Huddleston, who publishes as "ICT" (Inner Circle Trader), and the broader smart money concepts community that grew around online video since roughly the mid-2010s. These are discretionary methods spread through videos and forums rather than books or journals, which is why definitions drift between teachers.
Proponents argue that structure breaks matter because large participants must fill orders where liquidity sits — above old highs and below old lows, where stops cluster — so a sweep followed by a decisive reversal is read as evidence of that activity. That is the framework's hypothesis about order flow, not an established fact, and there is no peer-reviewed or independent evidence that BOS/CHoCH labelling gives an edge. The narrower claim is safer and still useful: swing levels are where resting orders accumulate, and a market that stops making new extremes has, by definition, stopped trending.
How it is calculated
Structure is usually drawn by hand, but to discuss it precisely you need a mechanical definition. The one used in the example below is a fractal swing with three bars on each side, with breaks requiring a candle close beyond the level.
- Swing high: a bar whose high exceeds the high of each of the three bars before and the three bars after it.
- Swing low: a bar whose low is below the low of the three bars before and after.
- Accept the lag: a swing is only valid once three more bars print — twelve hours later on a 4h chart.
- Label the sequence: compare each new swing high with the previous one (HH or LH) and each new swing low with the previous one (HL or LL).
- Track two live levels: the most recent confirmed swing high and swing low.
- Classify breaks: a close above the active swing high is a BOS if structure was already up, a CHoCH if it was down; a close below the active swing low is a BOS if structure was down, a CHoCH if it was up.
- Flip the state: after a CHoCH the assumed direction flips, so the next break that way is a BOS.
``` swing_high(i) = high[i] > max(high[i-3..i-1]) and high[i] > max(high[i+1..i+3]) swing_low(i) = low[i] < min(low[i-3..i-1]) and low[i] < min(low[i+1..i+3])
trend = up if last swings form HH + HL trend = down if last swings form LH + LL
close > last_swing_high and trend = up -> BOS up close < last_swing_low and trend = down -> BOS down close > last_swing_high and trend = down -> CHoCH up (trend = up) close < last_swing_low and trend = up -> CHoCH down (trend = down) ```
Default settings and variations
There is no official setting — that is the honest starting point. The choices that change your chart most:
- Fractal width. Three bars each side is a common middle ground: wide enough to ignore single-candle noise, narrow enough to register turns quickly. Two bars each side (as in the Bill Williams fractal) gives many more swings and many more CHoCH labels; five bars gives fewer, larger swings and a slower picture.
- Close versus wick. A body close filters out liquidity sweeps — the wick that pokes through an old high and comes straight back. Wick-only breaks register earlier and fail more often; many traders label them separately as sweeps.
- Internal versus swing structure. Swing structure frames a whole leg; internal structure is the smaller swings inside it. A common workflow is bias from swing structure, timing from internal. When the two disagree, that is information, not an error.
- Timeframe. Higher timeframes give fewer, slower, more widely watched breaks. In crypto, 4h and daily are popular for bias; 5m–15m structure exists but is dominated by noise and funding-driven flushes.
- Displacement filters. Some traders only count a CHoCH if the breaking candle is unusually large or leaves a fair value gap. That is a discretionary filter, not part of the base definition.
How to read it
Read in three passes. Mark the swings and write the labels without thinking about trades. State the sequence plainly: "higher highs and higher lows since the low on the 16th." Then locate the two live levels — the last swing high and last swing low — because those are the only prices at which the reading can change.
A BOS says the market extended its range in the direction it was already going. A CHoCH says that for the first time it has not. Neither is a forecast. A CHoCH inside a choppy range is usually just oscillation; the same pattern after an extended trend into a higher-timeframe level carries very different context.
The habit that matters most is remembering the lag. The level you break today was confirmed three bars after it printed, and the break exists only once the candle closes. Structure describes the past tightening around the present.
How traders use it
Higher-timeframe bias. Mark daily or 4h structure and work only in the direction of the last BOS. This helps in sustained trends and keeps traders out of counter-trend fades. It fails in wide ranges, where the "last BOS" alternates every few days and you end up chasing every range extreme.
CHoCH as warning, BOS as confirmation. Treat the first counter-trend break as a reason to reduce exposure or tighten risk, and wait for a following BOS in the new direction before calling the trend changed. The cost is lateness: by then much of a fast crypto move is gone.
Entry timing with internal structure. Hold a 4h bias, then look for a CHoCH on the 15m or 1h inside a zone already being watched. In trends this gives a tight, logical invalidation point. In ranges, low-timeframe CHoCH signals appear constantly and most lead nowhere.
Defining invalidation. Many traders find structure most useful for stops: if the thesis is that structure is up, a close below the last higher low is where that thesis is wrong. This use needs no claim about who is behind the order flow.
Example on a real SOL chart
The window is SOL/USDT perpetual on Binance, 4h candles, 15 October to 9 November 2026, using the mechanical rules above: three-bar fractal swings, breaks requiring a close beyond the latest swing level. The script found 34 swing points and 12 breaks, split evenly into 6 BOS and 6 CHoCH. The last close in the window was 87.44.
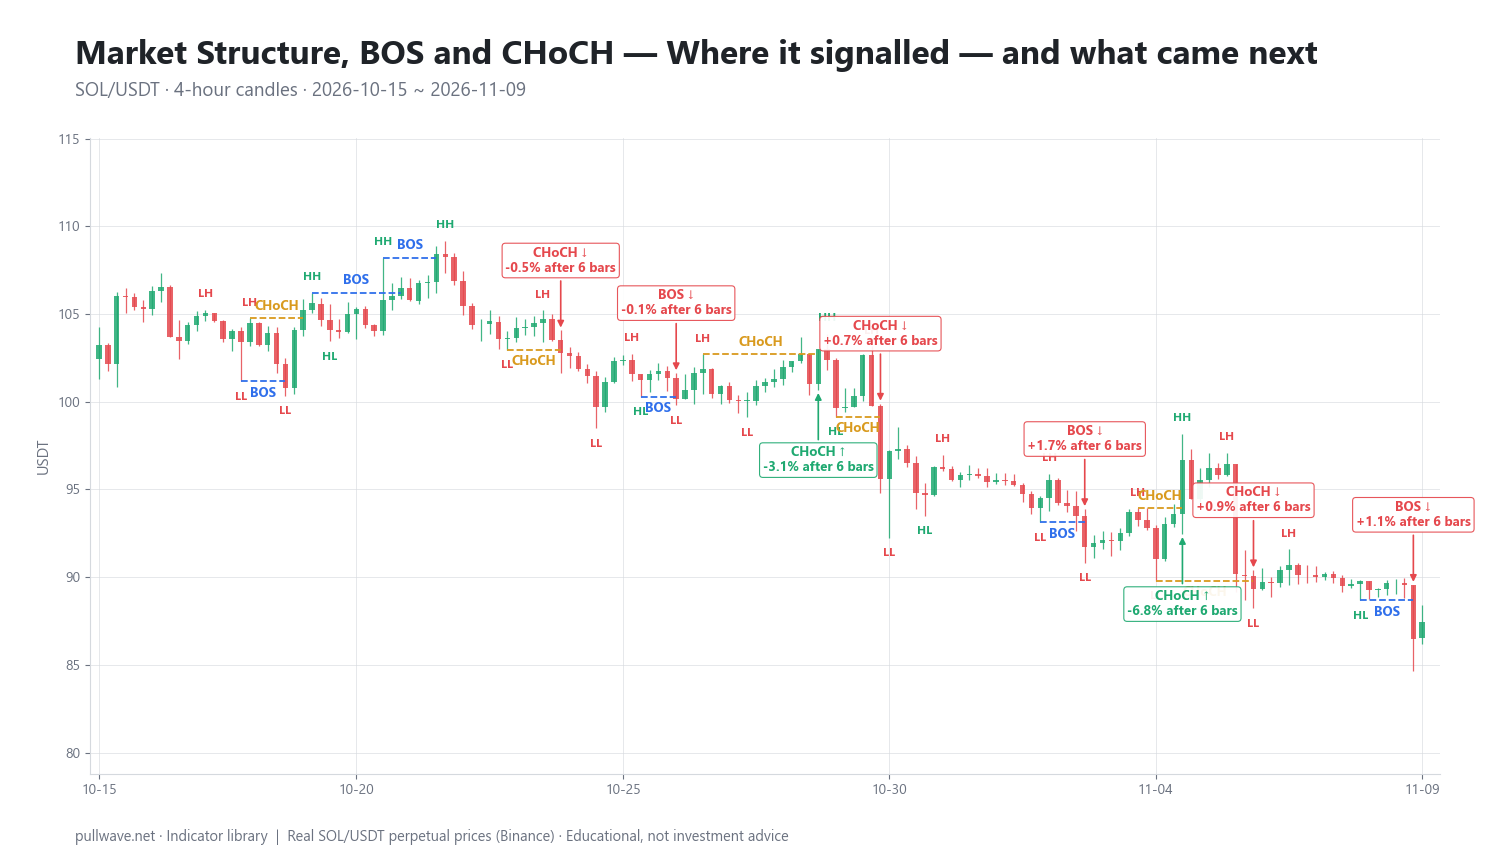
Figure 2 shows the same candles with the breaks marked and the percentage move six bars (one day) after each. Ten of the twelve are listed here, with the 18-bar outcome for context.
| Date (UTC) | Label | Price | +6 bars | +18 bars |
|---|---|---|---|---|
| 2026-10-20 20:00 | BOS ↑ | 106.47 | +0.40% | −3.46% |
| 2026-10-21 12:00 | BOS ↑ | 108.44 | −3.56% | −8.04% |
| 2026-10-23 20:00 | CHoCH ↓ | 102.79 | −0.45% | −1.83% |
| 2026-10-26 00:00 | BOS ↓ | 100.18 | −0.05% | −0.54% |
| 2026-10-28 16:00 | CHoCH ↑ | 103.02 | −3.15% | −7.03% |
| 2026-10-29 20:00 | CHoCH ↓ | 95.62 | +0.71% | −1.16% |
| 2026-11-02 16:00 | BOS ↓ | 91.74 | +1.66% | −1.84% |
| 2026-11-04 12:00 | CHoCH ↑ | 96.69 | −6.75% | −7.43% |
| 2026-11-05 20:00 | CHoCH ↓ | 89.30 | +0.90% | −3.14% |
| 2026-11-08 20:00 | BOS ↓ | 86.50 | +1.09% | +1.09% |
Counting all twelve events, only 4 of 12 had moved in the direction of the break six bars later. Among the ten listed, the moves that did follow through were small: +0.40% after the 20 October BOS ↑ at 106.47, −0.45% after the 23 October CHoCH ↓ at 102.79, and −0.05% after the 26 October BOS ↓ at 100.18 — all well inside what a single 4h candle can cover here.
The largest adverse outcome came from a continuation signal, not a reversal one: the 21 October BOS ↑ at 108.44 was followed by −3.56% after six bars and −8.04% after eighteen, printed at what turned out to be the high of the window. Both bullish CHoCH fared badly too — 103.02 on 28 October gave −3.15% and −7.03%, and 96.69 on 4 November gave −6.75% and −7.43%, both counter-trend breaks inside a persistent decline toward the high 80s.
The bearish side was not clean either. The 2 November BOS ↓ at 91.74 bounced +1.66% before resuming lower, the 29 October and 5 November bearish CHoCH both bounced modestly first, and the final BOS ↓ at 86.50 was followed by +1.09% at both horizons.
Two honest conclusions. In this window the labels described the move far better after the fact than they anticipated it: the chart did trend down, but acting at each break would have been repeatedly whipsawed. And these are mechanical labels — a trader using a different fractal width, wick breaks or a displacement filter would mark different points and get different numbers. One market, one timeframe, one 25-day window illustrates behaviour; it proves nothing either way.
Common mistakes
- Drawing structure on a finished chart. Hindsight bias is the biggest problem here. On a completed chart you unconsciously pick the swings that make the story coherent. Mark structure bar by bar or replay the chart before deciding the method is obvious.
- Treating every CHoCH as a trend change. In a range, CHoCH prints at both edges — six of them in 25 days in the window above.
- Ignoring the confirmation lag. Any backtest that uses swings without the three-bar delay is looking into the future.
- Mixing definitions. Wick breaks on one chart and body closes on another turns a rule into a rationalisation. Pick one and write it down.
- Stating the order-flow story as fact. "Institutions hunted stops at that high" is an interpretation you cannot verify from candles; what you can verify is that price traded through a prior high and returned.
- Forgetting the crypto context. Perpetuals trade 24/7 with no session gaps, funding every few hours, and leveraged positions that liquidate in cascades. A swing low taken out in a thin weekend hour is not the same event as one taken out on heavy spot volume.
Combining it with other tools
Structure gives geometry; it says nothing about participation, volatility or value. Pair it with tools answering a different question.
- Volume and open interest. A BOS on rising spot volume reads differently from one on falling volume with open interest spiking, which often indicates a leveraged push. Checking whether a break coincided with a funding spike is a cheap sanity check on perpetuals.
- Volatility context. ATR or Bollinger Band width shows whether clearing a level by a few tenths of a percent is meaningful or ordinary noise.
- Higher-timeframe levels. A CHoCH at a weekly support or a prior range boundary has context the same pattern lacks mid-range. Fibonacci retracement zones serve a similar framing role.
- Older structural ideas. Wyckoff's spring and upthrust describe almost exactly the wick-sweep-and-reverse that SMC traders call a liquidity grab, and Dow theory's trend definition is the parent of HH/HL labelling.
- A momentum oscillator. Price making a new LL while RSI does not is a classic companion to a potential CHoCH — not a signal, but a reason to demand more confirmation.
Frequently asked questions
Q. What is the difference between BOS and CHoCH?
A BOS (break of structure) is a break of the most recent swing point in the same direction as the trend — a higher high in an uptrend, a lower low in a downtrend — read as continuation. A CHoCH (change of character) is the first break of a swing against the trend, read as a warning that the sequence has ended. After a CHoCH the assumed direction flips, so the next break the same way is labelled BOS.
Q. Is CHoCH the same as a market structure shift (MSS)?
Usually yes: both describe the first break against the prevailing structure and many traders use them interchangeably. Some teachers reserve MSS for a break accompanied by a strong displacement candle or a fair value gap, using CHoCH for any counter-trend break. Because definitions vary by source, check which version a chart or write-up uses.
Q. Should a break of structure be a candle close or is a wick enough?
A body close beyond the swing level is the stricter and more common rule, because it filters wicks that poke through a level and immediately reverse. Wick-only breaks register earlier but fail far more often, and many traders label them separately as liquidity sweeps. Whichever you choose, apply it consistently — switching after the fact is how charts get rationalised.
Q. How many bars should I use to define a swing high or low?
There is no correct number. Three bars each side — the setting used in the SOL example here — is a common compromise; two bars produces many more swings and more false CHoCH labels, while five gives fewer, larger structural points and slower confirmation. With a three-bar fractal, remember a swing is confirmed only three bars after it printed.
Q. What timeframe is best for market structure in crypto?
Most traders take bias from the 4h or daily chart, where breaks are fewer and the levels are watched by more participants, then use 1h or 15m internal structure for timing. Crypto trades 24/7 with no session gaps, so there is no natural daily reset, and very low timeframes are heavily affected by funding resets and thin overnight liquidity. Lower timeframes generate more signals, not better ones.
Q. Does BOS/CHoCH trading actually work?
There is no peer-reviewed or independent evidence that labelling breaks of structure produces an edge on its own, and the "smart money" explanation behind it is a hypothesis about order flow rather than a documented fact. What the labels do provide is a consistent, price-only way to describe trend and define where an idea is invalidated. In the 4h SOL window examined here, only 4 of 12 mechanical breaks moved in the signal direction six bars later.
Key takeaways
- Market structure is the sequence of swing highs and lows: HH+HL is an uptrend, LH+LL a downtrend, and everything else is a range, where the tool performs worst.
- BOS is a with-trend break of the last swing; CHoCH (or MSS) is the first break against it — definitions vary by source, so state the one you use.
- Every parameter is a choice: fractal width, close versus wick, internal versus swing structure. Fix them in advance or hindsight will choose them for you.
- Swings are confirmed only after later bars print, so structure always describes the past; it suits bias and invalidation better than prediction.
- The SOL example — 34 swings, 6 BOS, 6 CHoCH, 4 of 12 breaks continuing after six bars — is one window on one market, an illustration and not proof of an edge.
Educational material. Charts use real SOL/USDT perpetual prices; past behaviour does not predict future results. Not investment advice.