Indicator & technique library · Smart money concepts (SMC/ICT)
Smart Money Concepts and ICT Explained: A Clear Guide
At a glance
- Smart money concepts (SMC) and ICT are discretionary chart-reading frameworks popularised online since roughly the mid-2010s, built around market structure, liquidity, order blocks, fair value gaps and Fibonacci-based premium/discount zones.
- The underlying story — that large institutions deliberately sweep retail stops before moving price — is the framework's hypothesis about order flow, not an independently established fact.
- Most of the components overlap with older, better-documented ideas: Dow-theory swing structure, support and resistance, Wyckoff springs and upthrusts, price gaps and Fibonacci retracements.
- In one mechanical 4h SOL/USDT window (18 Oct – 9 Nov 2026) the rules produced 5 BOS, 5 CHoCH, 10 order blocks, 8 fair value gaps and 4 sweeps, and only 1 of 5 CHoCH events moved in the signalled direction after six bars.
Smart money concepts (SMC) and ICT are not indicators. There is no line to add to a chart, no default period, no value that prints in a sub-window. They are a vocabulary and a discretionary workflow for reading raw price action: where the market structure turned, where clusters of stop orders probably sit, which candle ranges were left behind unfilled, and whether price is currently expensive or cheap relative to a recent range.
Traders care because the framework gives structure to something that otherwise feels arbitrary — it tells you what to look at first, what to mark, and in which order. That same flexibility is its main weakness: two competent traders can mark the same chart differently, the definitions vary between teachers, and nothing here has been independently validated as an edge. This page is the overview and glossary; it explains where the ideas come from, what each term usually means, how to draw them with reproducible rules, and where the whole approach tends to break down.
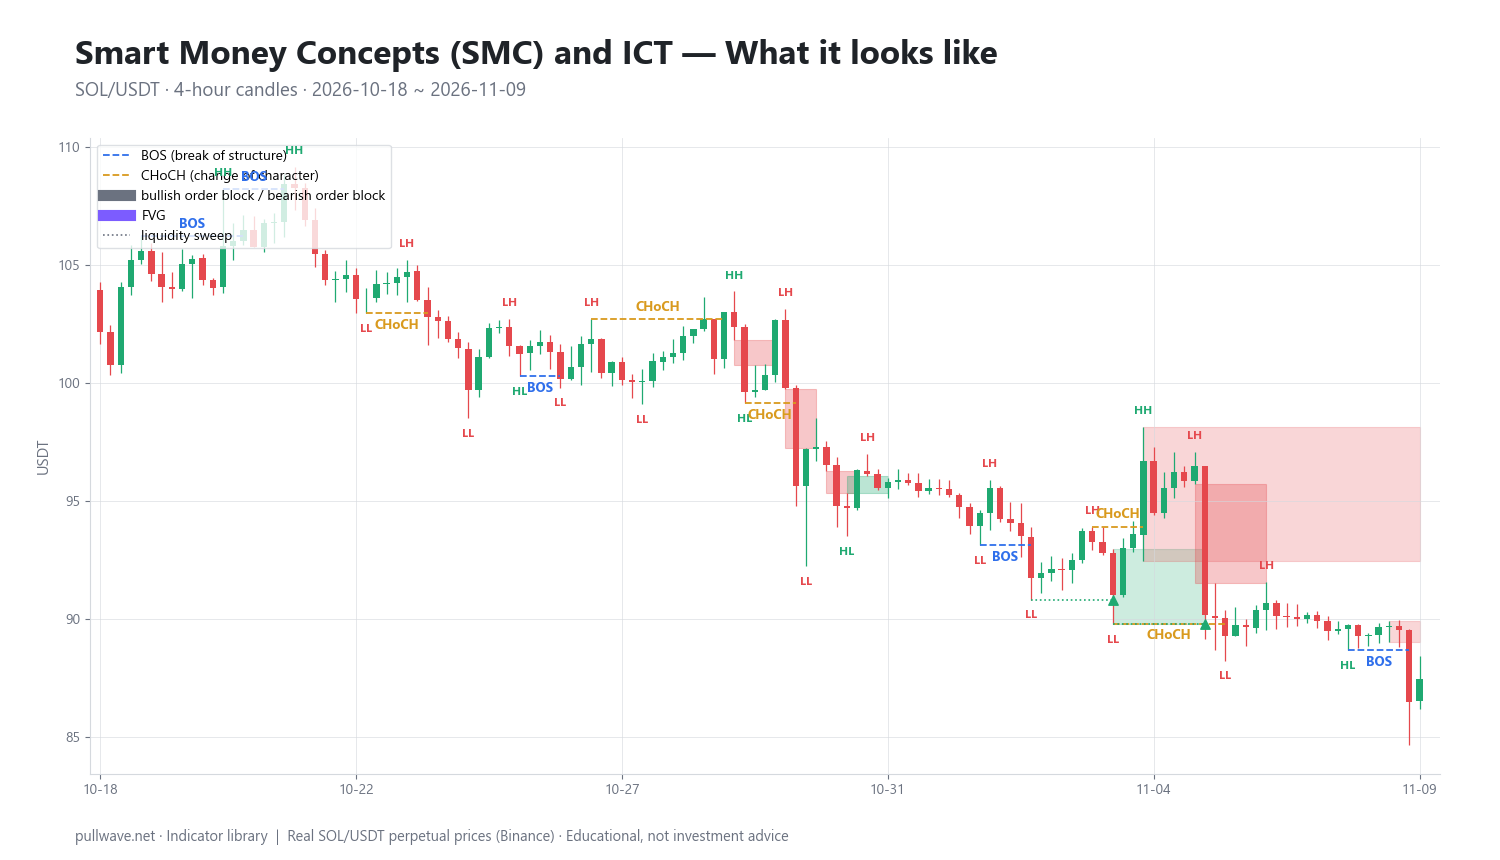
Figure 1 shows a real SOL/USDT 4h chart with the complete toolkit drawn by simple mechanical rules: swing labels (higher high, higher low, lower high, lower low), break-of-structure and change-of-character lines, order-block boxes, fair value gap boxes and liquidity-sweep markers. Everything below is a description of how those marks were produced and what traders claim they mean.
What is Smart Money Concepts (SMC) and ICT?
ICT stands for "Inner Circle Trader," the online alias of Michael J. Huddleston, who has published a very large body of free trading videos since roughly the mid-2010s. SMC ("smart money concepts") is the looser community label for the family of methods that grew out of that material and adjacent price-action teaching, repackaged by thousands of other educators on video platforms and social media.
There is no single canonical text. Terminology drifted as the material spread: what one teacher calls a market structure shift (MSS) another calls a change of character (CHoCH), and definitions of an order block range from "the last opposite-colour candle before an impulsive move" to much more restrictive versions requiring a liquidity sweep and an unfilled gap. When you read SMC content, assume the definitions are local to the author until proven otherwise.
The core claim shared across versions is this: price does not move randomly between support and resistance, but moves from one pool of resting orders to another, and the visible footprints of that process — sweeps, structure breaks, imbalances — can be read on a bare chart. Proponents argue that large participants need counterparty liquidity to fill size, so price is drawn toward obvious stop clusters before reversing. That is a hypothesis about order flow, not an established fact, and it is not something retail chart data can confirm or refute.
The idea behind it (theory and history)
Most SMC building blocks have older, better-documented ancestors. Marking higher highs and higher lows and calling a trend over when the sequence breaks is Dow theory swing analysis, formalised more than a century ago. An order block is a supply/demand or support/resistance zone drawn from a specific candle. A liquidity sweep below an obvious low, followed by a sharp recovery, is close to what Richard Wyckoff described as a spring (and an upthrust at the top). A fair value gap is a three-candle price gap — imbalance between buying and selling within a short window. The "optimal trade entry" band is a Fibonacci retracement zone.
That overlap is not a criticism in itself; good ideas get rediscovered. But it matters for expectations. If order blocks are mostly support and resistance with a narrative attached, they inherit the same statistical behaviour: some hold, many do not, and the ones that look obvious in hindsight were not obvious in real time.
Be honest about the evidence. There is no peer-reviewed or independent research establishing that SMC/ICT patterns produce a positive expectancy, and the framework is close to impossible to test cleanly because the rules are discretionary. Backtests published by proponents almost always encode one person's interpretation. Treat the whole thing as a lens for organising observations, not as a validated model of institutional behaviour.
How it is calculated
SMC has no formula in the sense that RSI does, but every element can be reduced to mechanical rules — and should be, if you want to study it honestly. The rules below are the ones used for the chart and the example on this page.
Step by step:
- Find swing points. A bar is a swing high if its high is above the highs of the three bars on each side; a swing low is the mirror image. Three bars per side is a common fractal setting; two reacts faster, five is smoother.
- Track structure. Keep the most recent confirmed swing high and swing low. A break of structure (BOS) occurs when a candle closes beyond the last swing point in the direction of the existing trend. A change of character (CHoCH) occurs when a close breaks the last swing point against the existing trend — the first evidence the sequence has flipped.
- Mark liquidity. Equal or near-equal highs and lows, and prior swing extremes, are treated as stop clusters (buy-side liquidity above highs, sell-side below lows). A sweep is a bar that trades beyond such a level and closes back inside it.
- Mark order blocks. Take the last down-close candle before an up move that breaks structure (bullish OB), or the last up-close candle before a structure-breaking down move (bearish OB). The box spans that candle's range.
- Mark fair value gaps. In a three-candle sequence, if candle 1's high is below candle 3's low, the space between them is a bullish FVG; if candle 1's low is above candle 3's high, it is a bearish FVG.
- Build the premium/discount map. Take the highest high and lowest low of a lookback window, split it at 50% (equilibrium), and mark the 62–79% retracement band of the working leg as the OTE zone.
``` swing_high(i) = high[i] > max(high[i-3..i-1], high[i+1..i+3]) swing_low(i) = low[i] < min(low[i-3..i-1], low[i+1..i+3])
BOS = close breaks last swing in the direction of the current trend CHoCH = close breaks last swing against the current trend
bullish_FVG = high[i-1] < low[i+1] (gap = low[i+1] - high[i-1]) bearish_FVG = low[i-1] > high[i+1]
sweep_low = low[i] < prior_low AND close[i] > prior_low
range_high = highest high of last N bars (N = 80 here) range_low = lowest low of last N bars equilibrium = (range_high + range_low) / 2 pos_in_range% = (close - range_low) / (range_high - range_low) * 100 OTE = 62% to 79% retracement of the most recent impulse leg ```
Default settings and variations
| Element | Common default | Why / variations |
|---|---|---|
| Swing fractal | 3 bars each side | Filters noise while keeping structure responsive; 2 for scalping, 5+ for swing charts |
| Structure break | Candle close beyond the swing | Wick-based breaks trigger far more often and more falsely; some teachers require a close, others any trade through |
| Order block | Last opposite-colour candle before the impulse | Strict versions add: must create an FVG, must follow a sweep, must break structure |
| Fair value gap | 3-candle imbalance | Some require a minimum size (e.g. ≥ 0.2× ATR) so micro-gaps are ignored |
| Range lookback | 80 bars on 4h (~13 days) | Long enough to contain a full swing; shorter ranges re-anchor too often |
| OTE band | 62%–79% retracement | Fibonacci-derived; other users simply use the 50–79% half |
| Kill zones | London/New York time windows | A claim about when volume is typically higher, not a rule — and far weaker in 24/7 crypto |
On sessions: ICT material places heavy emphasis on specific hours ("kill zones"). In equities and FX there is a genuine volume cycle tied to exchange hours. Crypto trades continuously with no session gaps, though activity still clusters around European and US hours. Treat time-of-day as a mild statistical tendency, not a trigger.
How to read it
Read a chart top-down, in this order:
- Structure first. Is the higher timeframe making higher highs and higher lows, lower highs and lower lows, or neither? "Neither" is a range, and most SMC signals degrade badly in ranges.
- Then liquidity. Where are the obvious equal highs and lows, the round numbers, the visible prior extremes? Those are the magnets the framework assumes price is travelling toward.
- Then location. Is price in the premium half (above equilibrium) or the discount half? Buying interest is conventionally sought in discount, selling interest in premium — a formalisation of "don't chase."
- Then the fine detail. Order blocks, fair value gaps and OTE bands narrow a broad zone into a specific price band where you would want to see a reaction.
A BOS says the existing trend is continuing. A CHoCH says the sequence just broke for the first time — it is a warning, not a confirmation, and it is the single most over-traded element of the framework.
How traders use it
1. Top-down bias setting. Define direction on a higher timeframe (daily or 4h), then look for setups on a lower one only in that direction. Works when the higher timeframe is genuinely trending. Fails when the higher timeframe is ranging, because every lower-timeframe CHoCH then contradicts the last one.
2. The sweep → shift → entry sequence. Wait for price to take out an obvious high or low and close back inside, then for a structure break in the opposite direction, then look for a reaction at the order block or fair value gap that caused the break. Works at the edges of well-formed ranges and at the end of exhausted trends. Fails on news spikes and liquidation cascades, where the "sweep" simply keeps going.
3. Imbalance as a retracement target. Treat unfilled fair value gaps as areas price is likely to revisit. Works in orderly markets where gaps are small and frequent. Fails in violent trends, where gaps can stay open for weeks — and a gap that never fills has no deadline, so the idea is unfalsifiable in real time.
4. Premium/discount discipline. Use the range map purely as a position-sizing and patience filter: no new long exposure in deep premium, no new shorts in deep discount. Works as a behavioural guardrail. Fails as a signal — in a strong trend price can sit in premium for the entire move.
The canonical workflow stitches these together: higher-timeframe bias → liquidity sweep → structure shift → entry zone (OB / FVG / OTE) → protective stop beyond the swing that created the shift → target the next pool of liquidity. Every step is discretionary; the stop placement is the only part that is mechanical, and it is the part that matters most.
Example on a real SOL chart
The window is SOL/USDT perpetual on Binance, 4h candles, 18 October to 9 November 2026. All marks come from the mechanical rules above: swing fractal of 3 bars each side, close-based structure breaks, and a premium/discount range taken from the highest high to the lowest low of the last 80 bars.
Across that window the rules produced 5 breaks of structure, 5 changes of character, 10 order blocks, 8 fair value gaps and 4 liquidity sweeps — about 32 marked objects in 22 days, roughly one and a half per day. That density is itself a finding: on a 4h crypto chart the framework generates far more objects than a discretionary trader can act on, so selection becomes the whole game.
The range measured 103.89 at the high and 84.66 at the low, putting equilibrium at 94.28. The last close of 87.44 sat at 14.5% of the range — deep discount. Over the window, 46.2% of closes were in the discount half, so the market spent slightly more time above equilibrium than below it even though it ended near the bottom.
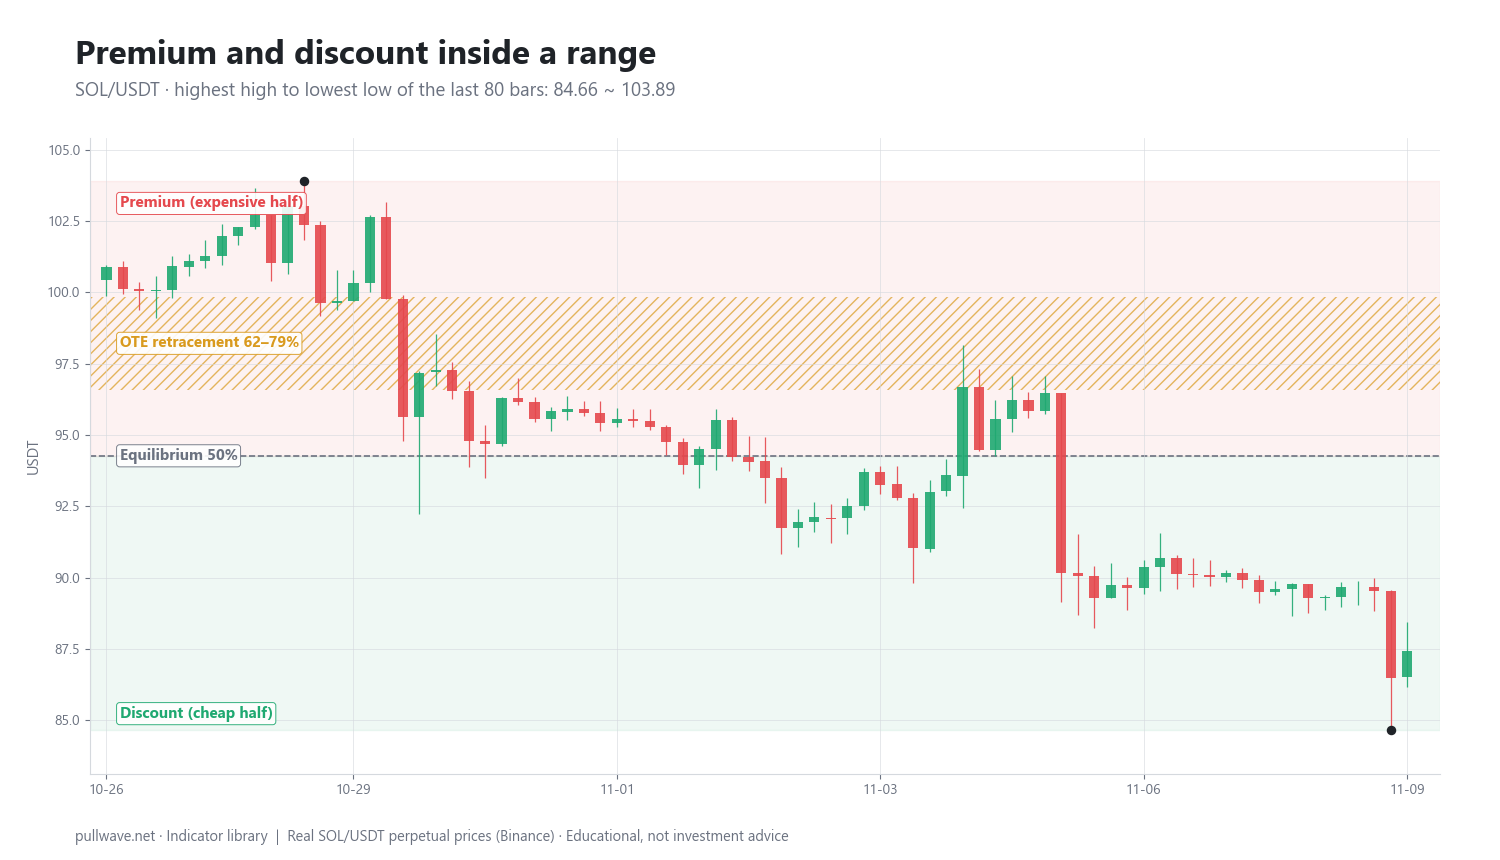
Figure 2 is explicitly not a signal chart. It is the premium/discount map of the last 80 bars: equilibrium at the 50% line, the premium half above, the discount half below, and the 62–79% OTE retracement band shaded. It shows location only — where price sits relative to its own recent range.
The five CHoCH events, with the close six bars later and eighteen bars later:
| Date (UTC) | Event | Price | After 6 bars | After 18 bars |
|---|---|---|---|---|
| 2026-10-23 20:00 | CHoCH ↓ | 102.79 | −0.45% | −1.83% |
| 2026-10-28 16:00 | CHoCH ↑ | 103.02 | −3.15% | −7.03% |
| 2026-10-29 20:00 | CHoCH ↓ | 95.62 | +0.71% | −1.16% |
| 2026-11-04 12:00 | CHoCH ↑ | 96.69 | −6.75% | −7.43% |
| 2026-11-05 20:00 | CHoCH ↓ | 89.30 | +0.90% | −3.14% |
Measured mechanically, 1 of 5 events moved in the signalled direction after six bars. The two bullish CHoCH signals were the worst: both appeared near local highs in what turned out to be a declining market and were followed by drops of 3.15% and 6.75% within six bars. The bearish signals were directionally right over eighteen bars (−1.83%, −1.16%, −3.14%) but barely moved in the first six.
Read this honestly. It is one market, one timeframe, one 22-day window, and one mechanical interpretation of rules that are normally applied with discretion — another trader would mark different swings and get different results. It is not evidence that CHoCH signals fail, and a better window would not be evidence that they work. What it does illustrate is a real structural problem: in a choppy downtrend, counter-trend structure breaks fire repeatedly and the signal direction and the dominant direction disagree.
Common mistakes
- Hindsight marking. On a finished chart every reversal has a tidy order block behind it. The honest test is to mark a chart bar by bar with the right-hand side covered, then reveal.
- Trading every CHoCH. A change of character is the first break against the trend and is wrong often, especially inside ranges. The SOL window above shows what a cluster of them looks like.
- Ignoring the higher timeframe. A 5-minute CHoCH against a daily trend is noise with a label.
- Zone inflation. Marking ten order blocks and eight gaps on one screen guarantees price will touch something before every move, which feels like confirmation and isn't.
- Treating the narrative as fact. "The banks hunted the stops" is an unverifiable story. Price going below a low and coming back is an observation; the explanation is not.
- Stop placement by belief. Putting a stop just beyond a zone because it "should hold" rather than where the idea is actually invalidated is how small losses become large ones.
- Over-leverage on perps. These setups are often sold with tight stops and wide targets. On leveraged perpetuals, a tight stop plus a single wick equals a closed position — or a liquidation if the stop was replaced by hope.
Combining it with other tools
SMC marks where; other tools help with whether and how much.
- Volume and open interest. A sweep that coincides with a spike in volume and a sharp drop in open interest is more consistent with forced liquidation than one on thin volume. On crypto perps this is cheap, independent information.
- Funding rates. Persistently high positive funding tells you leveraged longs are crowded, which at least makes the "liquidity above the highs" story more concrete than a drawn box does.
- ATR. Use it to size stops and to filter fair value gaps — a gap smaller than a fraction of ATR is noise.
- Classical support and resistance. If an order block lands on a level that is also visible to everyone using horizontal lines, you have agreement from two frameworks rather than one.
- Higher-timeframe moving averages. A simple 50/200 relationship is a crude but objective trend filter that keeps you from fighting the dominant direction with lower-timeframe structure breaks.
The sibling pages on this site cover market structure, order blocks, fair value gaps and liquidity sweeps in detail, each with its own mechanical rules and failure modes.
Frequently asked questions
Q. What is the difference between SMC and ICT?
ICT refers specifically to the material published by Michael J. Huddleston under the "Inner Circle Trader" name. SMC — smart money concepts — is the broader, informal community framework that grew out of it and adjacent price-action teaching. In practice the vocabularies overlap heavily, but definitions and emphasis vary from one teacher to another, so always check how a given source defines its terms.
Q. Does smart money concepts trading actually work?
There is no peer-reviewed or independent evidence that SMC/ICT patterns provide an edge, and the discretionary nature of the rules makes clean testing very difficult. Many components are repackaged versions of older, better-documented ideas such as Dow swing structure, support and resistance, Wyckoff springs and Fibonacci retracements. It can be a useful organising lens for reading price, but anyone claiming proven profitability is overstating what the evidence supports.
Q. What is the difference between BOS and CHoCH?
A break of structure (BOS) is a close beyond the last swing point in the direction the market is already trending — continuation. A change of character (CHoCH), sometimes called a market structure shift, is a close beyond the last swing point against the trend — the first sign the sequence may be flipping. CHoCH is an early warning and produces far more false signals than BOS.
Q. What timeframe is best for SMC in crypto?
Most traders set bias on the daily or 4h chart and refine entries on 15m to 1h. Lower timeframes generate many more structure breaks, and in 24/7 crypto with frequent liquidation wicks a large share of them are noise. The sensible default is to use the highest timeframe that still gives you enough opportunities for your schedule.
Q. Do ICT kill zones apply to crypto?
Only loosely. Kill zones describe hours when volume is typically higher in session-based markets such as FX and equities; crypto trades continuously with no session gaps. Activity does still cluster around European and US business hours, so treat the time windows as a mild statistical tendency rather than a rule.
Q. How can a beginner study SMC safely?
Mark the concepts on past charts with the right-hand side covered so you cannot see the outcome, keep a written log of what you marked and what happened, then paper trade the workflow for several weeks before risking money. Keep risk per idea small and fixed, and avoid leverage while you are still learning where the method fails — the failure cases teach more than the clean examples.
Key takeaways
- SMC and ICT are discretionary chart-reading frameworks, not indicators; they supply vocabulary and a workflow, and every element can be reduced to mechanical rules for honest study.
- The "smart money hunts stops" narrative is the framework's hypothesis about order flow, not an established fact, and much of the toolkit restates older ideas from Dow theory, Wyckoff, support/resistance and Fibonacci.
- The core sequence is higher-timeframe bias → liquidity sweep → structure shift → entry zone → stop beyond the shift swing → target the next liquidity pool; the stop placement is the only mechanical part and the most important.
- In the illustrated SOL/USDT 4h window the rules produced 5 BOS, 5 CHoCH, 10 order blocks, 8 FVGs and 4 sweeps in 22 days — about 32 objects, roughly one and a half per day — and 1 of 5 CHoCH events moved in the signalled direction after six bars; one window, one interpretation, and not evidence either way.
- The biggest practical risks are hindsight marking, zone inflation, counter-trend signals in ranges, and tight stops combined with high leverage on perpetual futures.
Educational material. Charts use real SOL/USDT perpetual prices; past behaviour does not predict future results. Not investment advice.