Indicator & technique library · Trading techniques
Trend Following Explained: Rules, Signals and Limits
At a glance
- Trend following is a rules-based technique that enters in the direction of an existing price move and exits when that move ends, rather than trying to predict tops and bottoms.
- The classic implementations are dual moving-average crossovers and N-bar breakouts, usually combined with a volatility-based stop such as a multiple of ATR.
- It typically produces a low win rate with a small number of large winners, so position sizing and exit discipline matter more than entry precision.
- In the SOL/USDT 4h window studied, only 11.7% of closes were above the EMA 50 and the single EMA 20/50 cross produced -5.81% after 6 bars and -4.65% after 18 bars — one illustration, not evidence of edge.
Trend following is not an indicator. It is a way of making decisions: you assume that a price move already in progress is more likely to continue than to reverse at any given moment, and you build mechanical rules that keep you positioned in that direction until the evidence changes. Everything else — moving averages, breakout channels, ATR stops — is just plumbing for that one idea.
Traders care about it because it is one of the few approaches with a long, publicly documented track record across many markets and decades, and because it is honest about what it cannot do. A trend follower does not know where the top is. The technique accepts many small losses in exchange for staying in the occasional very large move, which is exactly the payoff shape crypto markets have historically produced.
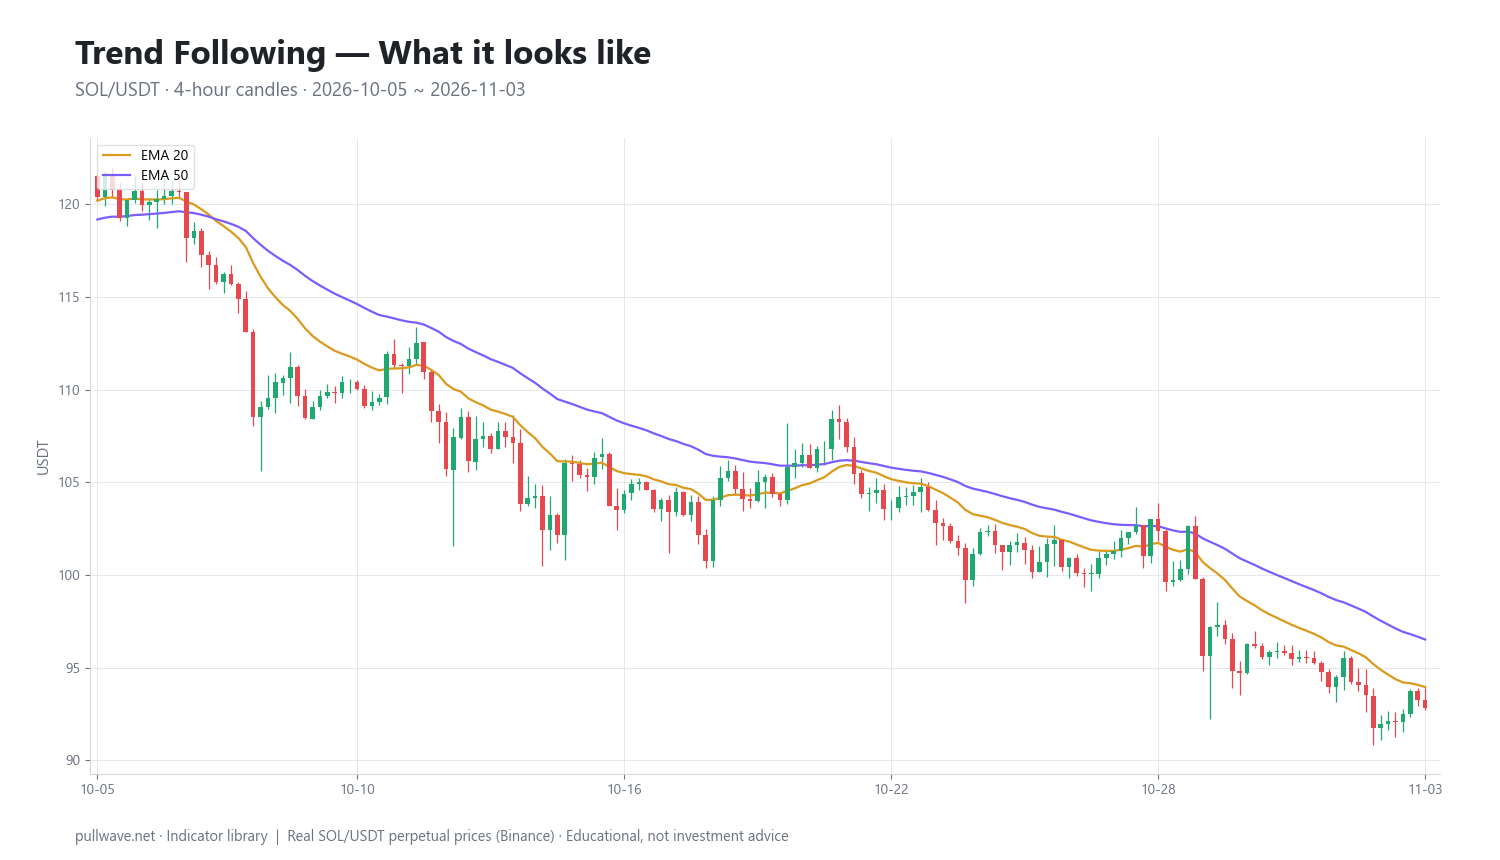
Figure 1 shows the technique applied to real SOL/USDT 4h candles: a fast EMA (20) and a slow EMA (50) plotted over price, with the state of the market defined by which average sits above the other. Notice that the lines say nothing about value — only about direction and persistence.
What is Trend Following?
Trend following is a systematic technique in which entry, exit and position size are determined by the direction and volatility of recent price action, not by forecasts, valuation or news. The core rule set is deliberately simple: define a trend, participate while it lasts, cut the position when the definition is violated.
Three components are always present, whatever the specific rules:
- A trend filter — an objective definition of "up" or "down" (moving average relationship, price above an N-day high, slope of a regression line).
- An entry trigger — the moment the filter changes state, or a pullback within an already-confirmed state.
- An exit — a stop that is allowed to trail with price, so winners can run and losers are capped.
What is deliberately absent is a profit target. Capping the upside removes the only part of the distribution that pays for the losses, which is why most classic trend systems exit on a trailing rule rather than a fixed objective.
The idea behind it (theory and history)
The conceptual root is Dow Theory, drawn from Charles Dow's Wall Street Journal editorials around 1900–1902 and later organized into a formal body of ideas by William Peter Hamilton and Robert Rhea. Dow described markets as moving in primary, secondary and minor trends, and argued that a trend should be assumed intact until it gives a clear signal to the contrary. That "assume continuation until proven otherwise" stance is the whole philosophy in one sentence.
The mechanical version is usually credited to Richard Donchian, who began publishing systematic rules in the mid-20th century, launched one of the first publicly offered managed futures funds in 1949, and popularized both the 5/20 moving-average system and the channel breakout that carries his name. In the 1970s and 1980s, Ed Seykota built some of the earliest computerized trend systems, and in 1983–1984 Richard Dennis and William Eckhardt ran the "Turtle" experiment, teaching a group of novices a breakout-based trend system with explicit volatility-based position sizing. The Turtle rules were later published widely and remain a useful reference for how the pieces fit together.
Why should it work at all? Academic finance calls the effect time-series momentum: Moskowitz, Ooi and Pedersen documented it across dozens of futures markets in a 2012 Journal of Financial Economics paper, and related work (for example AQR's "A Century of Evidence on Trend-Following Investing") extends the study back over a century. The usual behavioral explanations are under-reaction to new information, herding as a move attracts attention, and risk management flows — stop-outs, margin calls and liquidations — that mechanically extend moves once they start. In crypto, the liquidation cascade on perpetual futures is a very literal version of that last mechanism.
None of this makes trends predictable. It makes them persistent on average, which is a weaker and much more fragile claim.
How it is calculated
The calculation depends on the filter you choose. The most common, and the one used in the example below, is a dual exponential moving average state.
Step by step:
- Choose a fast lookback (here 20 bars) and a slow lookback (here 50 bars) on a fixed timeframe.
- Compute the smoothing constant for each:
k = 2 / (N + 1). For 20 bars that is 0.0952; for 50 bars, 0.0392. - Seed each EMA with a simple average of the first N closes, then update it on every new close.
- Define the trend state: +1 when the fast EMA is above the slow EMA, -1 when it is below.
- A signal occurs on the bar where the state changes. Everything between signals is "hold the state."
``` k = 2 / (N + 1) EMA_t = Close_t * k + EMA_(t-1) * (1 - k)
state_t = +1 if EMA20_t > EMA50_t else -1 signal = bar where state_t != state_(t-1) ```
The breakout variant replaces the averages with a channel:
Upper_t  = highest High over the last N bars (excluding the current bar)
Lower_t  = lowest  Low  over the last N bars (excluding the current bar)
long state  starts when Close_t > Upper_t
short state starts when Close_t < Lower_t
And the risk layer, which is part of the technique rather than an optional extra:
TR_t     = max(High-Low, |High-Close_prev|, |Close_prev-Low|)
ATR_14   = Wilder's smoothed average of TR over 14 bars
stop     = entry -/+ 2 * ATR_14   (trailed in the trade's favor only)
units    = (account_risk_in_currency) / (2 * ATR_14 * contract_value)
The ATR term does two jobs: it sets a stop distance proportional to current noise, and it makes position size shrink automatically when volatility expands — which in crypto it regularly does.
Default settings and variations
| Component | Common default | Why it exists |
|---|---|---|
| Fast MA | 20 | Roughly one month of daily bars; on 4h charts, a little over three days |
| Slow MA | 50 | Long enough to filter most noise, short enough to turn within a swing |
| Channel breakout | 20-bar entry, 10-bar exit | Donchian/Turtle convention: enter slowly, exit faster |
| Stop | 2 × ATR(14) | Wilder's original ATR period; 2× keeps the stop outside ordinary noise |
| Risk per trade | 0.5–1% of equity | Keeps a long losing streak survivable |
The 20/50 pair is a convention inherited from equity and futures charting, not a law. Slower pairs (50/200) produce fewer, larger-horizon signals and far fewer whipsaws; faster pairs (9/21) react sooner and whipsaw more. Some traders replace the crossover entirely with a single moving average plus a slope condition, or with the ADX to require a minimum trend strength before any signal is taken.
A practical rule: the more you shorten the lookbacks, the more your results depend on trading costs and funding, because the number of round trips rises faster than the average gain per trade.
How to read it
Read the state first, the slope second, the separation third.
- State: which average is on top. This is the regime the rules say you are in. It tells you which direction of trade the system permits, nothing more.
- Slope: both averages rising, both falling, or flat. Flat averages that keep touching each other are the signature of a range, and ranges are where this technique bleeds.
- Separation: the gap between fast and slow, ideally measured in ATR units. A wide, expanding gap means the move is accelerating; a narrowing gap is the first evidence of exhaustion, well before any cross.
A crossover is always late by construction. The fast EMA needs several closes on the other side of the slow EMA before the cross completes, so you are never buying the low or selling the high. That lateness is the price of filtering; a system that signals earlier signals more often, and most of those extra signals are noise.
How traders use it
1. Regime filter rather than entry trigger. Use the EMA state to decide which direction you are allowed to trade, then take entries with a separate shorter-term tool. Works when the higher timeframe is clearly directional and you want to avoid fighting it. Fails in sideways markets, where the filter flips every few days and simply doubles your transaction costs.
2. Crossover entry with a trailing stop. The purest form: enter on the state change, exit on the opposite state change or on a trailing ATR stop, whichever comes first. Works in markets that make sustained multi-week moves — historically, that includes crypto after major breakouts. Fails during choppy consolidation, where a string of small losses accumulates faster than most traders expect.
3. Breakout entries inside a confirmed trend. Require the EMA state first, then enter only when price takes out an N-bar extreme in that direction. Works when volatility is expanding and the breakout has follow-through. Fails in low-volatility compression, where breakouts routinely retrace back inside the range within a few bars.
4. Pullback entries to the fast average. Wait for price to retrace toward the fast EMA while the state remains intact, then act on a resumption signal. Works in orderly, steady trends and gives a tighter stop than a breakout entry. Fails in violent trends that never pull back (you simply miss the move) and at genuine trend ends, where the "pullback" turns out to be the reversal.
Across all four, the realistic expectation is a win rate well below 50% with an average winner several times the average loser. If you are not comfortable losing six or seven trades in a row, this technique will be psychologically unworkable regardless of how good the rules are.
Example on a real SOL chart
The window is SOL/USDT perpetual on Binance, 4h candles, 5 October 2026 to 3 November 2026, with EMA 20 and EMA 50.
The character of this window is best summarized by one statistic: only 11.7% of closes were above the slow EMA. This was a one-directional, predominantly bearish period, which is precisely the environment a trend filter is built to keep you on the right side of. The last close in the window was 92.81.
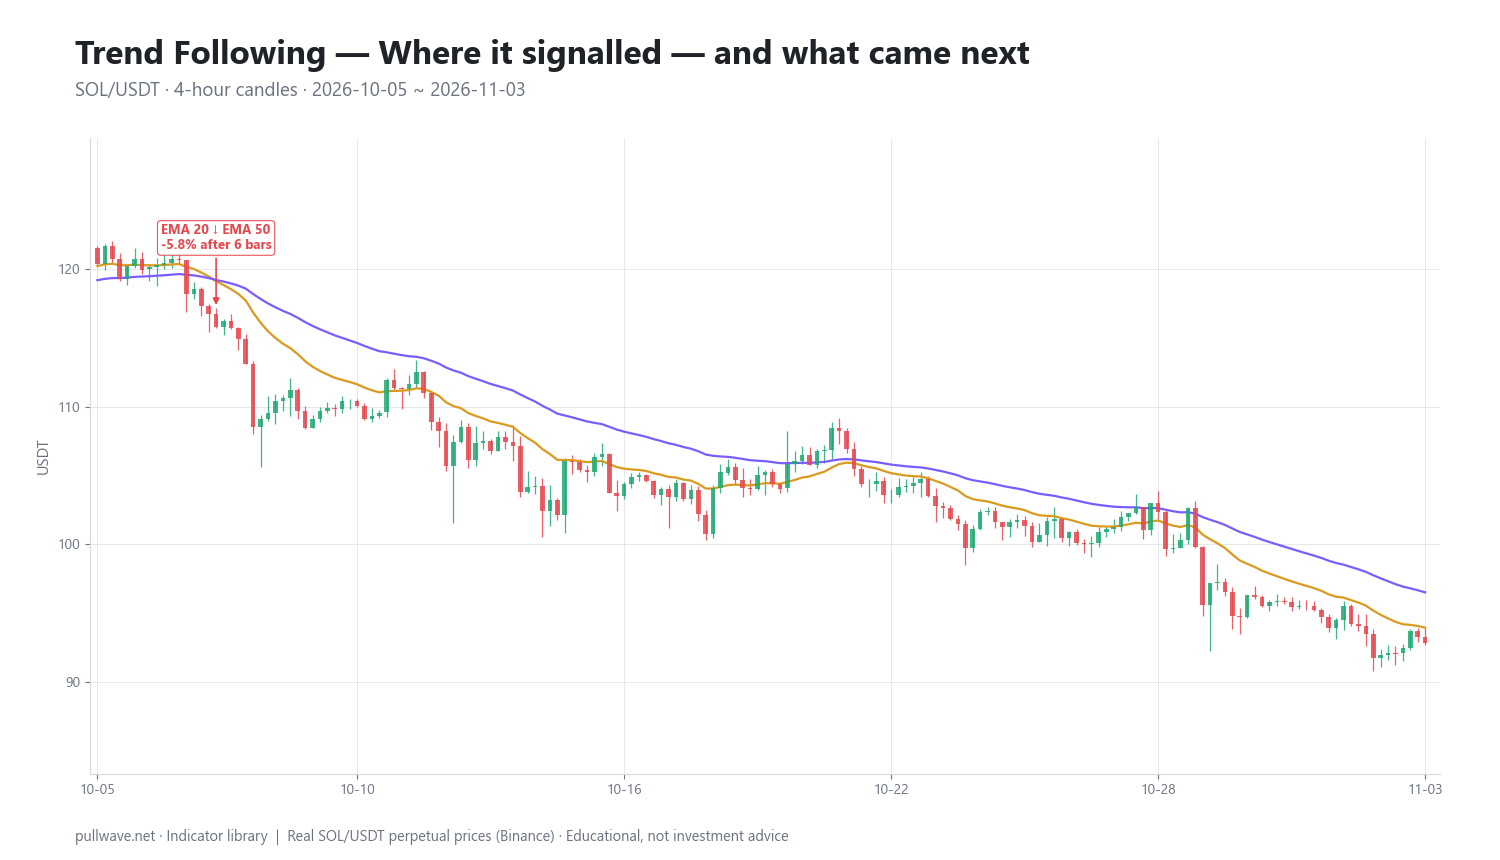
Figure 2 marks the signals and the measured outcome after 6 and 18 bars. There was exactly one state change in the whole window: on 7 October 2026 at 16:00 UTC, the EMA 20 crossed below the EMA 50 at a price of 115.81.
Outcomes measured from that bar:
| Signal | Date (UTC) | Price | After 6 bars | After 18 bars |
|---|---|---|---|---|
| EMA 20 ↓ EMA 50 | 2026-10-07 16:00 | 115.81 | -5.81% | -4.65% |
The move went in the signaled direction at both horizons — 1 of 1 by that measure. Three things deserve an honest reading. First, the sample is a single event; nothing can be concluded about reliability from one observation. Second, the 18-bar result (-4.65%) was weaker than the 6-bar result (-5.81%), meaning price rebounded between the two checkpoints. A trader using a tight trailing stop could easily have been taken out during that bounce with a far smaller gain than the headline numbers suggest, or even at a loss after costs. Third, price finished the window at 92.81 — roughly 20% below the signal price — so the fixed-bar snapshots understate what a position held to the end of the window would have captured. The exit rule, not the entry, determined almost all of the outcome.
This is a typical trend-following picture in miniature: one signal, a long stretch of simply holding the state, and results that depend heavily on choices the crossover itself does not make. On a 24/7 perpetual market, funding payments over roughly 26 days would also have mattered and are not included in these percentages.
Common mistakes
- Trading the technique in a range. The single largest source of losses. If the averages are flat and intertwined, the definition of trend is not satisfied, and taking signals anyway converts a trend system into a noise generator.
- Adding a profit target. Capping winners while leaving losers to run to the stop inverts the payoff the method depends on.
- Optimizing lookbacks on past data. A 23/47 pair that looked best last year is a curve fit. Robustness across nearby parameter values matters far more than the peak of the backtest surface.
- Ignoring costs and funding. On 4h crypto charts with leverage, fees plus funding can consume a meaningful part of the expected edge, especially for faster settings.
- Sizing by conviction instead of volatility. Without an ATR-based size, one trade taken during a volatility spike can erase the gains from a dozen normal ones.
- Abandoning the system during a drawdown. Trend systems spend most of their time below a prior equity high. Switching rules after a losing streak usually means being out of position for the move that would have paid for it.
Combining it with other tools
Trend following answers "which direction?" It does not answer "how strong?", "how stretched?" or "how much risk?", so the natural companions fill those gaps.
- ADX or a volatility ratio can gate the system: only take signals when trend strength exceeds a threshold, which removes a portion of range-bound whipsaws at the cost of entering later.
- ATR is effectively mandatory, both for stop placement and for sizing. Treating ATR as part of the strategy rather than an add-on is one of the clearest dividing lines between durable and fragile implementations.
- Higher-timeframe alignment — checking the daily state before trading the 4h state — filters many counter-trend signals, though it also reduces the number of opportunities substantially.
- Volume or open interest on perpetuals can help distinguish a breakout supported by new positioning from one driven only by a short squeeze that unwinds quickly.
- Oscillators such as RSI are best used descriptively here, for example to recognize that a trend is extended, rather than as reversal signals against the trend state.
Resist stacking filters. Each one you add removes losing trades and winning trades together, and past a certain point the system stops trading often enough for its statistical edge, if any, to appear.
Frequently asked questions
Q. What is the best moving average setting for a trend following strategy in crypto?
There is no universally best pair. The 20/50 EMA combination is a reasonable, widely used default because it is slow enough to ignore most intraday noise and fast enough to turn within a typical swing. Slower pairs such as 50/200 generate fewer whipsaws and suit position trading, while faster pairs such as 9/21 react sooner but produce far more false signals once fees and funding are counted.
Q. Does trend following work in crypto's 24/7 market?
The logic transfers, but the mechanics change. With no weekend close, multi-day moves develop through low-liquidity hours, and volatility clusters are more extreme than in traditional futures. That tends to mean wider ATR stops, smaller position sizes for the same risk, and a stronger argument for using the higher timeframe as a filter.
Q. What win rate should I expect from a trend following system?
Published results for classical trend systems commonly show win rates in the 30–45% range, with profitability coming from a small number of outsized winners. A high win rate is usually a warning sign that profits are being taken early, which removes the fat tail the method relies on. Judging such a system by win rate alone is misleading.
Q. What is the difference between trend following and momentum?
In practice the terms overlap, but academics distinguish time-series momentum — an asset's own past return predicting its future return, which is what trend following exploits — from cross-sectional momentum, which ranks assets against each other and buys the strongest relative to the weakest. A single-market moving-average system is time-series momentum; a rotation across twenty tokens is cross-sectional.
Q. Which timeframe is best for trend following?
Longer timeframes generally have a better ratio of signal to noise and lower cost drag, which is why daily and weekly charts dominate the classical literature. Intraday timeframes like 4h produce more signals but are more exposed to fees, funding and liquidation risk on leveraged perpetuals. The right choice is the slowest timeframe you can monitor consistently and hold through without interfering.
Q. How can I reduce whipsaws in a moving average crossover?
Common approaches include requiring a minimum separation between the averages before accepting the cross, demanding confirmation from a trend-strength measure, waiting for the bar to close rather than acting intrabar, and aligning with a higher timeframe. Each of these reduces false signals and also removes some genuine ones, so the improvement is a trade-off rather than a free gain.
Key takeaways
- Trend following is a rules framework, not an indicator: define the trend, participate while it persists, exit when the definition breaks, and never set a profit cap on the winners.
- Its documented history runs from Dow Theory through Donchian's mechanical systems and the 1983–84 Turtle experiment to modern time-series momentum research; the effect is persistent on average, not reliable on any single trade.
- The calculation is simple — two EMAs, a state, and an ATR-based stop and size — but the risk layer, not the entry, determines most of the outcome.
- Market regime decides everything: the technique earns its keep in sustained directional moves and bleeds steadily in ranges, which is why a strength filter or higher-timeframe check is worth the lost opportunities.
- In the SOL/USDT 4h window examined, 11.7% of closes sat above the EMA 50 and the single EMA 20/50 cross at 115.81 gave -5.81% after 6 bars and -4.65% after 18 bars — one illustration on one market, with a non-monotonic path that shows how much the exit rule matters.
Educational material. Charts use real SOL/USDT perpetual prices; past behaviour does not predict future results. Not investment advice.