Indicator & technique library · Trading techniques
Breakout Trading Explained: Rules, Levels, Examples
At a glance
- Breakout trading enters when price closes beyond a defined level such as the highest high or lowest low of the last N bars.
- The classic setting is a 20-bar channel, popularized by Donchian-style trend following and the 1980s Turtle rules.
- Breakouts tend to pay in trending, volatility-expanding regimes and bleed money in choppy ranges where most break attempts reverse.
- In a 4h SOL/USDT window with 9 breakouts, only 5 moved in the signal direction after 6 bars — a reminder that the edge is in follow-through, not frequency.
Breakout trading is the practice of entering a position when price moves decisively beyond a level that has been containing it — the top of a range, a prior swing high, the highest high of the last 20 bars. The premise is simple: a level only holds until it doesn't, and the moment it stops holding is often the moment a new move starts.
Traders care about breakouts because they are one of the few techniques that put you in a trend early, without needing to predict anything. You are not forecasting that price will break; you are reacting after it has. The cost of that simplicity is a high rate of failed attempts, and almost everything useful about breakout trading comes down to managing that failure rate rather than eliminating it.
What is Breakout Trading?
A breakout is a close beyond a reference level that was previously acting as support or resistance. The reference level can be mechanical (the highest high of the last N bars), structural (a prior swing high, a range top, a trendline), or volatility-based (the upper Bollinger Band, an opening-range extreme).
Breakout trading is the full process around that event: defining the level in advance, deciding what counts as a valid break, choosing an entry (the break candle, a retest, or a confirmation close), placing an invalidation point, and knowing when the break has failed. Without those rules you are not trading breakouts, you are chasing candles.
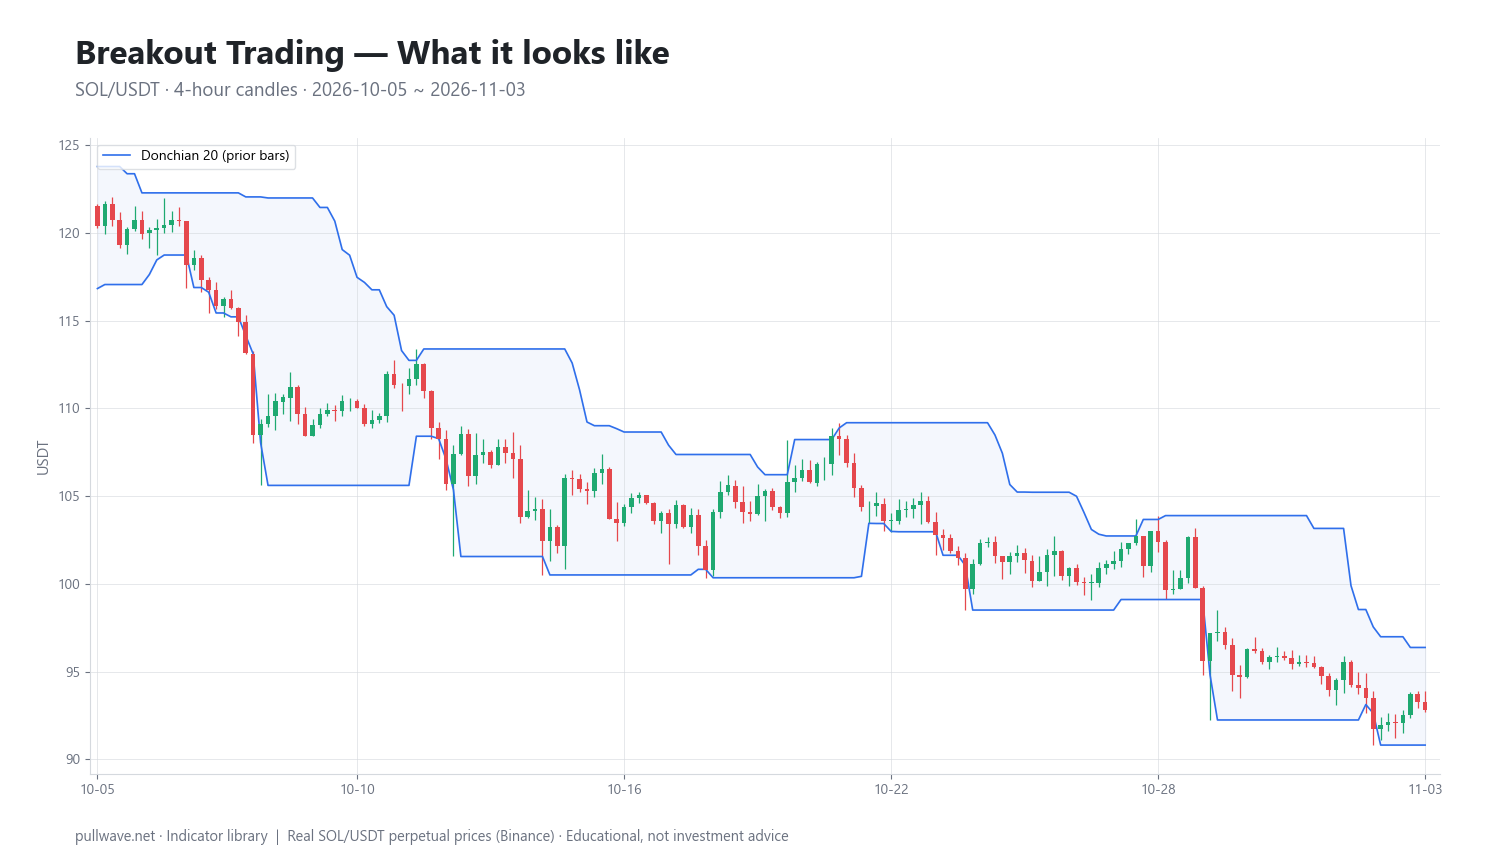
Figure 1 shows the technique applied mechanically to real SOL/USDT 4h candles: an upper band tracking the highest high of the previous 20 bars and a lower band tracking the lowest low. Any close outside the band is a breakout signal. Notice how the bands flatten when price consolidates and step down sharply when the market trends — that shape is the technique's whole personality.
The idea behind it (theory and history)
The theoretical argument is about information and inventory. A level persists because enough participants are willing to transact there — sellers at resistance, buyers at support. When price closes beyond it, that supply or demand has been absorbed. The traders who were short at resistance now face losses, and their stop orders become market orders in the direction of the break. Add fresh momentum traders and you get a short burst of one-sided flow.
The second argument is statistical: price distributions have fatter tails than a normal distribution, and volatility clusters. Large moves tend to follow large moves. A breakout is a crude but effective filter for "a large move may be starting," which is why trend-following systems have used it for decades.
Historically, the mechanical breakout is closely associated with Richard Donchian, the futures trader widely credited as a father of systematic trend following, who popularized channel-based rules in the mid-20th century; the "four-week rule" (buy a new four-week high, sell a new four-week low) is commonly attributed to him. Nicolas Darvas described a discretionary version in How I Made $2,000,000 in the Stock Market (1960), buying stocks that broke out of his "boxes."
The best-documented example is the Turtle experiment run by Richard Dennis and William Eckhardt starting in 1983, whose rules used 20-day and 55-day channel breakouts with volatility-based position sizing; the rules were later published by former Turtles, including Curtis Faith's Way of the Turtle (2007). On the short-term side, Toby Crabel's Day Trading with Short Term Price Patterns and Opening Range Breakout (1990) formalized volatility-contraction and opening-range breakout ideas that intraday traders still use.
How it is calculated
The mechanical channel breakout is the clearest version to compute, and the one used in the example below.
Step by step, in plain words:
- Choose a lookback length
N(for example 20 bars). - For the current bar, find the highest high of the previous
Nbars — not including the current bar. That is the upper level. - Find the lowest low of the previous
Nbars. That is the lower level. - If the current bar closes above the upper level, record a breakout up.
- If the current bar closes below the lower level, record a breakout down.
- Move to the next bar and recompute. The levels update every bar, so they trail price as it trends and go flat when it ranges.
``` Upper(t) = Highest High of bars t-N ... t-1 Lower(t) = Lowest Low of bars t-N ... t-1
Breakout up : Close(t) > Upper(t) Breakout down : Close(t) < Lower(t)
Optional filters: Buffer : Close(t) > Upper(t) * (1 + k) e.g. k = 0.002 ATR buffer: Close(t) > Upper(t) + 0.25 * ATR(14) Volume : Volume(t) > 1.5 * average Volume(20) ```
Two details matter more than people expect. First, excluding the current bar from the lookback prevents the level from being redefined by the very candle that is trying to break it. Second, close-based signals are far more conservative than wick-based signals: a wick through the level is a touch, a close beyond it is a decision.
For structural breakouts (range tops, trendlines) the level is drawn by hand, but the logic of steps 4–6 is identical.
Default settings and variations
- 20 bars is the most common default. On daily data it is roughly one month of trading activity, which is where the "four-week rule" came from. On a 4h crypto chart, 20 bars is about 3.3 calendar days — a short-swing horizon.
- 55 bars was the Turtles' slower system entry. It produces fewer, higher-quality signals and sits out more chop.
- 10 bars or shorter is used as an exit rule in classic trend following: enter on a 20-bar breakout, exit on a 10-bar breakout in the opposite direction.
- 5–7 bars suits intraday breakout scalping but generates a very large number of signals, most of which fail.
- Opening-range breakout uses the high and low of the first X minutes of a session instead of a rolling lookback. In 24/7 crypto there is no official open, so traders substitute a fixed UTC window, a daily candle open, or the high/low of the Asian session.
Variations worth knowing: requiring the break to exceed the level by a fraction of ATR (filters noise), requiring two consecutive closes beyond the level (filters wicks), requiring the breakout to occur in the direction of a higher-timeframe trend filter such as a 200-period moving average, and volatility-squeeze versions that only accept breakouts after Bollinger Band width or ATR has contracted to a multi-week low.
There is no universally optimal N. Shorter lookbacks trade more and lose more often; longer lookbacks trade less and give back more open profit per trade. Choose the one whose trade frequency and drawdown shape you can actually sit through.
How to read it
Read the channel before you read the signal. When the upper and lower bands are narrow and flat, the market is compressing and a breakout is more likely to mark a genuine regime change. When the bands are wide and sloping, you are already inside a trend, and a new breakout is a continuation signal rather than an initiation signal.
Read the location. A breakout out of a multi-day base at the edge of a larger range behaves differently from a breakout that happens in the middle of nowhere after price has already run 20%. The first has room; the second is often the tail end of a move.
Read the candle. A break candle that closes near its extreme, with an expanded range and above-average volume, shows commitment. A break candle with a long wick back inside the level shows the opposite — supply or demand reappeared immediately. That single distinction filters out a meaningful share of bad entries.
Finally, read what happens after. The most informative bar in a breakout is not the break itself but the one or two that follow. Continuation and a shallow retest that holds is the constructive sequence; an immediate close back inside the range is a failure signal that often resolves violently in the other direction.
How traders use it
1. Channel trend following. Enter on a close beyond the 20- or 55-bar extreme, size the position from ATR, trail the stop with a shorter opposite channel, and let a small number of large trends pay for many small losses. Works in volatility-expanding, directional regimes — crypto bull impulses and liquidation-driven downtrends. Fails in multi-week ranges, where the same rule buys every top and sells every bottom.
2. Range breakout with retest entry. Mark a horizontal range that has held at least three touches. Wait for a close outside it, then enter only if price pulls back to the broken level and holds. Works when the range is well defined and the break comes with volume, because the retest gives a tight invalidation. Fails when the breakout is strong enough that it never retests — you miss the move entirely — and when the "range" was really just low-volatility drift with no genuine participation at its edges.
3. Volatility-contraction (squeeze) breakout. Only take breakouts that follow a contraction in realized volatility: narrowing Bollinger Band width, a multi-day ATR low, or a visibly tightening triangle. Works because volatility mean-reverts over time and compression tends to resolve into expansion. Fails when the squeeze resolves in both directions in sequence — a common pattern around scheduled macro events and funding resets.
4. Trading the failed breakout. Some traders deliberately take the other side: when price closes beyond a widely watched level and then closes back inside within a bar or two, they treat the reclaim as a reversal signal. Works in ranging markets and around obvious round numbers and prior highs where stop clusters sit. Fails badly in strong trends, where what looks like a failed breakout is just a pause before continuation.
In crypto, two structural details change the arithmetic. Perpetual futures concentrate stop and liquidation orders just beyond obvious levels, which makes short overshoots and immediate reversals more frequent than on slower markets. And because the market never closes, a "breakout" can occur at 03:00 UTC on a Sunday with thin liquidity — the same signal, far less participation behind it.
Example on a real SOL chart
The window is SOL/USDT perpetual on Binance, 4h candles, 5 October to 3 November 2026, with the mechanical rule set to the 20-bar highest high / lowest low of the previous bars. The last close in the window was 92.81. Over those roughly 29 days the rule produced 9 breakout signals, and 5 of the 9 had moved in the signal direction 6 bars (one day) later.
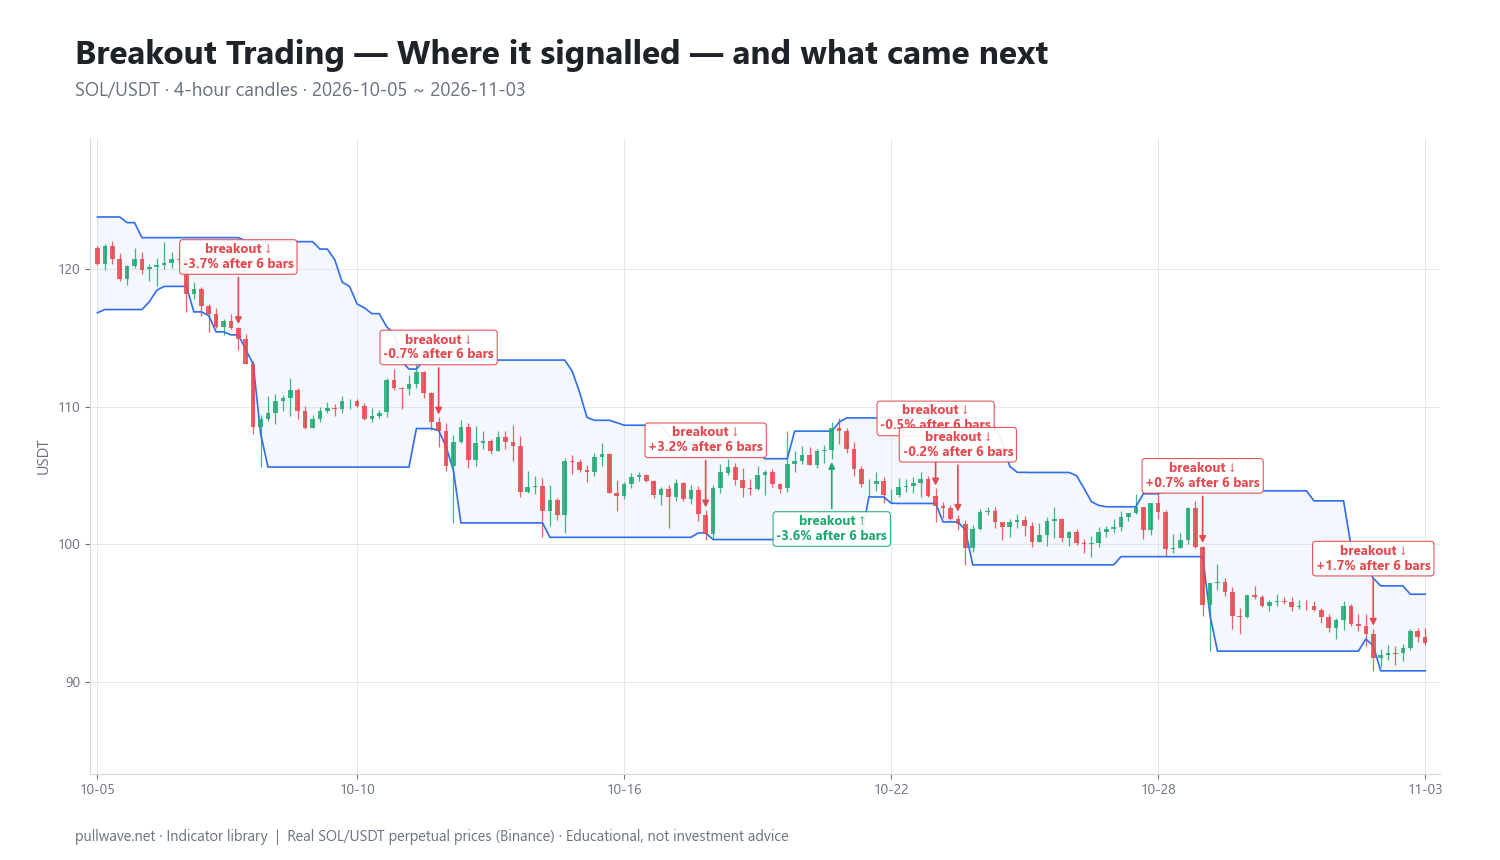
Figure 2 marks each signal on the same chart, with the percentage move 6 bars and 18 bars after the signal bar.
| Date (UTC) | Signal | Price | After 6 bars | After 18 bars |
|---|---|---|---|---|
| 2026-10-07 00:00 | breakout ↓ | 118.18 | −2.11% | −7.22% |
| 2026-10-08 04:00 | breakout ↓ | 114.90 | −3.72% | −4.85% |
| 2026-10-12 16:00 | breakout ↓ | 108.25 | −0.69% | −2.10% |
| 2026-10-18 16:00 | breakout ↓ | 100.78 | +3.19% | +7.41% |
| 2026-10-21 12:00 | breakout ↑ | 108.44 | −3.56% | −8.04% |
| 2026-10-23 20:00 | breakout ↓ | 102.79 | −0.45% | −1.83% |
| 2026-10-24 08:00 | breakout ↓ | 101.47 | −0.22% | −1.37% |
| 2026-10-29 20:00 | breakout ↓ | 95.62 | +0.71% | −1.16% |
| 2026-11-02 16:00 | breakout ↓ | 91.74 | +1.66% | +1.17% |
A few honest observations. Eight of the nine signals were downside breaks, which is what a mechanical channel does in a persistent decline — it keeps re-signalling in the direction of the drift. The early signals at 118.18 and 114.90 were the ones that paid on the longer horizon, at −7.22% and −4.85% after 18 bars. The three mid-window downside breaks at 102.79, 101.47 and 95.62 produced moves of −1.83%, −1.37% and −1.16% after 18 bars — directionally correct, but small enough that fees, funding and slippage would have consumed much of them on a leveraged perp.
The two clearest failures are instructive. The single upside breakout, at 108.44 on 21 October, was a counter-trend signal inside a downtrend and was −3.56% after 6 bars and −8.04% after 18 bars — the worst outcome in the sample. And the downside break at 100.78 on 18 October ran the other way, +3.19% after 6 bars and +7.41% after 18. Near the end of the window the final break at 91.74 also failed to extend (+1.66% after 6 bars).
So the scoreboard is mixed: 5 of 9 in the signal direction after 6 bars, and using the 18-bar column, 6 of 9. This is one indicator, one market, one 29-day window, and a downtrend that flattered a rule biased toward the prevailing direction. It demonstrates how the technique behaves — frequent signals, a handful of meaningful follow-throughs, several small losses and one painful counter-trend trade — not that the technique works. A different month, or a sideways month, would produce a different and probably worse picture.
Common mistakes
- Entering on the wick instead of the close. Intrabar pokes through a level happen constantly in perps. Requiring a close beyond the level removes a large share of noise at the cost of a slightly worse entry price.
- Ignoring the regime. Taking every breakout in a range is the single fastest way to lose money with this technique. If the last five break attempts all reversed, the market is telling you it is mean-reverting.
- Placing the stop immediately beyond the level. That is exactly where everyone else's stop sits. An ATR-based distance, or a level beyond the break candle's opposite extreme, survives routine overshoot better.
- Chasing an extended candle. A breakout bar that is three times the average range has already delivered part of the move. Entering at its high puts your invalidation far away and your reward close.
- Over-leveraging the attempt. Because breakouts fail often, position size has to assume failure. On perpetual futures, a 4x position with a stop beyond a volatile level can sit uncomfortably close to liquidation during a normal retest.
- No plan for re-entry. Trend-following breakout systems make most of their money on a small number of trades. Taking the first signal, losing, and refusing the second one removes the trades that would have paid.
Combining it with other tools
ATR is the natural partner: it sets the breakout buffer, the stop distance and the position size, and it tells you whether the market is in a contraction worth watching. A breakout with a stop placed at a fixed percentage is a breakout with an inconsistent risk profile.
Volume and, on perps, open interest give a read on participation. A break on rising volume with rising open interest suggests new positioning; a break on falling volume, or on rising open interest that immediately unwinds, often marks a liquidation flush rather than a trend start.
A higher-timeframe trend filter — a long moving average, or simply the direction of the daily channel — is the cheapest improvement available. In the SOL window above, that filter alone would have excluded the 21 October upside break that lost 8.04% over 18 bars.
Bollinger Band width or Keltner channels identify the compression phase that precedes the better breakouts, and horizontal support/resistance from higher timeframes tells you whether the level you are trading is meaningful to anyone else. Momentum tools such as RSI are best used here for context, not confirmation: a breakout into a long-standing momentum divergence deserves a smaller size, not a veto.
Frequently asked questions
Q. What is breakout trading in crypto?
Breakout trading in crypto means entering a long or short position when price closes beyond a defined level — a range top, a prior swing low, or the highest high of the last N bars — on the assumption that the move will continue. It is used on spot and on perpetual futures, and because crypto trades 24/7, breakout levels can be triggered at any hour, including low-liquidity periods when follow-through is less reliable.
Q. What is the best setting for a breakout strategy?
There is no single best setting. A 20-bar lookback is the most widely used default and traces back to the classic four-week rule and the Turtle system; 55 bars gives fewer, slower signals and 10 bars is often used for exits. Shorter lookbacks mean more trades and a higher failure rate, so the right choice depends on how many losing attempts you can tolerate between winners.
Q. Why do so many breakouts fail?
Most markets spend more time ranging than trending, and in a range every break of a level is, by definition, a false one. On top of that, stop and liquidation orders cluster just beyond obvious levels in perpetual futures, so price is frequently pushed through a level by forced orders and then pulled back once that flow is exhausted. Failure is a normal feature of the technique, which is why position sizing and invalidation matter more than signal quality.
Q. Should I enter on the breakout candle or wait for a retest?
Both are valid and they trade off differently. Entering on the breakout close captures every move but gives a worse average price and a wider stop; waiting for a retest gives a tighter invalidation and a better risk-reward but misses the strongest breakouts, which never come back. Many traders split the difference by taking part of the position on the close and adding on a retest that holds.
Q. How can I tell a real breakout from a fake one?
There is no reliable way to know in advance, only ways to tilt the odds: a close well beyond the level rather than a wick, an expanded candle range, above-average volume, alignment with the higher-timeframe trend, and a prior period of volatility contraction. The clearest evidence arrives afterward — if price closes back inside the level within a bar or two, treat the breakout as failed rather than hoping it recovers.
Q. Does breakout trading work better on higher timeframes?
Higher timeframes produce fewer signals with more participation behind each one, so the ratio of follow-through to noise is generally better on 4h and daily charts than on 5m or 15m. The trade-off is wider stops, larger per-trade risk in absolute terms, and long stretches with no setups. Lower timeframes can work for intraday range breakouts but demand stricter filters and tighter cost control.
Key takeaways
- A breakout is a close beyond a predefined level; the mechanical version uses the highest high or lowest low of the previous N bars, with 20 and 55 as the classic lengths.
- The logic rests on absorbed supply or demand plus volatility clustering — large moves tend to follow large moves — which is why trend followers from Donchian to the Turtles built systems around it.
- Regime decides everything: breakouts pay in expanding, directional markets and bleed steadily in ranges, so a higher-timeframe trend filter or volatility-contraction condition is usually worth more than tuning the lookback.
- In the 4h SOL/USDT window examined here, 9 signals produced 5 follow-throughs after 6 bars, with the single counter-trend upside break losing 8.04% over 18 bars — one illustration of a technique that relies on a few good trades, not a high hit rate.
- Because failure is built in, risk control — ATR-based stops away from obvious levels, conservative leverage on perps, and a plan to re-enter — is the part of breakout trading that actually determines the outcome.
Educational material. Charts use real SOL/USDT perpetual prices; past behaviour does not predict future results. Not investment advice.