Indicator & technique library · Trading techniques
Support and Resistance Explained: Levels, Zones, Uses
At a glance
- Support and resistance are price zones where previous buying or selling pressure was strong enough to stop or reverse a move.
- They are usually located from swing highs and lows, then grouped into zones whose width scales with volatility (for example a fraction of ATR).
- They are read as areas of probable reaction, not as walls: a level that has held many times can still break, and broken levels often flip roles.
- In a 4h SOL/USDT window, 6 of 8 pivot signals moved in the implied direction after 6 bars but only 4 of 8 after 18 bars.
Support and resistance is the oldest idea in technical analysis: price tends to pause, slow down, or turn around near areas where it has already done so before. Support is the zone below price where buying interest has previously been strong enough to stop a decline; resistance is the zone above price where selling has previously been strong enough to stop an advance.
Traders care about these zones because they turn a continuous, noisy price series into a small number of decision points. Whatever your method — trend following, mean reversion, or pure risk management — knowing where the market has reacted before gives you a place to measure risk from, a place to expect a reaction, and a level that tells you your read was wrong when it is cleanly broken.
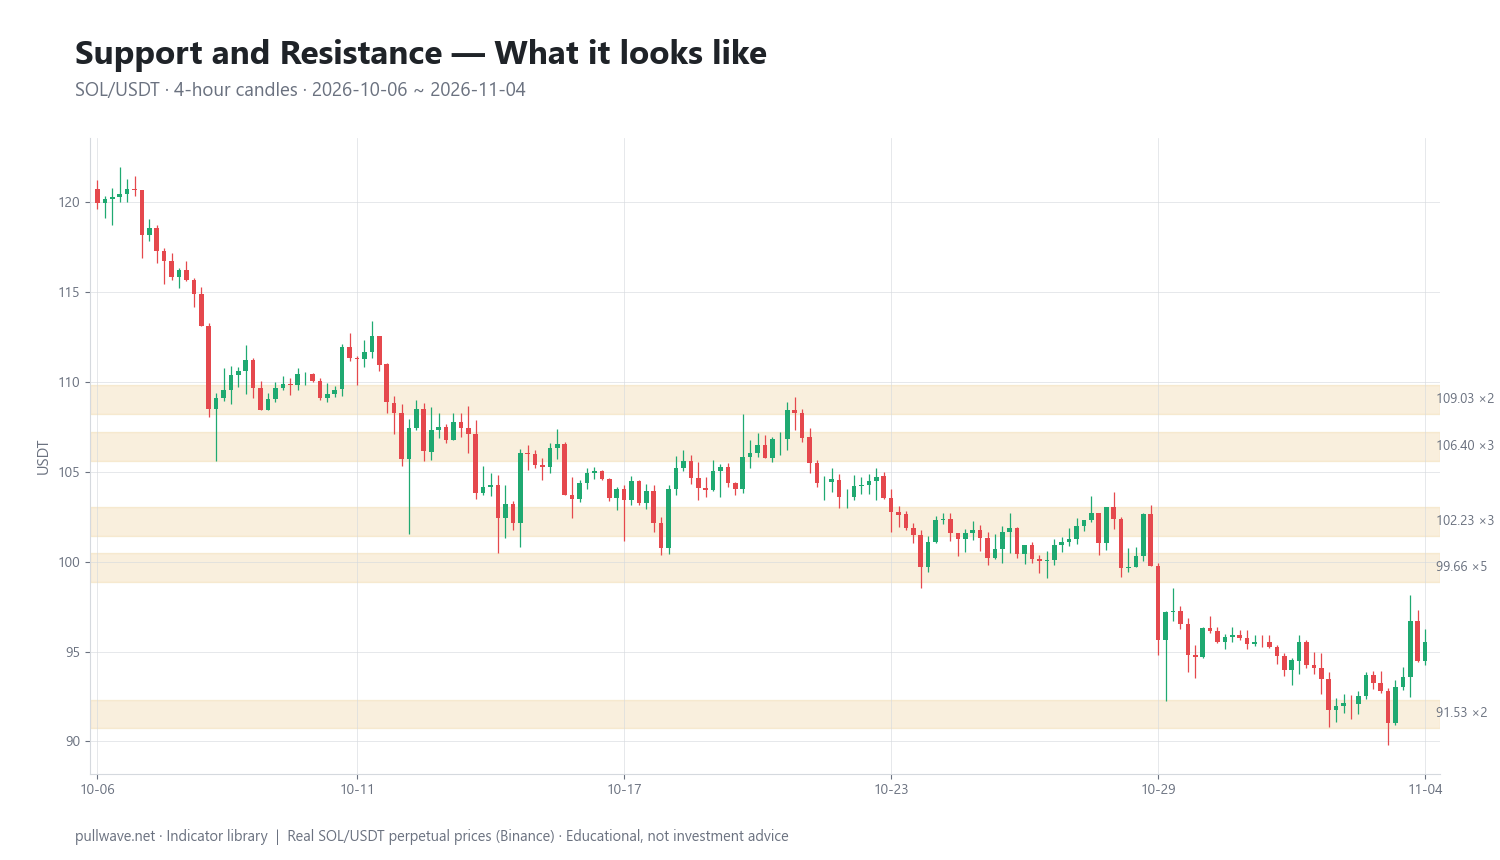
Figure 1 shows SOL/USDT perpetual 4h candles for the window used throughout this page, with the horizontal zones derived from swing highs and lows drawn across the chart. Notice how the zones are bands, not hairlines, and how price repeatedly stalls inside them rather than at one exact number.
What is Support and Resistance?
Support and resistance are horizontal (or sometimes sloping) price areas where the balance between buyers and sellers has visibly changed in the past. They are not an indicator with a single fixed formula; they are a technique, and different traders will produce slightly different levels from the same chart.
Three properties define a usable level:
- Location — the price area itself, almost always derived from prior swing highs, swing lows, or high-volume areas.
- Touches — how many separate times price has reacted there. More touches means more market participants are aware of it.
- Reaction size — how far price travelled away from the level after each touch. A level that produced 6% bounces matters more than one that produced 0.5% pauses.
A level that sits above current price is resistance; the same level, once price trades decisively above it, becomes a candidate support. This role reversal is called polarity, and it is one of the few genuinely reliable behaviours in the technique.
The idea behind it (theory and history)
The concept predates modern charting software by a century. Charles Dow's editorials in The Wall Street Journal around 1900–1902 already described the market moving in waves that stalled at previous turning points. Richard Schabacker set the ideas out systematically in Technical Analysis and Stock Market Profits (1932), and Robert D. Edwards and John Magee codified them for generations of traders in Technical Analysis of Stock Trends (1948), including the explicit principle that broken resistance tends to become support. Richard Wyckoff's work on supply and demand in the same era approaches the same phenomenon from the order-flow side.
The theory is behavioural, not mystical. Three groups of participants have memory at a price level: those who bought there and are in profit, those who bought there and are in loss, and those who wanted to transact there and missed. When price returns, the first group may take profit, the second group may exit at breakeven, and the third group finally gets its fill. All three actions push in the same direction, which is why the reaction repeats.
There is a second, more mechanical reason, and it is especially relevant in crypto. Stop orders, limit orders and — on perpetual futures — liquidation prices cluster around obvious levels. That clustering creates real resting liquidity, which can absorb a move, and it also creates a pool of orders that a strong move can trigger in sequence. Levels therefore both attract price and, once breached, accelerate it.
How it is calculated
There is no single official formula, but a reproducible, mechanical version looks like this:
- Choose a timeframe and lookback window. The levels you get from 200 bars of 4h data are different from those on a daily chart. Pick one and stay consistent.
- Find swing pivots. A bar is a swing high if its high is the highest of the N bars to its left and the N bars to its right. A swing low is the mirror image using lows.
- Measure current volatility. Average True Range over 14 periods (ATR14) gives a price-unit measure of how much the market normally moves in one bar.
- Cluster nearby pivots. Pivots whose prices fall within a tolerance — commonly a fraction of ATR14 — are treated as touches of the same level rather than separate levels.
- Define the zone. Take the average (or the median) of the pivots in a cluster as the centre, and give it a width, again scaled to volatility.
- Score and filter. Count touches, note the size of the reaction after each touch and how recent they are, then keep only the strongest handful above and below current price.
``` swing high at bar i if High[i] = max(High[i-N .. i+N]) swing low at bar i if Low[i] = min(Low[i-N .. i+N])
cluster pivots where |price_a - price_b| < k * ATR14 level = mean(prices in cluster) zone = level ± (zone_width / 2) touches = count(pivots in cluster) ```
The settings used for the SOL example below were N = 6 bars each side, clustering tolerance k = 0.8 × ATR14, and a resulting zone width of about 1.6 USDT — roughly 1.6% of price with SOL near 100.
A common rule-based alternative is the classic floor-trader pivot, which derives levels arithmetically from the previous period's range instead of from pivots:
P  = (High + Low + Close) / 3
R1 = 2P - Low        S1 = 2P - High
R2 = P + (High - Low)  S2 = P - (High - Low)
Default settings and variations
| Setting | Typical value | Why it exists |
|---|---|---|
| Pivot lookback N | 5–6 bars each side | Filters single-bar noise; on 4h data, 6 bars is about one day of context on each side |
| Clustering tolerance | 0.5–1.0 × ATR14 | Makes "same level" mean the same thing in calm and volatile regimes |
| Zone width | ~0.3–0.5 × ATR14 | Prices rarely turn at an exact number; the band absorbs wicks and exchange differences |
| Minimum touches | 2–3 | One pivot is a point, not a level; two or more show repetition |
| Lookback window | 100–300 bars | Enough history to find repeats, recent enough to stay relevant |
Variations worth knowing: prior period extremes (previous day's or week's high and low, popular in 24/7 markets precisely because they are unambiguous), round numbers ($100, $1,000, $50,000 — psychologically sticky and heavily used for limit orders), volume-based levels such as volume profile value areas and high-volume nodes, and dynamic support/resistance from moving averages, VWAP or trendlines, which move with price instead of staying horizontal.
How to read it
Read a level as an area of increased probability of reaction, not as a barrier. Price entering a zone means the odds of a pause, a wick, or a reversal are higher than at a random price — nothing more.
- Zone, not line. If the market turns 0.4% away from your line, your line was still right. That is why widths are scaled to ATR.
- Wicks versus closes. A wick through a zone that closes back inside shows the level absorbed the move. Several consecutive closes beyond it is a different message.
- Reaction quality. Sharp, high-volume rejections suggest resting liquidity. Slow grinding into a level, with smaller and smaller bounces, often precedes a break.
- Context above everything. Resistance in a strong uptrend gets eaten more often than it holds. Support in a downtrend is where sellers reload. The same zone behaves differently depending on the regime.
- More touches is not strictly better. Each test consumes resting orders. A level with five touches is widely watched, but the supply that defended it is thinner than it was at touch one.
How traders use it
1. Range fading. When price oscillates between a defined support zone and a defined resistance zone, some traders work with reactions at the edges and treat the opposite edge as the natural objective. Works in balanced, low-trend conditions where the range has already produced at least two clean rotations. Fails badly when a range resolves — the last fade before a breakout is usually the one with the worst outcome, which is why the invalidation point and position size matter more than the entry.
2. Breakout and retest. Instead of acting on the first close beyond a level, many traders wait to see whether the broken level is defended from the other side (polarity). Works when volatility is expanding and the break has participation behind it. Fails in chop, where price slices through a level, retests it, and then slices back — the classic fakeout. It also costs you the moves that never retest.
3. Risk framing. Even traders who never enter at a level use them to place invalidation and to set realistic objectives. Putting a stop just beyond the far side of a zone rather than inside it acknowledges that the zone has width. Works universally as a discipline. Fails as a crutch when the resulting distance is so large that the position must be sized down beyond usefulness — in which case the trade idea, not the level, is the problem.
4. Level-to-level mapping. Before the session, mark the two or three nearest zones above and below. This turns reactive screen-watching into a plan: you know in advance which areas deserve attention. Works in every regime as preparation. Fails if the map is never updated — in fast crypto markets, levels from six months ago may be irrelevant while yesterday's high is not.
Example on a real SOL chart
The window is SOL/USDT perpetual on Binance, 4h candles, from 2026-10-06 to 2026-11-04, with the last close in the window at 95.55. Pivots were detected with 6 bars on each side and grouped within 0.8 × ATR14, producing zones about 1.6 wide.
| Level | Touches |
|---|---|
| 99.66 | 5 |
| 102.23 | 3 |
| 106.40 | 3 |
| 91.54 | 2 |
| 109.04 | 2 |
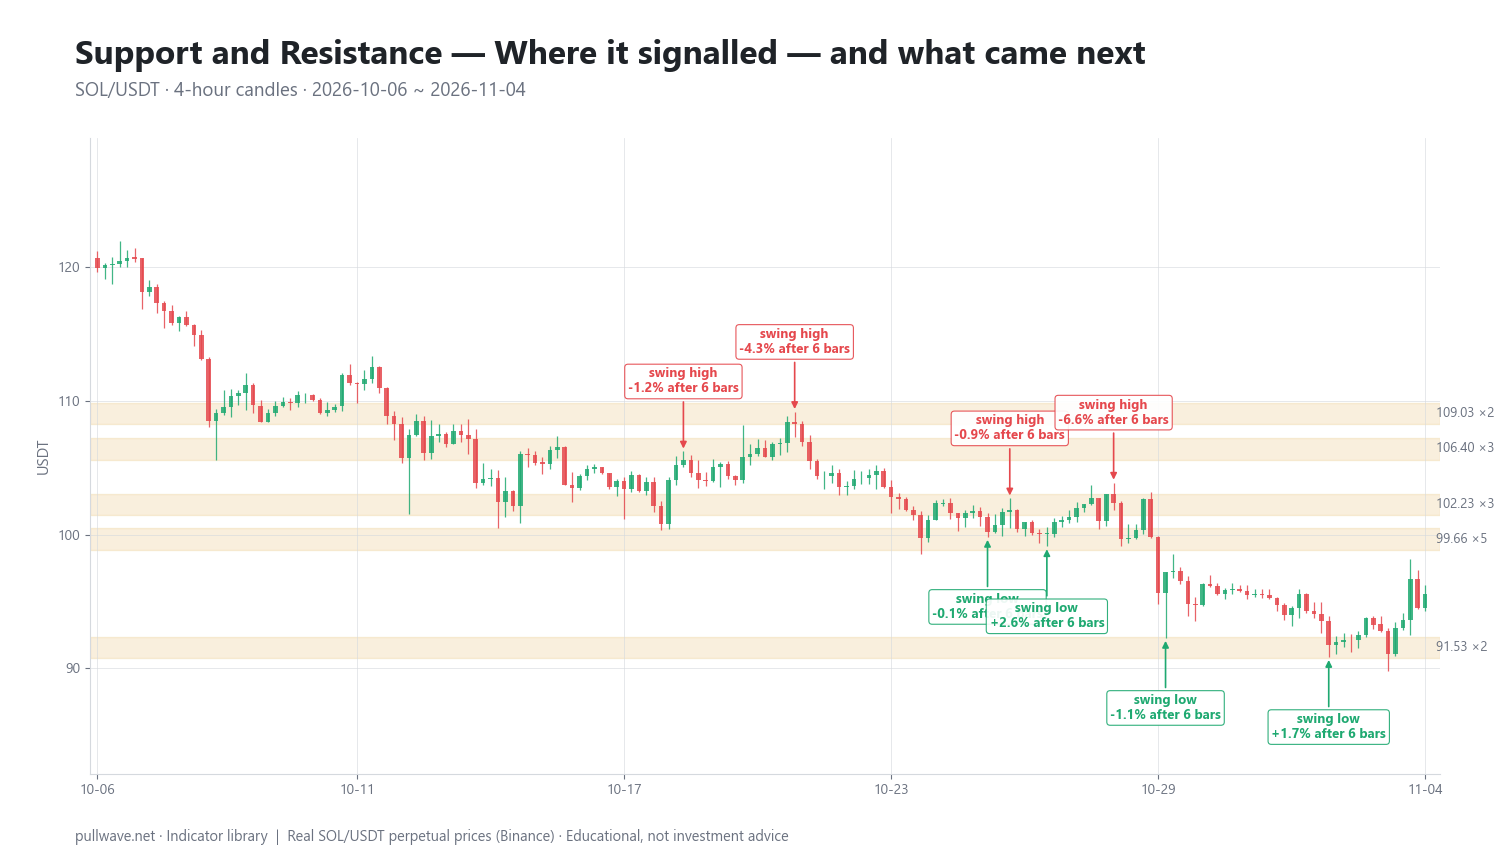
Figure 2 marks each of the eight pivot events inside the window and the percentage price change 6 bars (one day) and 18 bars (three days) later.
| Date (UTC) | Type | Price | After 6 bars | After 18 bars |
|---|---|---|---|---|
| 2026-10-19 04:00 | swing high | 105.61 | −1.17% | −1.16% |
| 2026-10-21 16:00 | swing high | 108.25 | −4.31% | −6.60% |
| 2026-10-26 12:00 | swing high | 101.86 | −0.92% | +0.79% |
| 2026-10-28 20:00 | swing high | 102.38 | −6.60% | −6.78% |
| 2026-10-26 00:00 | swing low | 100.18 | −0.05% | −0.54% |
| 2026-10-27 08:00 | swing low | 100.08 | +2.63% | −3.55% |
| 2026-10-30 00:00 | swing low | 97.19 | −1.06% | −1.70% |
| 2026-11-02 16:00 | swing low | 91.74 | +1.66% | +4.15% |
Counting a swing high as implying lower prices and a swing low as implying higher prices, 6 of the 8 events moved in the implied direction after 6 bars. After 18 bars only 4 of 8 did. That decay is the honest headline: the short-term reaction was more consistent than the three-day follow-through.
The resistance side behaved better than the support side here. All four swing highs — 105.61 and 108.25 inside the 106.40/109.04 cluster, then 101.86 and 102.38 inside the 102.23 zone — were followed by lower prices one day later, twice by more than 4%. The support side was mixed: the two swing lows at 100.18 and 100.08, both sitting on the five-touch 99.66 zone, produced almost nothing (−0.05% and +2.63% after a day, both negative after three days).
That is the most instructive detail in the window. The most-touched level, 99.66, is the one that ultimately failed. Price worked down to a swing low at 91.74 — right on the two-touch 91.54 zone — bounced +1.66% after a day and +4.15% after three, and the window ended at 95.55, below the zone that had held five times. The level with the longest history was not the one that held; the newer, less-tested one produced the better reaction.
Treat this as one illustration on one market over one month, with eight events. It is not evidence that the technique works, and the mixed 18-bar column should be read as a reminder that reactions at levels fade quickly when the broader trend is pointing the other way.
Common mistakes
- Drawing too many levels. If every candle wick has a line under it, nothing is a level. Three to five zones per timeframe is usually plenty.
- Using hairlines instead of zones. Exchanges print different wicks, and perpetual prices differ from spot. A band that scales with ATR avoids being "wrong" by 0.3%.
- Hindsight drawing. It is trivially easy to find levels that explain the past. Mark your zones before the move and leave them alone.
- Ignoring the regime. Fading resistance in a strong, high-volume uptrend is fighting the dominant flow. The level is the same; the context is not.
- Assuming many touches means unbreakable. As the SOL window showed, the five-touch zone was the one that gave way.
- Putting stops at the obvious price. Resting stops just beyond a widely watched level are exactly the liquidity that fast moves are drawn to. Account for the zone's width and for wick risk.
- Confusing a pause with a reversal. Many level reactions are a few bars of consolidation, not a turn. Decide in advance which one you are trying to use.
Combining it with other tools
Support and resistance is a location tool. It tells you where, and it works best paired with something that tells you whether and when.
- Trend structure and moving averages. Market structure (sequences of higher highs and higher lows, or the reverse) and a long moving average tell you which side of the level the odds favour. Resistance in an uptrend and support in a downtrend are the weaker cases.
- Momentum oscillators. RSI or MACD divergence appearing as price tests a known zone adds a second, independent reason to expect a reaction. Momentum readings alone, away from a level, are much weaker.
- Volume and volume profile. High-volume nodes often coincide with pivot-derived zones; agreement between the two is meaningful confluence. A breakout on notably thin volume deserves scepticism.
- ATR. Use it both to size the zone and to size the stop distance, so that your risk reflects current volatility rather than a fixed percentage.
- Fibonacci retracements and prior-period extremes. Where a retracement level, a prior week's high and a pivot cluster all land in the same 1% band, you have a zone a large number of participants are watching.
In crypto specifically, add the market-structure realities: 24/7 trading means there is no session close to anchor levels, so UTC daily boundaries are a convention rather than a fact; weekend liquidity is thinner and wicks through levels are more common; and on perpetual futures, leverage concentrates liquidation prices near round numbers and obvious swing points, which is one reason breaks can be violent and short-lived.
Frequently asked questions
Q. What is the difference between support and resistance?
Support is a price area below the current market where buying has previously been strong enough to stop a decline; resistance is an area above the market where selling has previously stopped an advance. They are the same phenomenon viewed from opposite sides, and a given zone switches role depending on whether price is trading above or below it.
Q. How many touches does it take to make a level valid?
Two touches define a level and three or more make it widely watched, but touch count alone is a weak measure of strength. Each test consumes the resting orders that defended the level, so a heavily tested zone can be more fragile than it looks — in the SOL window above, the five-touch zone at 99.66 was the one that eventually broke.
Q. Should support and resistance be drawn as lines or zones?
Zones. Price rarely reverses at an exact number, exchanges print slightly different wicks, and perpetual futures prices differ from spot. A practical approach is to centre the zone on the average of the clustered pivots and give it a width tied to volatility, for example a fraction of ATR14.
Q. What timeframe is best for support and resistance in crypto?
Higher timeframes produce fewer and more durable levels: daily and 4h zones are watched by far more participants than 5-minute ones. A common workflow is to map zones on the daily and 4h charts and then use a lower timeframe only to observe how price behaves once it reaches them.
Q. Why does broken support become resistance?
Because the participants who bought in that area are now in loss and many will exit if price returns to their entry, while those who sold the break will defend it. This role reversal, often called polarity, was described explicitly in Edwards and Magee's 1948 classic and remains one of the most repeatable behaviours around levels.
Q. Do round numbers really act as support and resistance in crypto?
They frequently do, because limit orders, take-profits and stop orders cluster at round figures such as $100 or $50,000. The effect is a self-fulfilling consequence of order placement rather than a property of price itself, and it is strongest when a round number coincides with a pivot-derived zone.
Key takeaways
- Support and resistance are zones where prior buying or selling pressure changed the balance of the market; they mark probable reaction areas, never guaranteed barriers.
- A reproducible method is to find swing pivots with a fixed lookback on each side, cluster them within a volatility-scaled tolerance such as 0.8 × ATR14, and draw a band rather than a line.
- Regime decides behaviour: levels against the dominant trend break far more often than levels with it, so the technique needs a trend or momentum filter alongside it.
- In the 4h SOL/USDT example, 6 of 8 pivot events moved in the implied direction after 6 bars but only 4 of 8 after 18 bars, and the most-touched zone was the one that failed — a single small sample, not proof of anything.
- The most durable use of levels is risk framing: knowing in advance where your idea is invalidated, and sizing so that a wick through a crowded zone is survivable.
Educational material. Charts use real SOL/USDT perpetual prices; past behaviour does not predict future results. Not investment advice.