Indicator & technique library · Trading techniques
Range Trading Explained: Rules, Setups and Limits
At a glance
- Range trading treats price as oscillating between a horizontal ceiling and floor instead of trending in one direction.
- A range can be defined mechanically as the highest high and lowest low of the previous N bars, typically 20.
- Traders either fade the edges inside the range or wait for the range to break and extend.
- In a 4-hour SOL/USDT sample of 10 channel breakouts, only 5 moved in the signal direction six bars later — a reminder that ranges produce many false breaks.
Most of the time a market is not going anywhere in particular. Price pushes up, runs into sellers, falls back, finds buyers, and repeats. Range trading is the set of techniques built around that behavior: instead of asking "which way is the trend?", you ask "where are the boundaries, and what happens when price reaches them?"
It matters for crypto traders because sideways conditions dominate the calendar even in markets famous for violent trends. The same breakout that pays in a trending phase gets chopped to pieces inside a range, so being able to recognize and measure a range is as much a risk-management skill as a strategy.
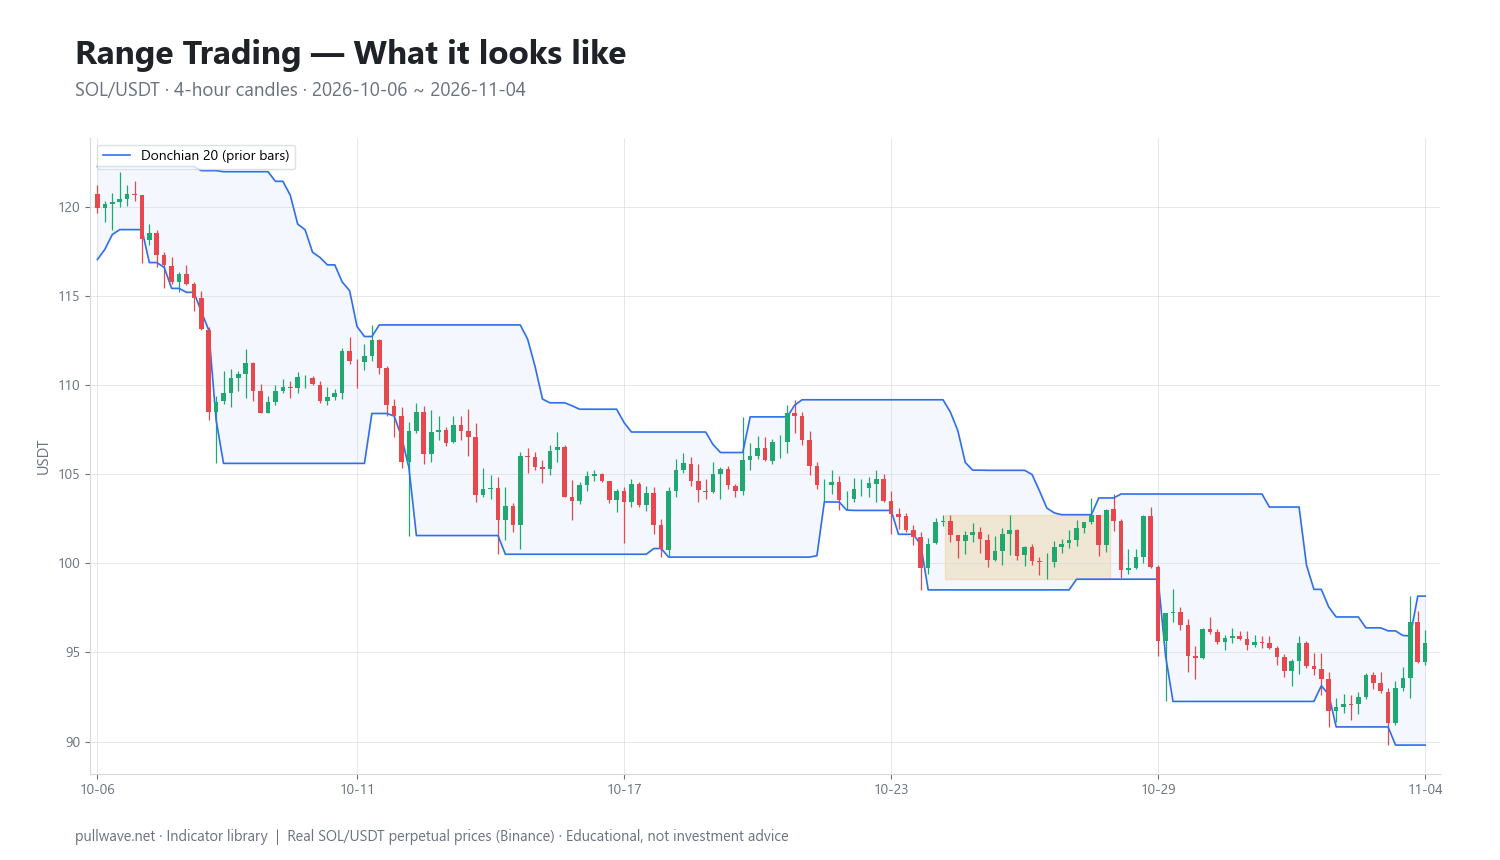
Figure 1 shows the technique applied to real SOL/USDT 4-hour candles: a rolling 20-bar channel drawn from the highest high and lowest low of the previous bars, with the midline between them. When the channel is flat and narrow, the market is ranging; when it steps down or up persistently, it is trending.
What is Range Trading?
Range trading is trading a market that is moving sideways between a horizontal resistance level (the range top) and a horizontal support level (the range bottom). The core assumption is mean reversion: inside a range, moves away from the middle tend to be reversed rather than extended.
There are two families of range techniques, and they are mirror images of each other:
- Fading the edges. Treat the top and bottom as zones where the move is likely to stall, and work with the expectation that price returns toward the middle. This pays while the range holds and loses when it finally breaks.
- Trading the break. Treat the range as compression before expansion, and act when price closes outside the boundary. This pays when the range resolves into a trend and loses every time the break fails.
Both are "range trading." What separates good execution from bad is knowing which regime you are in — and accepting that you only know for certain after the fact.
The idea behind it (theory and history)
The concept is older than indicators. Charles Dow's writings at the turn of the 20th century described markets alternating between directional movement and "lines" — narrow horizontal stretches that later resolve into a move. Richard Wyckoff, working in the same era, formalized this into accumulation and distribution ranges, where large participants build or unload positions sideways before the market trends.
In the 1960s Nicolas Darvas popularized the idea of a price "box" in his book How I Made $2,000,000 in the Stock Market: price oscillating inside a defined high-low box until it escapes into the next box. Around the same period, futures trader Richard Donchian built the mechanical version that most charting platforms still carry — a channel formed by the highest high and lowest low of the last N periods. The Donchian channel is simultaneously a range definition and a breakout trigger, which is why it suits both styles described above.
Mechanical channel breakouts became widely known through the Turtle trading experiment run by Richard Dennis and William Eckhardt starting in 1983, which used 20-period and 55-period breakout rules on futures. On the compression side, Toby Crabel's 1990 book Day Trading with Short Term Price Patterns and Opening Range Breakout studied narrow-range days and the expansion that often follows them. The theory behind all of it is the same: volatility is not constant, it clusters, and quiet periods and active periods tend to alternate.
How it is calculated
A range can be drawn by hand from obvious swing highs and lows, but a rule-based definition is reproducible and testable. The standard one is the Donchian-style channel. Using the previous N bars (excluding the current bar) keeps the boundary fixed while the current candle forms, so a signal cannot repaint.
Step by step:
- Choose a lookback N — 20 bars is the common default.
- For the current bar, find the highest high of the previous N bars. That is the range top.
- Find the lowest low of the previous N bars. That is the range bottom.
- The midline is the average of the two. It acts as the equilibrium level inside the range.
- Measure range width as a percentage so you can compare different periods and different coins.
- A breakout is recorded when the current bar closes outside the channel.
``` upper[i] = highest( high, bars i-N ... i-1 ) # N = 20 lower[i] = lowest( low, bars i-N ... i-1 ) mid[i] = ( upper[i] + lower[i] ) / 2 width%[i] = ( upper[i] - lower[i] ) / lower[i] * 100
breakout up : close[i] > upper[i] breakout down : close[i] < lower[i] ```
Note what this does not do: it has no memory of how many times each boundary was tested, and it does not care whether the channel is flat or sloping. Those judgments stay with the trader.
Default settings and variations
Twenty bars is the inherited default. On daily charts it approximates one trading month of stock-market history, which is where the convention comes from; on a 4-hour crypto chart it covers a little over three days of continuous trading. The number is a compromise — long enough that single spikes do not define the range, short enough to adapt within a few days.
| Setting | Lookback | Behavior | Typical use |
|---|---|---|---|
| Fast | 10 bars | Narrow channel, frequent breaks | Short-term boundaries, exits |
| Standard | 20 bars | Balanced | General range definition |
| Slow | 55 bars | Wide channel, rare breaks | Major structural ranges |
| Width filter | any | Only act when width% is below a threshold | Identifying compression |
Common variations:
- Close-based channels. Use highest/lowest close instead of high/low. Fewer signals, since wicks no longer set the boundary — useful in crypto where liquidation cascades print long wicks.
- Volatility-normalized ranges. Express width in ATR units rather than percent, so a 3% range in a calm month is not confused with a 3% range in a violent one.
- Hand-drawn horizontal levels. Many discretionary traders prefer boundaries anchored to repeatedly tested highs and lows, which often matter more to other participants than a rolling calculation.
- Session ranges. Crypto never closes, so there is no true opening range; traders substitute a fixed UTC window, or the Asia-hours high/low, as the reference range for the rest of the day.
How to read it
Read three things, in this order: shape, width, and location.
Shape. A flat upper and lower boundary means a genuine range. If the channel is stepping down bar after bar — new lows but no new highs — you are reading a downtrend through a range tool, and fading the lower edge is fighting a trend.
Width. Narrow width means compression. Volatility clusters, so a historically tight channel tends to be followed by expansion, though the tool says nothing about direction. Wide width means the market has already moved and the edges are far apart, which makes mean-reversion setups larger in risk terms.
Location. Price near the midline is the least informative state. Price pressed against a boundary for several bars without breaking it shows absorption; price snapping back into the range immediately after a break is the classic false break, often the most tradeable range event.
How traders use it
1. Fading the boundaries. Work with reversion from the edges back toward the midline. When it works: mature ranges with multiple tested touches, low and stable width, no strong higher-timeframe trend. When it fails: the first day of a new range, and any range that is actually a pause inside a trend — the boundary in the trend's direction tends to give way.
2. Trading the breakout. Act on closes outside the channel, expecting expansion. When it works: after sustained compression, and when the break occurs in the direction of the higher-timeframe trend. When it fails: inside wide, choppy ranges where boundaries are set by old wicks, and around scheduled macro events that spike price and then reverse it.
3. Trading the failed break. Wait for a break that closes back inside the range within a bar or two and treat the reclaim as the signal. When it works: in ranges with heavy stop clusters just outside the edges — common in crypto, where liquidation levels are visible and crowded. When it fails: when the "failure" is just a pause and the market breaks again, which is exactly what happens at the start of real trends.
4. Regime filtering rather than entry. Use range width to decide which of your other tools to trust. Oscillator signals carry more information inside a flat range; moving-average and momentum signals carry more information once width expands. This is often the most durable use of the technique, because it never requires predicting direction.
Example on a real SOL chart
The window below is SOL/USDT perpetual futures (Binance data) on the 4-hour timeframe, from 2026-10-06 to 2026-11-04, with the range defined as the 20-bar highest high and lowest low of the previous bars. The last close in the window was 95.55. This is one market over one month — an illustration of how the signals behave, not evidence that the method works.
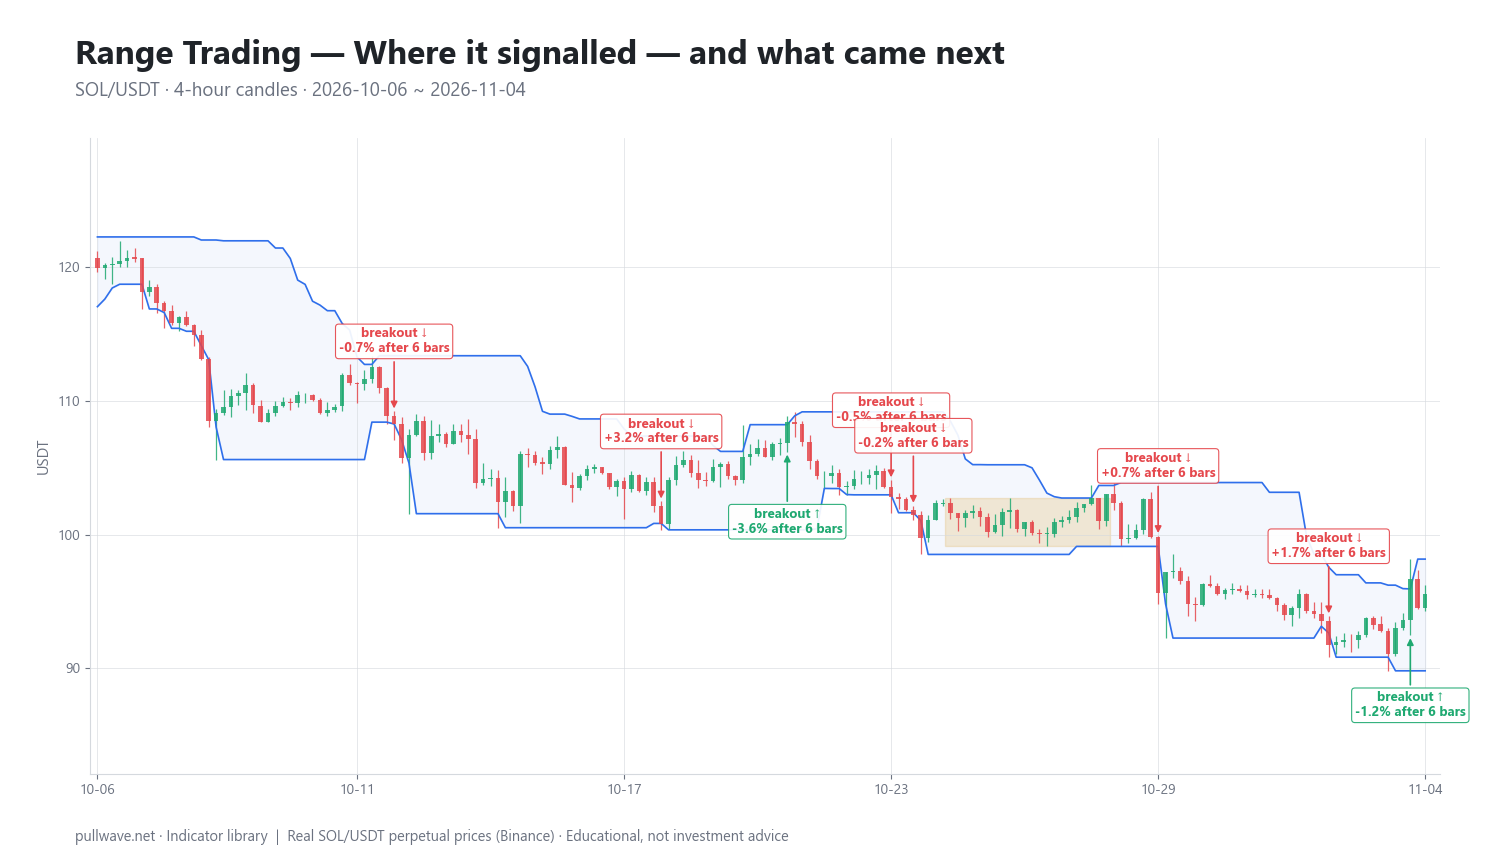
Figure 2 marks each of the 10 channel breakouts and the percentage move 6 bars (one day) and 18 bars (three days) later.
| Date (UTC) | Signal | Price | After 6 bars | After 18 bars |
|---|---|---|---|---|
| 2026-10-07 00:00 | breakout ↓ | 118.18 | −2.11% | −7.22% |
| 2026-10-08 04:00 | breakout ↓ | 114.90 | −3.72% | −4.85% |
| 2026-10-12 16:00 | breakout ↓ | 108.25 | −0.69% | −2.10% |
| 2026-10-18 16:00 | breakout ↓ | 100.78 | +3.19% | +7.41% |
| 2026-10-21 12:00 | breakout ↑ | 108.44 | −3.56% | −8.04% |
| 2026-10-23 20:00 | breakout ↓ | 102.79 | −0.45% | −1.83% |
| 2026-10-24 08:00 | breakout ↓ | 101.47 | −0.22% | −1.37% |
| 2026-10-29 20:00 | breakout ↓ | 95.62 | +0.71% | −1.16% |
| 2026-11-02 16:00 | breakout ↓ | 91.74 | +1.66% | +4.15% |
| 2026-11-04 12:00 | breakout ↑ | 96.69 | −1.18% | −1.18% |
Of the 10 breakouts, 5 moved in the signal direction six bars later — a coin flip, and the honest summary of this sample. Eight of the ten signals were downside breaks, which tells you the window was not a balanced range at all: price worked from roughly 118 down to the mid-90s.
The pattern inside the sample is instructive. The three early downside breaks, while the market was still stepping lower, all continued down after six bars and extended further after 18 (−7.22% and −4.85% on the first two). The later signals clustered around a flattening market and mostly failed or produced noise — −0.22% and −0.45% are not follow-through in any meaningful sense, they are rounding error against 4-hour volatility. Both upside breaks failed within a day, which is typical of counter-trend breaks during a decline.
The narrowest range in the window ended on 2026-10-28, spanning just 3.5% between a top of 102.73 and a bottom of 99.11. Compression did lead to expansion — price broke down the next day at 95.62 — but the break itself did not pay on a six-bar horizon (+0.71%, i.e. an immediate bounce) and was only mildly negative after 18 bars (−1.16%). A tight range reliably signals that something is coming; it does not tell you the direction, and it does not guarantee a clean move.
Common mistakes
- Calling a trend a range. If the channel's boundaries are drifting in one direction, the market is trending. The SOL window above is the textbook case: a rolling channel will happily draw "ranges" all the way down.
- Using wick extremes as hard levels. A single liquidation spike can set the boundary for the next 20 bars. Close-based channels or zones rather than lines reduce this.
- Ignoring range width in risk sizing. A 3.5% range and a 15% range need very different position sizes for the same account risk. On leveraged perpetuals, a boundary that is 2% away can be inside normal noise.
- Trading every breakout in a wide range. Most will be noise. Filtering by compression, higher-timeframe direction, or volume concentrates the attempts.
- Forgetting funding and 24/7 drift. Holding a mean-reversion position on a perpetual across several funding periods adds a cost that a few-tenths-of-a-percent edge cannot absorb.
- Assuming a range must break your way because it is "overdue." Ranges can persist far longer than expected, and compression can resolve by widening slowly rather than snapping.
Combining it with other tools
Range techniques answer "where," not "how strongly." The natural companions are regime and momentum tools.
- ADX (Welles Wilder, New Concepts in Technical Trading Systems, 1978) is explicitly a trend-strength measure. Low readings support treating boundaries as reversion zones; rising readings argue for the breakout interpretation.
- Bollinger Bands (developed by John Bollinger in the early 1980s) measure width directly through standard deviation; the "squeeze" is the same compression idea expressed in volatility terms.
- ATR normalizes range width across assets and periods, and gives a volatility-aware basis for stop distance outside the boundary rather than a fixed percentage.
- RSI or stochastics add context at the edges: a boundary test with weakening momentum reads differently from one made on an impulsive candle.
- Volume and open interest. In crypto, a break accompanied by a jump in volume and rising open interest suggests new positioning; a break on thin volume with falling open interest often reflects stop runs and tends to be reclaimed.
Higher-timeframe structure outranks all of them. A 4-hour range sitting inside a daily downtrend is not a neutral market, and treating it as one is the most common way range techniques lose money.
Frequently asked questions
Q. What is range trading in simple terms?
Range trading means trading a market that is moving sideways between a ceiling (resistance) and a floor (support) rather than trending. Traders either work with reversals at the boundaries back toward the middle, or wait for price to close outside the range and treat that as the start of a new move. The technique depends entirely on correctly identifying that a range exists.
Q. What is the best timeframe for range trading crypto?
There is no single best timeframe; the choice determines how many signals you see and how much noise comes with them. Many traders define the range on a higher timeframe such as the 4-hour or daily chart and look for entries one timeframe lower. Because crypto trades 24/7, shorter intraday ranges often reflect low-liquidity hours rather than genuine two-sided interest.
Q. How do I know when a range is about to break?
You cannot know, but compression raises the odds that expansion is near. A range that is historically narrow — measured as percentage width or in ATR units — tends to be followed by a larger move, without indicating direction. In the SOL example above, the narrowest range of the window (3.5% wide, 99.11 to 102.73) did resolve into a break the next day, yet the move was small and initially went against the break.
Q. What is the difference between range trading and breakout trading?
They use the same boundaries with opposite assumptions. Range trading assumes the boundary holds and price reverts; breakout trading assumes the boundary gives way and the move extends. Over a long enough sample each one wins in the regime where the other loses, which is why regime identification matters more than the entry rule.
Q. Why do so many range breakouts fail?
Boundaries are where stop orders and liquidation levels cluster, so price is frequently pushed just beyond them and then pulled back. In the 4-hour SOL sample, only 5 of 10 channel breakouts had moved in the signal direction six bars later. A low hit rate is normal for breakout methods; the arithmetic only works if the follow-through moves are much larger than the failed ones.
Q. Is range trading safe with leverage?
Leverage does not change the technique, but it changes the consequences of being wrong. Mean-reversion setups near a boundary can look low-risk and then face a sustained break, and on perpetual futures a liquidation price sitting just outside the range can be reached by a single wick. Position size should be derived from the distance to your invalidation level and the market's current volatility, not from the leverage the venue allows.
Key takeaways
- Range trading defines a market by its horizontal boundaries; the mechanical version is the highest high and lowest low of the previous N bars, usually 20.
- The same channel supports two opposite methods — fading the edges and trading the break — and each one only works in the regime where the other fails.
- Range width is the most useful read: compression signals that expansion is likely, but never tells you the direction.
- In the 4-hour SOL/USDT window from 2026-10-06 to 2026-11-04, 10 breakouts produced 5 follow-throughs after six bars, with the early breaks in the ongoing decline working best and both upside breaks failing — one small, mixed sample, not proof of anything.
- Treat range tools as context for sizing and for interpreting other indicators, and respect the higher timeframe before assuming a sideways chart is really a range.
Educational material. Charts use real SOL/USDT perpetual prices; past behaviour does not predict future results. Not investment advice.