Indicator & technique library · Trading techniques
RSI Divergence Explained: Signals, Rules and Limits
At a glance
- RSI divergence occurs when price makes a new swing high or low that the 14-period RSI does not confirm.
- Regular divergence hints at trend exhaustion; hidden divergence hints at trend continuation after a pullback.
- It is a context tool, not a timing trigger — in strong trends divergence can repeat several times before anything changes.
- In a sample of three bullish divergences on SOL/USDT 4h in October 2026, two were followed by gains six bars later but all three were lower eighteen bars later.
RSI divergence is the disagreement between price and the Relative Strength Index. Price pushes to a new swing low, but RSI's matching low is higher; or price prints a new swing high while RSI's high is lower. The move is still happening, but the momentum behind it is measurably smaller than it was at the previous swing.
Traders care because divergence is one of the few widely used ways to measure deterioration inside a move that still looks intact on the price chart alone. It is also one of the most abused signals in retail trading: in a strong trend the same divergence can appear three or four times while price keeps going, which is why the rest of this page spends as much time on failure conditions as on setups.
What is RSI Divergence?
RSI divergence is a comparison between two swing points on the price chart and the two matching swing points on the RSI line. If the price swings and the RSI swings point in opposite directions, you have divergence. If they point the same way, price and momentum are in agreement and there is nothing to read.
There are four named variants, split into two families:
| Type | Price | RSI | Usual reading |
|---|---|---|---|
| Regular bullish | Lower low | Higher low | Downside momentum fading; possible bottom |
| Regular bearish | Higher high | Lower high | Upside momentum fading; possible top |
| Hidden bullish | Higher low | Lower low | Pullback inside an uptrend; continuation bias |
| Hidden bearish | Lower high | Higher high | Bounce inside a downtrend; continuation bias |
Regular (also called classic) divergence is a reversal argument. Hidden divergence is a continuation argument and only makes sense when you have already identified a trend. Both use exactly the same measurement — only the direction of the price swing relative to the RSI swing changes.
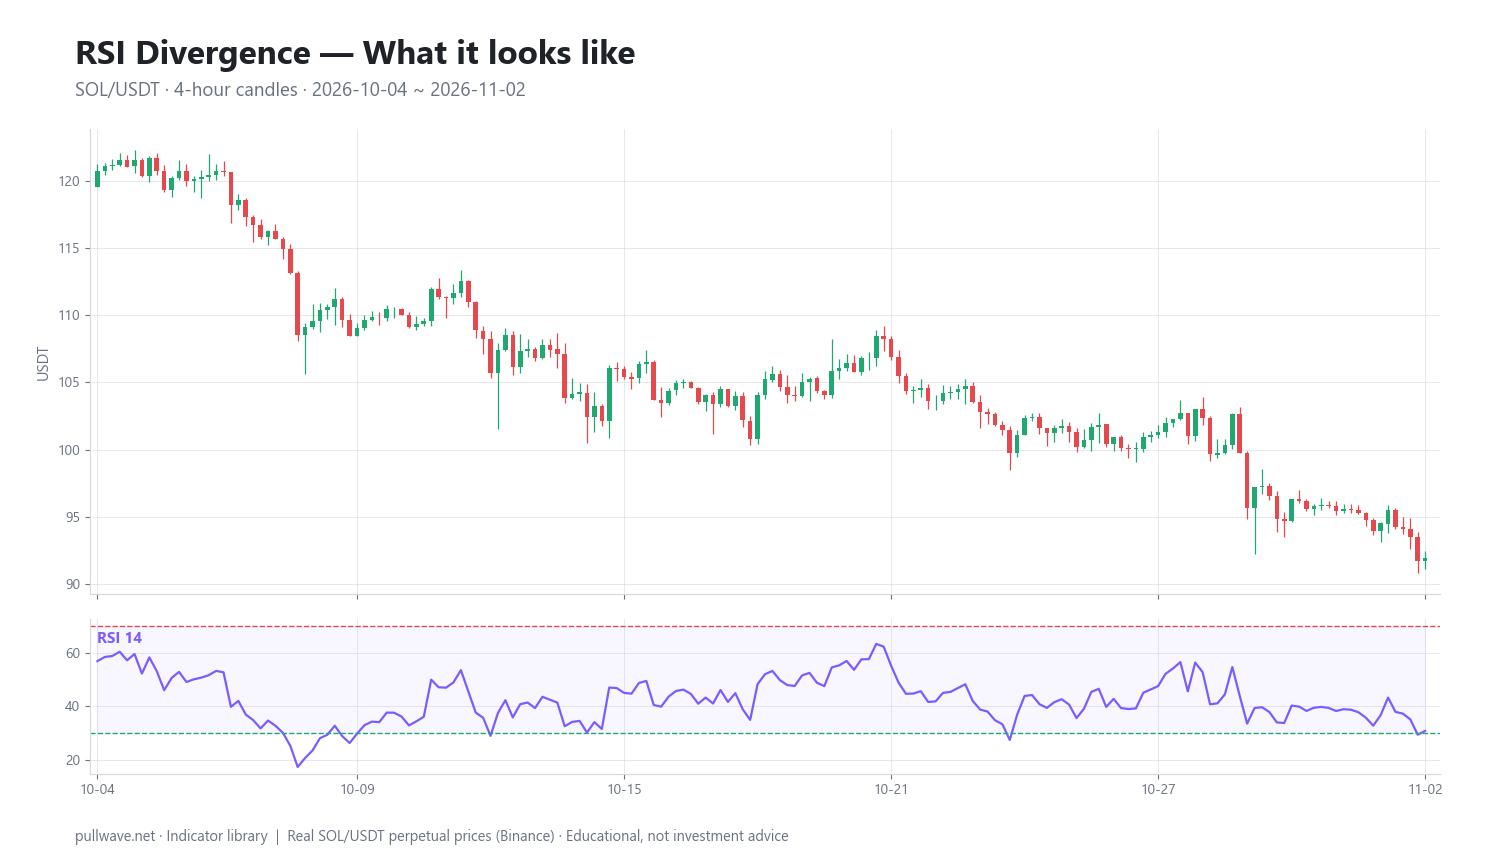
Figure 1 shows SOL/USDT perpetual 4-hour candles with RSI(14) in the lower panel over the window used later in the example. Notice that the RSI panel has its own peaks and troughs; divergence analysis is simply reading those two panels against each other rather than reading either one alone.
The idea behind it (theory and history)
The Relative Strength Index was created by J. Welles Wilder Jr. and published in 1978 in New Concepts in Technical Trading Systems, with a companion article in Commodities magazine the same year. Wilder designed RSI to normalize the balance between average up-closes and average down-closes into a bounded 0–100 scale, so that momentum could be compared across different instruments and price levels.
Wilder discussed divergence directly in that book, treating a disagreement between price and RSI as a strong warning that a turning point was approaching — he placed particular weight on what he called "failure swings," where RSI fails to exceed its prior extreme and then breaks its intervening pivot. Divergence as a standalone concept predates RSI; it was already applied to momentum oscillators and volume measures earlier in the twentieth century.
The hidden/continuation variant and the idea that divergence behaves very differently in trending versus ranging conditions are generally credited to later practitioners, most often Andrew Cardwell, who taught RSI range rules and "positive and negative reversals" (the mirror image of classic divergence). The exact lineage of some of this terminology is murky, so treat it as commonly accepted practice rather than documented history.
The underlying logic is simple. RSI measures the average size of up moves relative to the average size of all moves over a lookback window. If price makes a new low but the selling that produced it is smaller and slower than the selling that produced the last low, RSI mechanically prints a higher low. That is not a prediction — it is a description of how the move was made.
How it is calculated
Divergence detection has two stages: compute RSI, then compare swing points. Stage one, in plain words:
- For each bar, take the change from the previous close. A positive change is a gain; a negative change is a loss (stored as a positive number).
- Average the gains and the losses over the lookback period. Wilder used a simple average for the first value, then his own smoothing (equivalent to an exponential average with alpha = 1/period) for every bar after.
- Divide average gain by average loss to get relative strength, RS.
- Convert RS to a bounded 0–100 value.
``` change_t = close_t - close_(t-1) gain_t = max(change_t, 0) loss_t = max(-change_t, 0)
AvgGain_t = (AvgGain_(t-1) * (n-1) + gain_t) / n # Wilder smoothing, n = 14 AvgLoss_t = (AvgLoss_(t-1) * (n-1) + loss_t) / n
RS_t = AvgGain_t / AvgLoss_t RSI_t = 100 - (100 / (1 + RS_t)) ```
Stage two, finding the divergence itself. A swing point is usually defined with a fractal rule: a bar is a swing low if its low is the lowest of the k bars to its left and the k bars to its right. The same bar index is then used to read RSI. Note that a swing is only confirmed k bars after it forms — this lag is built into the method and cannot be removed.
``` swing_low(i) = low_i == min(low[i-k : i+k]) swing_high(i) = high_i == max(high[i-k : i+k])
for consecutive confirmed swing lows (i, j), j > i, (j - i) <= max_gap: if low_j < low_i and RSI_j > RSI_i -> regular bullish divergence at bar j if low_j > low_i and RSI_j < RSI_i -> hidden bullish divergence at bar j
(mirror the comparisons for swing highs to get bearish divergences) ```
The max_gap constraint matters. Two swings separated by 200 bars are not meaningfully comparable on a 14-period oscillator, because RSI has fully reset several times in between. The example below uses k = 5 bars each side and a maximum pairing distance of 40 bars.
Default settings and variations
RSI period: 14. Wilder's default across most of his indicators. With daily data in the 1970s, 14 periods covered roughly half a month of trading — long enough to smooth noise, short enough to respond within a swing. The number has no magic in it; it survived because it behaves reasonably across many markets and because almost everyone uses it, which makes the levels it produces widely watched.
Shorter periods (7–9) make RSI swing harder and produce far more divergence candidates, most of them noise. Longer periods (21–25) produce fewer, slower, usually cleaner signals but confirm late. If you shorten the period, tighten your other filters, not loosen them.
Swing definition: 3 to 5 bars each side is typical. Three bars each side finds more pivots and more divergences; five bars each side finds fewer and confirms five bars after the fact. This single parameter changes your divergence count more than the RSI period does.
Pairing window: 20 to 60 bars. Common practice is to compare only consecutive confirmed swings and to drop pairs that are too close (fewer than roughly 5–10 bars apart, which is usually the same swing seen twice) or too far apart.
Price reference: close vs wick. Using closing prices for the swing comparison gives fewer signals than using highs and lows, because crypto wicks are long and frequently make a "lower low" that the body never confirms. Whichever you choose, be consistent — RSI itself is built on closes, so comparing RSI closes against price wicks introduces a small mismatch by construction.
How to read it
Start with the trend, not the oscillator. Mark whether price is in a trend or a range on the timeframe you are trading, because the same divergence means different things in each.
Then read it in this order:
- Where are the RSI swings? A bullish divergence whose second RSI low is at 28 carries more information than one whose second low is at 45. Extremes matter; divergence in the middle of the range is often noise.
- How many bars apart are the swings? Adjacent swings in the same structure are comparable. Swings on opposite sides of a large consolidation usually are not.
- Is the price structure confirming? Divergence on its own is a warning that momentum faded. A structural break — a swing high taken out after a bullish divergence, or the RSI breaking its own intervening pivot (Wilder's failure swing) — is what turns a warning into something testable.
- Has this already happened once? Repeated divergence in the same direction is the single clearest sign that you are fighting a trend rather than catching a turn.
How traders use it
1. Exhaustion warning inside a mature move. After an extended run, a regular divergence is used as a reason to tighten stops, reduce size, or stop adding. Works when the move is already stretched and the divergence appears at an RSI extreme near an obvious structural level. Fails when the trend is young and strong; early-trend divergences are routine and usually resolve in the trend's direction.
2. Confirmation for a level you already had. Many traders never act on divergence by itself — they use it to grade a horizontal level, range boundary, or higher-timeframe zone they had already marked. Works because it filters out the levels where momentum is still accelerating into them. Fails if the level itself is poorly chosen; divergence cannot rescue a bad level.
3. Hidden divergence as a pullback filter. In an established uptrend, a higher price low with a lower RSI low suggests the pullback was shallow in price but deep in momentum terms. Works in clean, persistent trends with regular retracements. Fails badly in ranges, where "trend" is an illusion and hidden divergence just marks the middle of chop.
4. Exit and de-risking tool. Using bearish divergence to scale out of longs rather than to open shorts changes the payoff profile: a false signal costs you upside, not capital. This is the use that survives the most market regimes, which is itself a comment on how unreliable divergence is as an entry trigger.
For crypto specifically: markets run 24/7, so there is no session structure to anchor swings, and the 4h and daily charts tend to produce more coherent divergences than the 5m and 15m. On perpetual futures, divergence setups are frequently taken with leverage against the prevailing trend — the worst possible combination, because the typical failure mode of divergence is "right eventually, liquidated first." Position sizing has to assume the signal repeats before it resolves.
Example on a real SOL chart
The window is SOL/USDT perpetual on Binance, 4-hour candles, 2026-10-04 to 2026-11-02, with RSI 14, swing points defined as 5 bars each side, and swing pairs limited to 40 bars apart. The last close in the window was 91.95. Outcomes are measured 6 bars and 18 bars after each signal.
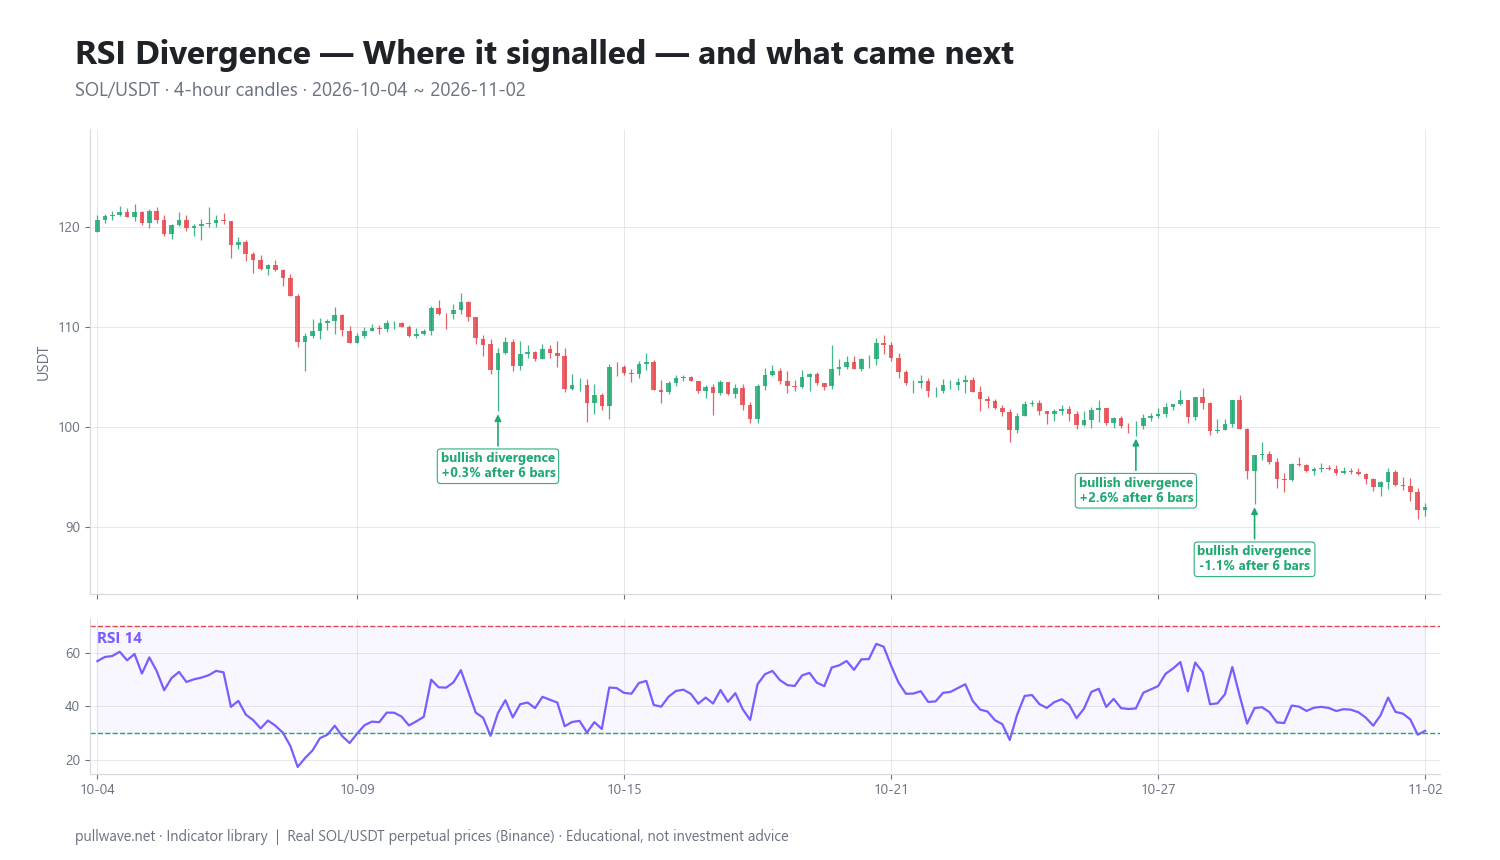
Figure 2 marks each detected signal on the same chart along with the percentage move after 6 and after 18 bars. The scan found three signals in the window, all of them regular bullish divergences:
| Date (UTC) | Signal | Price | +6 bars | +18 bars |
|---|---|---|---|---|
| 2026-10-13 00:00 | Bullish divergence | 107.42 | +0.34% | −1.99% |
| 2026-10-27 08:00 | Bullish divergence | 100.08 | +2.63% | −3.55% |
| 2026-10-30 00:00 | Bullish divergence | 97.19 | −1.06% | −1.70% |
Two of the three signals (2/3) were higher six bars later, and the best of them gained +2.63%. But all three were lower eighteen bars later, and the signal prices themselves tell the real story: 107.42, then 100.08, then 97.19, with the window closing at 91.95. Momentum kept fading at each new low, the oscillator kept flagging it, and price kept going down anyway.
This is the textbook failure mode of regular divergence in a downtrend, and it is worth sitting with. Each individual signal was technically correct — downside momentum was smaller than at the previous low. The signals produced small bounces that a tight-stop trader might have captured, and losses for anyone holding for a swing reversal. The third signal did not even produce the short-term bounce.
Three signals on one market, one timeframe and one month is a sample too small to prove anything about RSI divergence in general. It is an illustration of one specific behavior: in a persistent downtrend, bullish divergence tends to repeat at successively lower prices. A different window — a range, or the end of a capitulation — would likely look very different.
Common mistakes
- Trading the first divergence in a strong trend. The first one is the most tempting and historically the least reliable. Divergence frequently clusters, as the example shows.
- Drawing the line by eye to fit a bias. If you have to skip a swing to make the divergence work, it is not a divergence. Define the swing rule (k bars each side) before you look.
- Ignoring where RSI is. A bullish divergence with both lows above 40 is weak evidence. The oscillator should be in or near the zone where the move is actually stretched.
- Comparing swings that are too far apart. Beyond roughly 40–60 bars on a 14-period RSI, the two readings describe different market conditions.
- Treating divergence as a trigger instead of a condition. Without a structural confirmation and an invalidation level, there is nothing to risk-manage. The signal tells you nothing about where you are wrong.
- Forgetting the confirmation lag. With 5 bars each side, the second swing is confirmed 5 bars (20 hours on a 4h chart) after it printed. Backtests that ignore this lag overstate results badly.
- Using high leverage on a counter-trend signal. The characteristic divergence failure is a sequence of warnings during a trend. Leverage converts "early" into "liquidated."
Combining it with other tools
Divergence answers one narrow question — is momentum still expanding? — so it pairs best with tools that answer different questions.
Market structure. Higher highs and higher lows, or a clean break of a prior swing, give divergence the confirmation it lacks. A bullish divergence followed by a break of the most recent swing high is a far more defined situation than the divergence alone, and it comes with an obvious invalidation point.
Higher-timeframe trend. Checking the daily before acting on a 4h divergence filters out most counter-trend signals. A simple moving average on the higher timeframe is enough to decide whether you should be looking for regular (reversal) or hidden (continuation) divergence at all.
Volume and volatility. Declining volume into a new low supports the momentum-exhaustion reading. Expanding volume into it argues the opposite. Volatility measures such as ATR help size the position and place the invalidation beyond normal noise rather than at a round number.
Support and resistance. Divergence at an untested level in the middle of nowhere is weak; divergence at a level that has already been defended several times is a cleaner situation. The level provides the risk definition; the divergence provides the evidence that the sellers arriving at it are weaker than before.
What divergence does not combine well with is more oscillators. Stacking RSI, MACD and Stochastic divergence is not three confirmations — they are three functions of the same price series and will mostly agree with each other by construction.
Frequently asked questions
Q. What is the best RSI setting for divergence in crypto?
There is no setting that is best in all conditions, but RSI 14 remains the practical default on 4h and daily crypto charts because it is what most market participants watch and because it balances responsiveness against noise. Shorter periods such as 7 or 9 generate far more divergence candidates, the majority of which are noise in a 24/7 market. If you change the RSI period, change your swing definition and filters with it rather than in isolation.
Q. What is the difference between regular and hidden RSI divergence?
Regular divergence is price making a more extreme swing (lower low or higher high) while RSI does not, and it is read as possible trend exhaustion. Hidden divergence is the reverse — RSI makes the more extreme swing while price does not — and it is read as a pullback within an existing trend, so it carries a continuation bias. Both use the same measurement; only the relative direction of the price and RSI swings differs.
Q. Does RSI divergence work on lower timeframes like 5m or 15m?
Divergence can be detected on any timeframe, but signal quality typically degrades as the timeframe shortens, because a 14-period oscillator on 5-minute crypto data reacts to microstructure noise rather than to meaningful shifts in participation. Most traders who use divergence seriously anchor it on 4h or daily charts and use lower timeframes only for execution. Expect many more signals and a much lower proportion of them to be followed through.
Q. Why does RSI divergence fail so often?
Because fading momentum and a trend reversal are different things — a trend can continue for a long time on reduced momentum, especially when it is driven by steady liquidation or persistent spot selling. In strong trends the same divergence tends to reappear at successively worse prices, as it did three times in the SOL example above, where price moved from 107.42 at the first signal to 91.95 at the end of the window. Divergence is better treated as a condition that raises your attention than as a signal to act against the trend.
Q. How many bars should separate the two swings in a divergence?
A common practice is at least 5–10 bars (otherwise you are likely measuring the same swing twice) and no more than about 40–60 bars on a 14-period RSI. Beyond that range the oscillator has fully reset between the two readings and the comparison loses meaning. The example on this page used swings defined by 5 bars on each side and limited pairs to 40 bars apart.
Q. Can RSI divergence be used on its own?
It can be detected on its own, but it gives you no entry level, no invalidation point and no information about trend context, which makes it difficult to risk-manage as a standalone system. In practice most traders use it as a filter or a confirmation on top of market structure and a predefined level, or as a de-risking cue for positions they already hold. Used that way, a false signal costs opportunity rather than capital.
Key takeaways
- RSI divergence compares two price swings with the two matching RSI swings; regular divergence suggests exhaustion, hidden divergence suggests continuation.
- The calculation is deterministic once you fix three parameters: RSI period (commonly 14), swing definition (commonly 3–5 bars each side) and the maximum distance between paired swings.
- Market regime decides the signal's value: in ranges and at mature extremes it is informative; in young, strong trends it repeats and misleads.
- In the SOL/USDT 4h window shown, three bullish divergences produced moves of +0.34%, +2.63% and −1.06% after 6 bars but −1.99%, −3.55% and −1.70% after 18 bars — short-lived bounces inside a continuing decline, and far too small a sample to generalize from.
- Divergence is a condition, not a trigger: pair it with structure, higher-timeframe context and a defined invalidation, and be especially careful with leverage on counter-trend signals.
Educational material. Charts use real SOL/USDT perpetual prices; past behaviour does not predict future results. Not investment advice.