Indicator & technique library · Indicator library
Chaikin Money Flow (CMF): Formula, Settings and Uses
At a glance
- Chaikin Money Flow measures where price closes inside each bar's range, weights that by volume, and averages the result over a lookback (usually 20 periods).
- It oscillates between -1 and +1; readings above zero suggest accumulation pressure, below zero distribution pressure.
- CMF is a confirmation and context tool, not a timing trigger — the zero line whipsaws badly in ranges.
- On a 4h SOL/USDT window with CMF 20, zero-line crosses fired 34 times and only 19 of 34 moved in the signal's direction, a reminder to treat it as one input among several.
Chaikin Money Flow (CMF) is a volume-weighted oscillator that asks a simple question of every candle: did price close near the top of its range or near the bottom, and how much volume traded while that happened? Average that answer over the last 20 bars and you get a single number between -1 and +1 that summarizes whether buyers or sellers have been finishing the bars in control.
Traders care about CMF because price alone does not tell you how a move was achieved. A 3% rally that closes on its lows every bar is a different animal from a 3% rally that closes on its highs with rising volume. CMF is one of the cheapest ways to put that distinction on screen — as long as you understand what it actually measures, which is not literally "money flowing in and out of the market."
What is Chaikin Money Flow (CMF)?
CMF is an oscillator plotted in a separate pane below price. It takes each bar's close location value — how close the close is to the high versus the low — multiplies it by that bar's volume, sums the result over a lookback period, and divides by the total volume over the same period.
Because the result is a ratio of volume-weighted values to total volume, CMF is bounded: it cannot go above +1 or below -1. In practice it lives between roughly -0.4 and +0.4 on liquid crypto pairs, and spends much of its life near zero. Values far from zero mean that over the whole lookback window, bars were consistently closing in the upper (positive) or lower (negative) part of their ranges on meaningful volume.
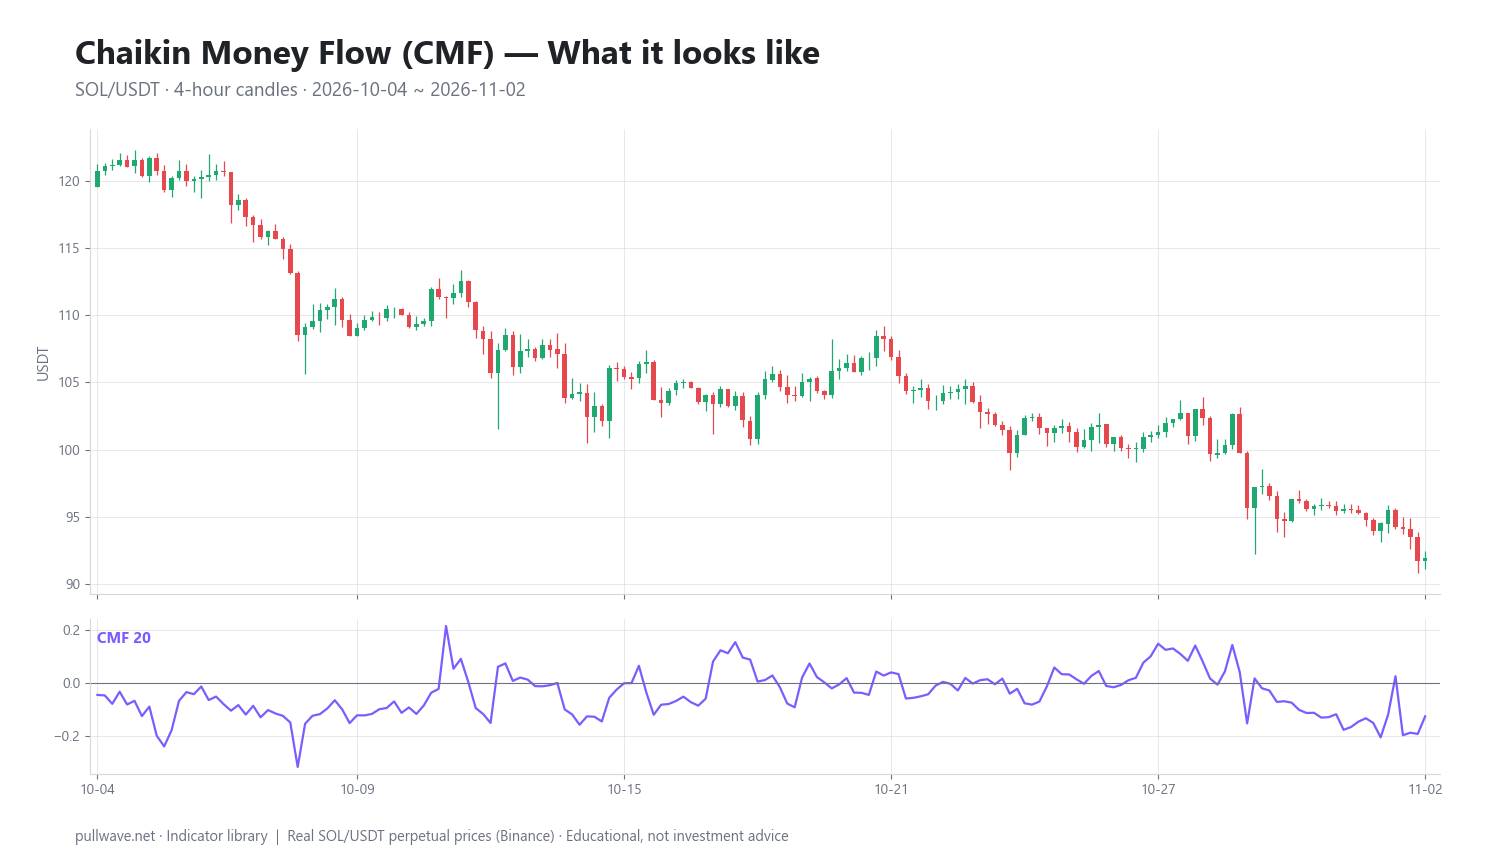
Figure 1 shows CMF 20 drawn under real SOL/USDT 4h candles. Notice how the oscillator crosses the zero line far more often than price makes meaningful swings — that behavior is central to using the tool sensibly.
The idea behind it (theory and history)
CMF was developed by Marc Chaikin, an American stock analyst and trading-systems developer who also created the Chaikin Oscillator and worked extensively on volume-based analysis. The family of indicators dates from the 1970s–1980s era of volume research that followed Joe Granville's On-Balance Volume; CMF is a direct descendant of Chaikin's Accumulation/Distribution Line. Precise first-publication details vary between sources, so treat any single date you see quoted with caution.
The theoretical claim is narrow and worth stating precisely. Granville's OBV assigned a bar's entire volume to buyers or sellers based on whether the close was above or below the previous close. Chaikin argued that the more informative comparison is within the bar: if a market opens, sells off, and then closes near the session high, the people who were willing to pay up at the end of the bar were the ones who mattered. Closing strength on heavy volume suggests accumulation; closing weakness on heavy volume suggests distribution.
That is a behavioral assumption, not an accounting fact. Every executed trade has a buyer and a seller of equal size, so no indicator can tell you that "money entered the market." What CMF measures is where the market settled inside its own range, weighted by participation. Keep that framing and you will avoid most of the nonsense written about this indicator.
How it is calculated
Step by step, for each bar:
- Find the money flow multiplier. Subtract the low from the close, subtract the close from the high, take the difference of those two, and divide by the bar's full range (high minus low). A close exactly at the high gives +1; a close exactly at the low gives -1; a close at the midpoint gives 0.
- Compute money flow volume. Multiply the multiplier by the bar's volume. A bar that closes on its high with 10,000 units traded contributes +10,000; a bar that closes at the midpoint of its range with the same volume contributes roughly 0. Note that the multiplier depends only on where the close sits between high and low — the open plays no part, so even a small-bodied candle can produce a multiplier near +1 or -1.
- Sum over the lookback. Add the money flow volume of the last n bars (default 20).
- Normalize. Divide that sum by the total volume of the same n bars.
``` MFM = ((Close - Low) - (High - Close)) / (High - Low) MFV = MFM x Volume CMF(n) = Sum(MFV, n) / Sum(Volume, n)
If High = Low, set MFM = 0 (avoid division by zero) ```
Two mechanical details matter. First, the denominator is total volume, so a single huge-volume bar can dominate the reading for the next 20 bars and then drop out abruptly, causing a jump that has nothing to do with current price action. Second, the multiplier only looks inside the bar — it never compares the close to the previous close. A candle that opens far below yesterday's close but recovers to close near its own high still registers as positive. In equities this is the classic criticism of CMF (gap handling); in 24/7 crypto markets true gaps are rare on perpetuals, but the same blind spot appears after violent liquidation wicks.
Default settings and variations
| Setting | Typical use | Notes |
|---|---|---|
| CMF 20 | Most charting defaults | Roughly one month of daily stock bars |
| CMF 21 | Chaikin's commonly cited original | 21 trading days ≈ one calendar month on equities |
| CMF 10–14 | Faster, more crosses | More noise, more false zero-line signals |
| CMF 30–50 | Slower bias filter | Smoother, better for swing context on 4h/daily crypto |
The 20/21 default comes from the equity world, where 21 sessions approximate a trading month. Crypto trades 24/7, so on a daily chart 20 bars is about three weeks of calendar time, and on a 4h chart it is a little over three days. There is nothing sacred about the number: it is a smoothing choice that trades responsiveness against stability.
Common variations include smoothing CMF with a short moving average to reduce zero-line chatter, using threshold bands at ±0.05 or ±0.10 instead of the raw zero line, and substituting the close-location value with a typical-price formulation. Some platforms also expose the underlying Accumulation/Distribution Line, which is the cumulative version of the same money-flow volume — a running total rather than CMF's volume-normalized rolling sum — and is often easier to read for divergence work.
How to read it
Start with the sign. CMF above zero means the volume-weighted close location over the lookback has been in the upper half of bar ranges — the standard interpretation is net buying pressure. Below zero is the mirror image.
Then read the magnitude. Readings near zero (say between -0.05 and +0.05) are effectively neutral and should be ignored. Sustained readings beyond ±0.15 are more meaningful, and readings beyond ±0.25 are uncommon on liquid pairs and usually accompany a strong directional phase.
Finally read the shape. A CMF that stays above zero through a pullback says sellers are not finishing the bars in control even while price dips. A CMF that falls steadily while price makes higher highs is the classic bearish divergence setup. Duration matters more than any single print: one bar above zero is noise, fifteen bars above zero is information.
How traders use it
1. Bias filter behind a trend system. Rather than trading CMF, use it to decide which direction of signals you are willing to take. If CMF 20 has been positive for most of the last month on a daily chart, you might only act on long setups from your primary method. Works in persistent trends where the close-location bias is consistent. Fails in choppy ranges, where CMF oscillates around zero and the filter flips every few bars, filtering nothing.
2. Breakout confirmation. When price clears a range high, a CMF that is already positive and rising supports the idea that the breakout bar is the continuation of accumulation rather than a one-bar liquidity grab. Works when volume data is clean and the range was long enough for the lookback to mean something. Fails on low-liquidity pairs, during thin weekend sessions, and immediately after a single enormous volume bar distorts the denominator.
3. Divergence against price. Price makes a higher high, CMF makes a lower high: the second push was achieved with weaker closing strength. Treat it as a warning about the quality of the move, not a reversal trigger. Works best at the end of extended trends on 4h and daily charts. Fails constantly in strong trends, where divergences can persist for weeks while price keeps going.
4. Pullback quality check. During a retracement in an uptrend, a CMF that dips but holds above zero suggests orderly profit-taking; a CMF that collapses to -0.20 suggests the character of the market changed. Works as context. Fails if you demand precision from it — CMF has no concept of support, resistance, or position size.
Example on a real SOL chart
The window below is SOL/USDT perpetual on Binance, 4h candles, from 2026-10-04 to 2026-11-02, with CMF set to 20 periods. The last close in the window was 91.95 and the final CMF reading was -0.13 — modestly negative, consistent with a market that had been drifting lower.
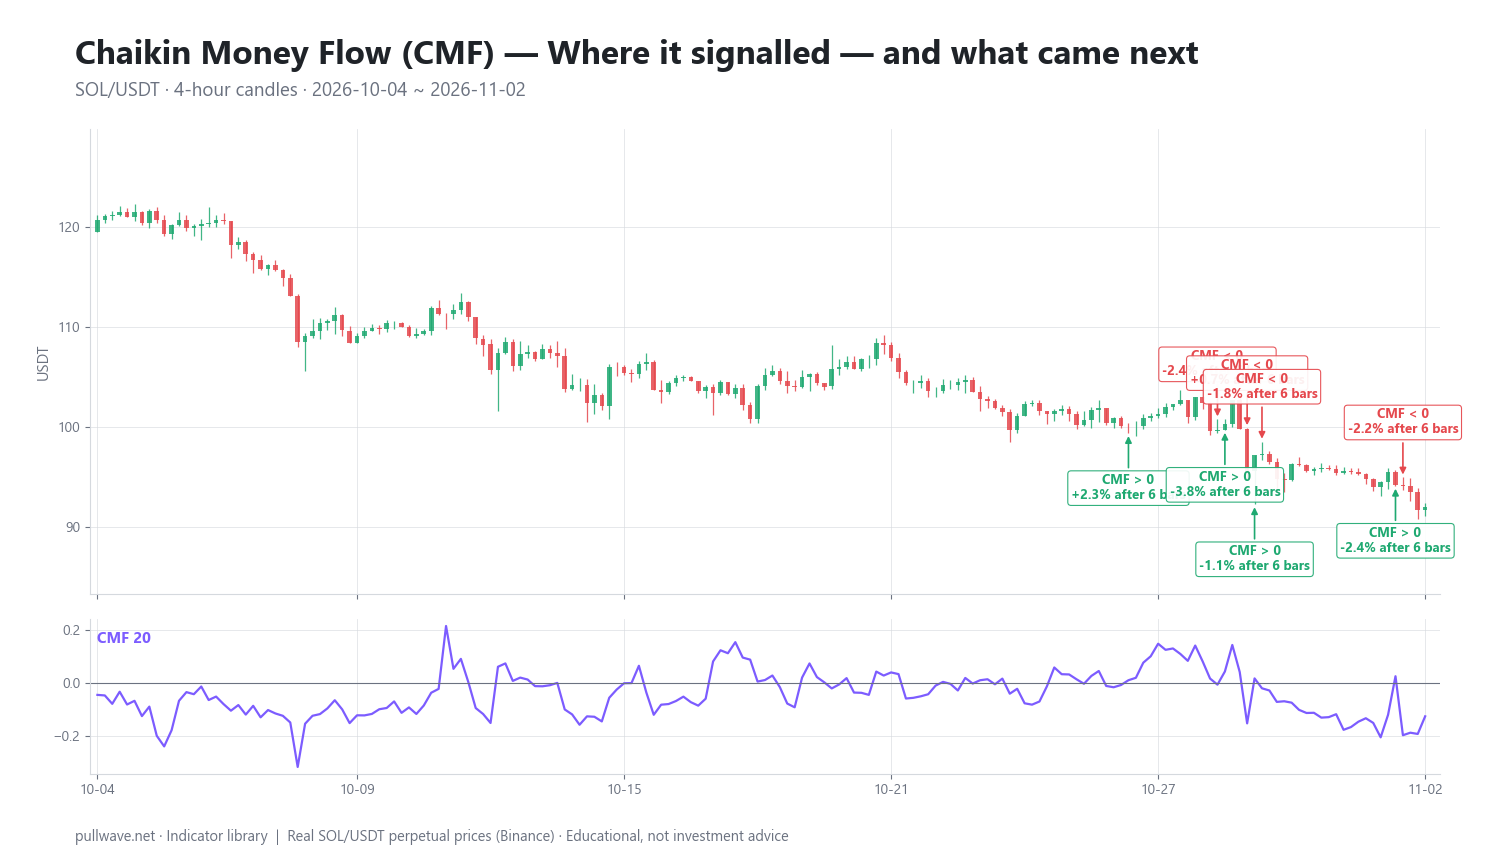
Figure 2 marks every zero-line cross in the window and the percentage move 6 bars (one day) and 18 bars (three days) later. Over the full window there were 34 crosses — more than one a day on a 4h chart — and the move went in the direction implied by the signal in 19 of 34 cases. That is close to a coin flip, and it is the single most useful thing this example teaches: the zero line is not a trade trigger.
Here is the cluster from the last week of the window, with the 6-bar and 18-bar outcomes:
| Date (UTC) | Signal | Price | After 6 bars | After 18 bars |
|---|---|---|---|---|
| 2026-10-26 08:00 | CMF > 0 | 101.67 | -1.56% | -1.31% |
| 2026-10-26 16:00 | CMF < 0 | 100.43 | +0.68% | -0.65% |
| 2026-10-27 04:00 | CMF > 0 | 100.05 | +2.26% | -2.77% |
| 2026-10-29 04:00 | CMF < 0 | 99.71 | -2.44% | -4.21% |
| 2026-10-29 08:00 | CMF > 0 | 100.34 | -3.80% | -5.05% |
| 2026-10-29 20:00 | CMF < 0 | 95.62 | +0.71% | -1.16% |
| 2026-10-30 00:00 | CMF > 0 | 97.19 | -1.06% | -1.70% |
| 2026-10-30 04:00 | CMF < 0 | 97.28 | -1.77% | -3.13% |
| 2026-11-02 04:00 | CMF > 0 | 94.24 | -2.43% | -2.43% |
| 2026-11-02 08:00 | CMF < 0 | 94.07 | -2.25% | -2.25% |
Several things stand out. On 2026-10-26 the indicator crossed above zero at 101.67 and back below zero eight hours later at 100.43 — a textbook whipsaw. On 2026-10-29 it crossed above zero at 100.34 and price was 3.80% lower six bars later, the worst single outcome in the group. Meanwhile every one of the five bearish crosses shown here was followed by a lower price 18 bars later, ranging from -0.65% to -4.21%.
Before reading that as evidence that bearish CMF signals "work," note the obvious: this window trended down into a 91.95 close. In a falling market, any signal that points down looks good and any signal that points up looks bad. That is a property of the window, not of the indicator. Note also that the final two entries show identical 6-bar and 18-bar figures because the window ends before 18 bars had elapsed — the longer horizon simply had no more data.
This is one market, one timeframe, and one month. It illustrates how CMF behaves; it proves nothing about expectancy.
Common mistakes
- Trading the zero-line cross mechanically. Thirty-four crosses in a month on one 4h chart should settle this. The cross is a change in a smoothed average, not an event.
- Believing it measures capital inflow. It measures close location weighted by volume. Nothing in the formula knows anything about money entering or leaving.
- Ignoring the volume source. Perpetual futures volume, spot volume, and aggregated multi-exchange volume produce different CMF values on the same asset. A reading of +0.18 on one feed may be +0.04 on another.
- Shortening the lookback to get more signals. CMF 7 will give you far more crosses and almost no additional information.
- Using it on illiquid pairs. A handful of large prints can swing the ratio wildly when the denominator is small.
- Treating divergence as a reversal order. Divergence describes weakening participation. It says nothing about when, or whether, price responds.
- Forgetting leverage context. On perpetuals a 4% adverse move against a 10x position already erases roughly 40% of the margin backing it, and an adverse move near 10% puts that position in liquidation territory once maintenance margin and fees are counted. The indicator has no opinion on your position size.
Combining it with other tools
CMF answers "how were the bars closed?" It does not answer "where are we?" or "how fast?" Pair it with tools that do.
Structure first: a higher-timeframe trend read — market structure, a long moving average, or the weekly range — decides which direction of CMF signal you even look at. Using a positive CMF to justify longs inside a confirmed downtrend is how volume indicators get blamed for poor trade selection.
Momentum and location second: RSI or MACD describe the speed of the move, while VWAP or volume profile describe where accepted value sits. A breakout above a value-area high with CMF positive and RSI not yet extreme is a much more coherent picture than any one of those readings alone.
For confirmation of CMF itself, the Accumulation/Distribution Line and On-Balance Volume are natural companions — they are built from related logic but accumulate into a running total rather than averaging over a fixed window, so agreement between them is mildly meaningful and disagreement is a flag to slow down. Finally, risk tools such as ATR-based stops matter more than any signal: in crypto, position sizing determines survival, and no oscillator will tell you how much to risk.
Frequently asked questions
Q. What is the best CMF setting for crypto?
There is no objectively best setting. The 20-period default works reasonably on 4h and daily crypto charts; lengthening to 30–50 makes CMF a steadier bias filter, while shortening below 14 mostly adds noise. Because crypto trades 24/7, a 20-bar lookback covers less calendar time than the equity convention it came from, so many swing traders lengthen it.
Q. What does a negative Chaikin Money Flow mean?
A negative CMF means that over the lookback period, volume-weighted closes have tended to land in the lower half of each bar's range — the conventional interpretation is selling or distribution pressure. It does not mean money is leaving the asset, since every trade has a buyer and a seller. Shallow negatives between 0 and -0.05 are usually noise.
Q. What is considered a strong CMF reading?
On liquid pairs, readings beyond ±0.15 are generally treated as meaningful and beyond ±0.25 as strong, though the exact thresholds depend on the asset and timeframe. More important than the level is persistence: a reading that holds above +0.15 for many bars says more than a single spike. Check the historical range of CMF on the specific chart before fixing thresholds.
Q. What is the difference between CMF and the Money Flow Index (MFI)?
MFI, developed by Gene Quong and Avrum Soudack, compares each bar's typical price to the previous bar's typical price and builds an RSI-style oscillator scaled 0–100. CMF ignores the previous bar entirely and looks only at where the close sits inside the current bar's range, producing a value between -1 and +1. MFI is used mainly for overbought/oversold readings; CMF is used mainly for directional pressure and divergence.
Q. How is CMF different from the Chaikin Oscillator?
Both come from Marc Chaikin's volume work and share the Accumulation/Distribution building block. The Chaikin Oscillator is the difference between a 3-period and a 10-period EMA of the cumulative A/D Line, so it behaves like a MACD of accumulation. CMF instead normalizes money flow volume by total volume over a fixed lookback, which bounds it between -1 and +1.
Q. Can CMF be used on perpetual futures?
Yes, and it is widely applied to perpetuals, but the volume you feed it is contract volume on one venue rather than spot turnover. Readings can differ noticeably between a perp feed and a spot feed for the same asset, and funding-driven positioning can distort close locations around funding timestamps. Compare the two feeds before drawing conclusions.
Key takeaways
- CMF averages the volume-weighted position of each close inside its own bar range over a lookback (default 20), producing a bounded oscillator between -1 and +1.
- It was developed by Marc Chaikin as an evolution of OBV-style volume analysis and is closely related to the Accumulation/Distribution Line, which is the cumulative form of the same money-flow volume.
- The zero line whipsaws in ranging markets: in the 4h SOL/USDT window studied, 34 crosses produced moves in the signal's direction only 19 times.
- Persistence and magnitude carry more information than individual crosses; readings between -0.05 and +0.05 are effectively neutral.
- Use CMF as confirmation inside a framework that already defines trend, location and risk — never as a standalone entry rule, especially on leveraged perpetuals.
Educational material. Charts use real SOL/USDT perpetual prices; past behaviour does not predict future results. Not investment advice.