Indicator & technique library · Trading techniques
ATR Stop-Loss Explained: Formula, Settings and Uses
At a glance
- An ATR stop sets the exit distance from the Average True Range, so the stop adapts to current volatility instead of using a fixed percentage.
- The standard build is Wilder's 14-period ATR multiplied by roughly 1.5–3, subtracted from entry price or from a recent extreme for a trailing version.
- A true ratcheting trail never moves against you, while a rolling k-bar version re-anchors each bar and can step down as the window rolls forward.
- In the SOL/USDT 4h window tested below, a 2.5×ATR14 rolling trail was hit 9 times in one month with mixed follow-through, which is typical in a choppy downtrend.
A stop-loss placed with ATR sets the distance between your entry and your exit using the market's own recent volatility, measured by the Average True Range. Instead of saying "I'll risk 3%," you say "I'll risk two and a half average ranges," and the actual price distance widens when the market is wild and tightens when it is quiet.
Traders care about this because a fixed-percentage stop is arbitrary. The same 3% stop is absurdly tight on SOL during a liquidation cascade and absurdly wide during a flat weekend. An ATR-based stop puts your risk on the same scale as the noise you are trying to survive, which makes position sizing consistent across coins, timeframes and volatility regimes.
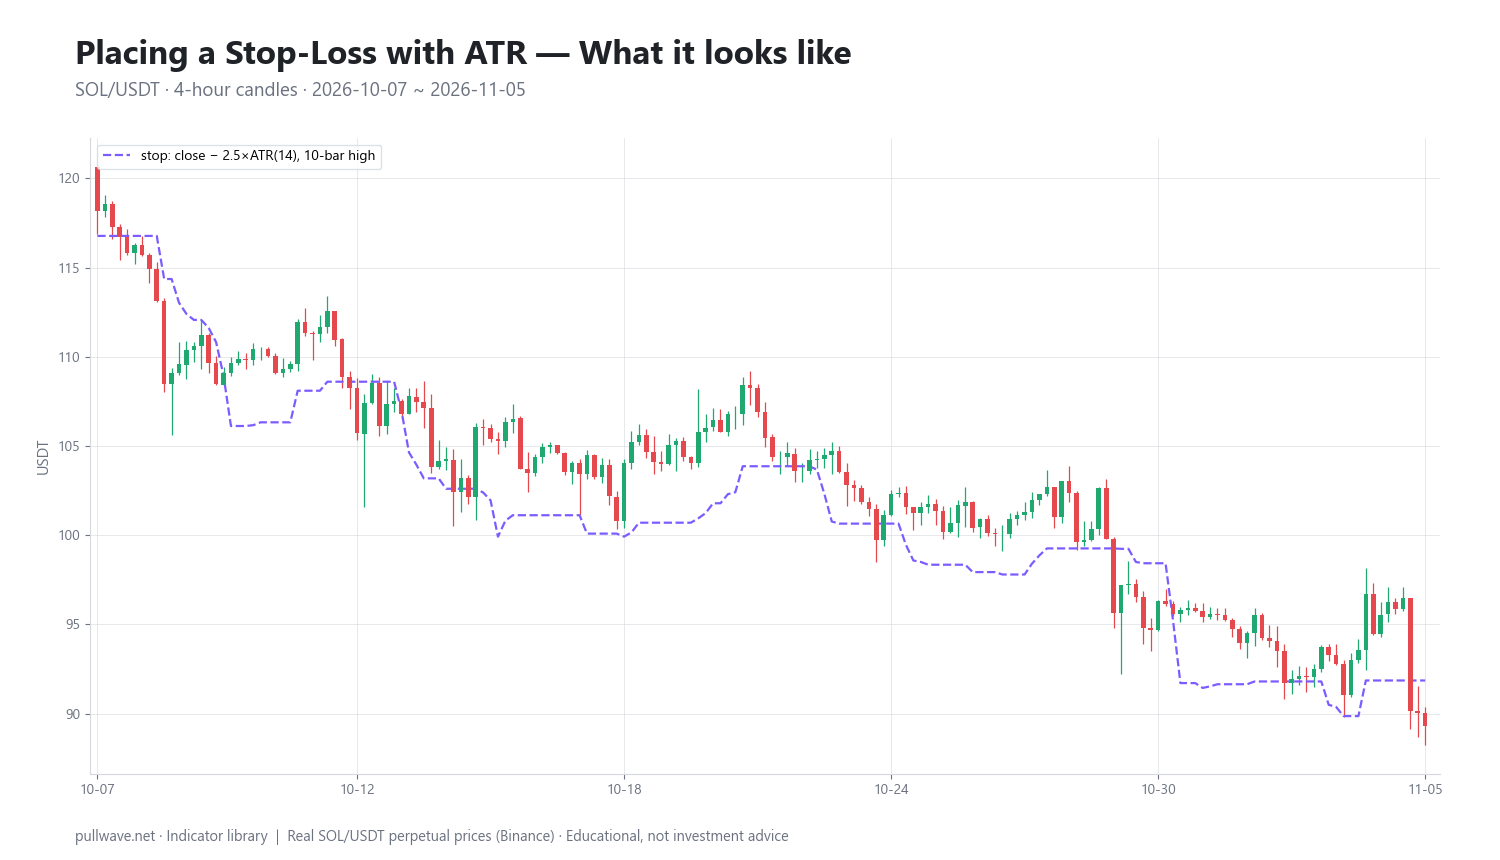
Figure 1 shows SOL/USDT 4h candles over the test window with the ATR-based trailing stop line drawn underneath price. Notice how the line sits far below price when ranges expand and hugs price when candles shrink — that spacing is the whole point of the technique.
What is Placing a Stop-Loss with ATR?
Average True Range is a pure volatility measure: the average size of recent bars, including gaps. It says nothing about direction. Placing a stop with ATR means converting that volatility number into a price distance by multiplying it by a constant, then subtracting it from a reference price (for a long) or adding it (for a short).
There are three forms worth separating clearly, because they behave differently:
- Static ATR stop. Fixed at trade entry: stop = entry − m × ATR at the moment you open. It never moves.
- Ratcheting ATR trail. Recalculated each bar as the running maximum since entry of (reference − m × ATR). By construction it can only rise for a long, never fall. The best-known version is the Chandelier Exit, which hangs the stop a multiple of ATR below the highest high since entry.
- Rolling-window ATR trail. Recalculated each bar as the maximum over the last k bars only — for example the highest value of (close − 2.5 × ATR14) across the previous 10 bars. Because the window rolls forward, old high anchors drop out of it, so this line can step down as well as up. That is not a bug; it is what the formula says. It is also the version used in the example later on this page.
All three are exit rules, not entry signals. ATR tells you how much room a position needs; it never tells you whether the trade is worth taking.
The idea behind it (theory and history)
Average True Range was introduced by J. Welles Wilder Jr. in his 1978 book New Concepts in Technical Trading Systems, the same volume that gave the market RSI, the Directional Movement Index and Parabolic SAR. Wilder was trading commodity futures, where limit moves and overnight gaps meant that a bar's high-minus-low understated the real risk. His "true range" fixed that by including the previous close in the calculation.
Wilder did not publish ATR as a standalone chart ornament. He built it into a Volatility System: a trailing stop placed a constant multiple of ATR away from the extreme close, with the position reversing when the stop was hit. He used a short ATR lookback and a multiplier in the region of three. The logic was straightforward — if a market normally travels X per bar, being X away from price is not unusual, but being three X away is unusual enough to suggest the move has changed character.
The ratcheting form was later popularized under the name Chandelier Exit, credited to futures trader Chuck LeBeau and described in Alexander Elder's trading books. The name comes from the image of a chandelier hanging from the ceiling: the stop hangs a fixed ATR distance below the highest high the trade has reached.
The underlying theory is simple and worth stating plainly: price noise scales with volatility. A stop placed inside the normal noise band will be hit by noise. A stop placed outside it is only reached when something beyond routine fluctuation happens. ATR is just a way of measuring where that band currently sits.
How it is calculated
Step by step, in plain words:
- True Range for each bar. Take the largest of three distances: the current bar's high minus its low; the absolute distance from the current high to the previous close; the absolute distance from the current low to the previous close. The last two capture gaps.
- Average it. The first ATR value is a simple average of the first n True Ranges (default n = 14). Every later value uses Wilder's smoothing: multiply the previous ATR by (n − 1), add the current True Range, divide by n. This is a smoothed moving average with an effective lookback longer than 14 bars.
- Convert to a stop distance. Multiply the current ATR by your chosen constant m.
- Anchor it. For a static stop, subtract the distance from the entry price and leave it there. For a ratcheting trail, take the running maximum of (reference − m × ATR) since entry, so the level can never decrease. For a rolling trail, take the maximum over only the last k bars — simpler to compute on any chart, but the level will decrease when a high anchor rolls out of the window.
``` TR_t = max( High_t − Low_t, |High_t − Close_(t−1)|, |Low_t − Close_(t−1)| )
ATR_1 = mean(TR_1 … TR_n) # n = 14 ATR_t = (ATR_(t-1) × (n − 1) + TR_t) / n # Wilder smoothing
Static long stop = Entry − m × ATR_t Static short stop = Entry + m × ATR_t
ratcheting trail (never decreases for a long)
Trail_t = max( Trail_(t-1), Close_t − m × ATR_t )
rolling k-bar trail (can decrease as the window moves)
Trail_t = max over i in [t−k+1 … t] of (Close_i − m × ATR_i) ```
The rule used in the example on this page is the rolling version on the long side, with m = 2.5, n = 14 and k = 10 bars, anchored on closes rather than highs.
Default settings and variations
Why 14? Wilder applied a 14-period lookback across most of his indicators. It is a convention, not a derivation — on daily commodity charts it covered roughly two to three weeks of activity. Shorter periods make ATR react faster to a volatility spike; longer ones give a steadier, slower-moving stop distance.
Why a multiplier around 2–3? Below about 1.5 ATR, the stop sits inside the normal bar-to-bar range and will be touched by ordinary noise. Above about 4 ATR, the stop is rarely hit but each loss becomes large. The 2–3 band is the practical compromise most discretionary and systematic traders settle on.
| Setting | Typical value | What changes if you raise it |
|---|---|---|
| ATR period (n) | 14 | Smoother, slower stop distance; less reaction to one violent bar |
| Multiplier (m) | 1.5 – 3.0 | Fewer stop-outs, larger loss per trade, smaller position size |
| Trailing lookback (k) | 10 – 22 bars | Stop follows price less tightly and steps down less often |
| Trail type | Ratcheting or rolling | Ratcheting locks in ground; rolling re-anchors and may step down |
| Anchor | Close or High | Using closes ignores wicks and produces fewer premature exits |
Common variations worth knowing: the Chandelier Exit (highest high since entry − 3 × ATR22); Keltner-style bands, which place ATR envelopes around an EMA and are sometimes used as exit zones; ATR percentage, which divides ATR by price so you can compare volatility across assets; and SuperTrend, which flips an ATR band above or below price to produce a directional line.
How to read it
On the chart, an ATR stop is a line or a step pattern beneath price (for longs). Read three things from it.
- The gap between price and the line is the current cost of being wrong. When the gap is wide, volatility is high and your position size should be smaller for the same dollar risk.
- The slope and the steps. A ratcheting trail moves in flat segments and upward jumps only. A rolling k-bar trail does the same while price is making new extremes, but it also steps down once an old anchor leaves the window — so the line itself tells you whether the market has stopped making progress.
- A touch of the line is a statement about volatility, not about trend direction. Price moving 2.5 ATR against your position means the move is larger than routine. It does not guarantee a reversal, and it frequently happens at the exact moment a swing exhausts itself.
How traders use it
1. Sizing a position from risk, not from conviction. Decide the fraction of the account you are willing to lose on the trade, divide by the ATR-based stop distance, and you get the position size. If you accept $100 of risk and the stop sits $10 below entry, the position is 10 units. This is the most durable use of ATR, and it holds in every regime because it is arithmetic rather than prediction. It fails only when you override it — when the computed size feels "too small" and you round up.
2. An initial stop that respects the instrument. Placing the first stop at entry − 2 × ATR avoids the classic error of putting a stop just under the last candle because it looks neat. It works well on breakout and pullback entries in trending markets. It fails when ATR has been compressed during a tight range right before an expansion — the stop computed from the quiet period is then far too tight for the move that follows.
3. A trailing exit for trend-following. A Chandelier-style ratcheting stop is designed to stay out of the way during an impulse and exit when character changes. In a clean, persistent trend this is where ATR stops earn their reputation. In a sideways or stair-stepping market they are hit repeatedly near local extremes, which is exactly what the SOL example below shows.
4. A volatility filter for the whole plan. Some traders compare ATR to its own moving average, or to ATR as a percentage of price, and reduce size or stand aside when volatility is in the top decile of recent readings. This matters for liquidation risk on perpetuals, where a volatility spike can reach both the stop and the maintenance margin level inside one candle.
In crypto, three extras matter. Markets run 24/7, so true range rarely contains real gaps, but thin books produce long wicks that punish stops anchored on highs and lows rather than closes. Perpetual futures add funding and leverage: your ATR stop must sit comfortably inside your liquidation price, or the exchange decides your exit for you. And timeframe choice dominates everything — ATR on a 5-minute chart measures microstructure noise, while ATR on a daily chart measures the swing you are actually trying to hold.
Example on a real SOL chart
The test window is SOL/USDT perpetual on Binance, 4-hour candles, from 7 October 2026 to 5 November 2026, ending at a last close of 89.30. The rule is a long-side rolling trail: the highest value of (close − 2.5 × ATR14) over the previous 10 bars. Each time price closed below that line, a stop event was recorded. There were 9 such events in the window.
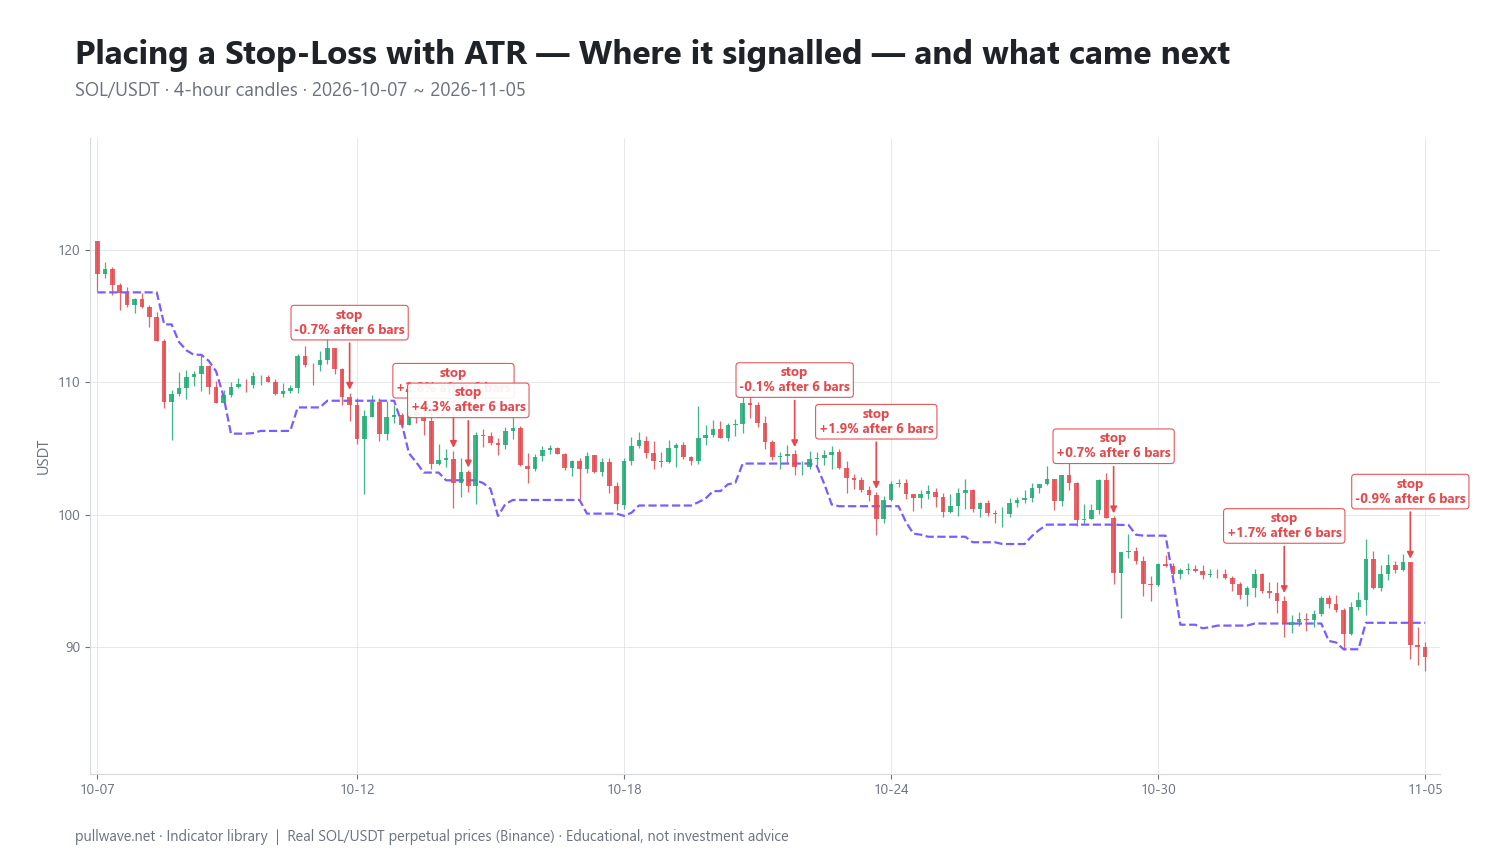
Figure 2 marks each of those 9 stop events on the same candles, with the percentage move in price 6 bars (one day) and 18 bars (three days) afterwards.
| Date (UTC) | Stop price | After 6 bars | After 18 bars |
|---|---|---|---|
| 2026-10-07 12:00 | 116.72 | −7.04% | −5.39% |
| 2026-10-12 16:00 | 108.25 | −0.69% | −2.10% |
| 2026-10-15 00:00 | 102.42 | +2.79% | +2.00% |
| 2026-10-15 08:00 | 102.14 | +4.31% | +1.77% |
| 2026-10-22 16:00 | 103.58 | −0.06% | −1.76% |
| 2026-10-24 12:00 | 99.72 | +1.88% | +1.20% |
| 2026-10-29 20:00 | 95.62 | +0.71% | −1.16% |
| 2026-11-02 16:00 | 91.74 | +1.66% | −1.84% |
| 2026-11-05 12:00 | 90.16 | −0.95% | −0.95% |
The results were mixed, and reading them honestly is the point. Six bars after the stop, price was lower in 4 of the 9 cases — so in a majority of instances, exiting the long at the stop meant missing a short-term bounce. Stretch the horizon to 18 bars and 6 of the 9 stops were followed by a lower price, which fits the fact that SOL fell from the 116 area to 89.30 over the month.
The first event carries most of the value. The stop at 116.72 was followed by a −7.04% move within one day and −5.39% after three days; a long that ignored it would have absorbed the whole drop. The cluster on 15 October is the opposite case: two stops eight hours apart at 102.42 and 102.14, followed by +2.79% and +4.31% in a day. That is the classic whipsaw — a trail firing into a local low.
Note what the rolling window did here. Because the anchor is the maximum over only the last 10 bars, each leg down eventually pushed old, higher anchors out of the window, and the line re-armed at a new, lower level — 116.72, then 108.25, then 102.42, and so on down to 90.16. A ratcheting trail anchored at entry would not have re-armed lower: it would have fired once and stayed fired until a new position was opened. The nine events in this table are therefore nine separate re-entries of the same mechanical rule, not nine failures of one stop.
Nine stop events in roughly 29 days of 4h candles is a high frequency, and it tells you the configuration was reactive for this market. A stepped-down trend with sharp counter-rallies kept re-arming the line and getting hit again. A larger multiplier or a longer lookback would have produced fewer exits; it would also have given back more on the 7 October drop. This is one market, one timeframe, one month and one parameter set — it illustrates the mechanics and the trade-off, and it proves nothing about future behavior.
Common mistakes
- Treating a stop hit as a reversal signal. A 2.5 ATR move against you says volatility expanded, nothing more. Flipping to a short at every stop would have been punished repeatedly in the table above.
- Letting a ratcheting trail move against you. If you are running the running-maximum version, falling price plus rising ATR must never be allowed to push the long stop lower. This applies to the ratcheting form only — the rolling k-bar rule used in the example is designed to re-anchor and will step down legitimately, which is a different thing.
- Running a rolling trail without a hard floor. Because the rolling version can decrease, it is not by itself a guaranteed maximum loss. Traders who use it usually pair it with a static initial stop that never moves, and let the rolling line act as the profit-giving-back exit above that floor.
- Sizing first, then placing the stop. The order matters: stop distance comes from ATR, position size comes from the stop. Reversing it produces random risk per trade.
- Using wicks as the trigger on crypto perps. Single-print liquidation wicks can reach far below the line and reverse in the same candle. Many traders require a close beyond the line, as the example rule does.
- Ignoring the liquidation price. On leveraged positions, an ATR stop that sits beyond the maintenance margin level is decorative. Leverage should be chosen so the stop triggers well before liquidation.
- Mixing ATR periods and chart timeframes carelessly. ATR14 on 4h candles describes roughly two and a half days of range. Applying a daily-chart multiplier to a 15-minute ATR produces a stop that fits neither.
Combining it with other tools
ATR has no direction, so it pairs naturally with anything that does. A trend filter — a long moving average, higher-high/higher-low structure, or ADX above a threshold — helps decide whether a trailing ATR exit is appropriate at all; in a confirmed range, a stop beyond the opposite side of the range may make more sense than a volatility-scaled trail.
Structure and ATR work well together. Find the invalidation level first (below the swing low, beyond the range boundary), then check whether that level is at least 1.5–2 ATR away. If it is closer, the stop sits inside the noise band; if it is far beyond 3 ATR, the trade's risk may be too large for the setup. Using the further of "structure level plus a small buffer" and "entry − m × ATR" is a common compromise.
ATR also complements Keltner Channels and SuperTrend, which are built from the same volatility input, and it underpins any risk model that normalizes exposure across assets — the same ATR-fraction stop lets you compare risk on BTC, SOL and a thin altcoin on one scale. What it does not combine with is wishful thinking: an ATR stop only helps if you honor it.
Frequently asked questions
Q. What is the best ATR multiplier for a stop-loss?
There is no universally best value, but most traders work between 1.5 and 3 times ATR. Below 1.5, the stop sits inside normal bar-to-bar noise and gets hit frequently; above 3, exits are rare but each loss is large and position size must shrink accordingly. The right choice depends on your holding period and how many small losses your approach can tolerate.
Q. What ATR period should I use for crypto?
Wilder's default of 14 is a reasonable starting point on any timeframe, and it is what most charting platforms use. Shorter periods such as 7 or 10 react faster to volatility spikes, which suits intraday trading; 20 to 22 produces a steadier distance for swing positions. The period should match the timeframe you actually trade, not the one you watch for context.
Q. What is the difference between a ratcheting ATR trail and a rolling one?
A ratcheting trail takes the running maximum of (reference − m × ATR) since entry, so the level can only improve and never move against the position. A rolling trail takes the maximum over the last k bars only, so it re-anchors as the window moves and can step down when older, higher anchors drop out. The ratcheting form is a true risk limit; the rolling form is a dynamic exit line and is usually combined with a fixed initial stop.
Q. Is an ATR stop better than a fixed percentage stop?
An ATR stop adapts to current conditions, so the same rule produces a tight stop in a quiet market and a wide one during a volatility expansion; a fixed percentage stop does not. That adaptation is usually an advantage in crypto, where realized volatility can triple within days. The trade-off is that your risk distance keeps changing, so you must recompute position size on every trade.
Q. Should the ATR stop trigger on a wick or on a close?
Both are used. Triggering on the intrabar high or low reacts immediately but is vulnerable to single-print liquidation wicks on perpetual futures; requiring a candle close beyond the line filters those out at the cost of a worse exit price when a real breakdown occurs. Many crypto traders use close-based triggers on 1h and higher timeframes.
Q. Why does my ATR trailing stop get hit so often in a sideways market?
Because a trailing stop assumes trend continuation. In a range or a stair-stepping decline, price repeatedly travels the full width of the swing, and any line placed a couple of ATR below the recent extreme will be reached near the lower boundary. The SOL window on this page shows 9 stop events in about one month for that reason. Widening the multiplier, lengthening the lookback, or using a trend filter to disable trailing in ranges are the usual responses.
Key takeaways
- An ATR stop converts recent volatility into a price distance: stop = entry (or a recent extreme) minus a multiple of the 14-period Average True Range, calculated with Wilder's smoothing.
- ATR was introduced by J. Welles Wilder Jr. in New Concepts in Technical Trading Systems (1978) and was designed from the start to drive volatility-based trailing stops; the Chandelier Exit is the best-known ratcheting variant.
- Know which trail you are running: a running-maximum trail never moves against you, while a rolling k-bar trail re-anchors each bar and can step down, so it needs a fixed initial stop underneath it.
- The multiplier controls the trade-off directly — tighter means more frequent exits and smaller losses, wider means fewer exits and larger ones — and position size should always be derived from the stop distance, never the other way round.
- ATR measures size, not direction. In the SOL/USDT 4h window tested, the rule fired 9 times in a month, avoided a 7.04% drop on the first event and whipsawed into a bounce on others; on leveraged perpetuals the stop must always sit well inside the liquidation price.
Educational material. Charts use real SOL/USDT perpetual prices; past behaviour does not predict future results. Not investment advice.